
Traffic through the Strait of Hormuz has jumped by almost 400% in two weeks, with nearly 200 ships navigating the Strait last week. That’s up from around 150 the week before, and just 40 two weeks earlier.
At first glance, this sounds like the Hormuz situation is finally starting to soften.
But there’s a bit of a contradiction here.
Iran’s own oil shipments to Asia have now almost dried up, even before the US announces its latest round of sanctions against Tehran. Loaded Iranian vessels are reportedly getting trapped inside the Gulf, while empty tankers are struggling to get in, and the cost of those cargoes has jumped to its highest level in years.
Iran’s central bank governor even said last week that the country’s crude exports have “virtually stopped”.
So while more ships are getting through the Strait, that does not necessarily mean Iran’s oil exports, or the wider oil market, are returning to normal.
And that makes the WTI chart quite interesting, because technically, oil is still in a local uptrend.
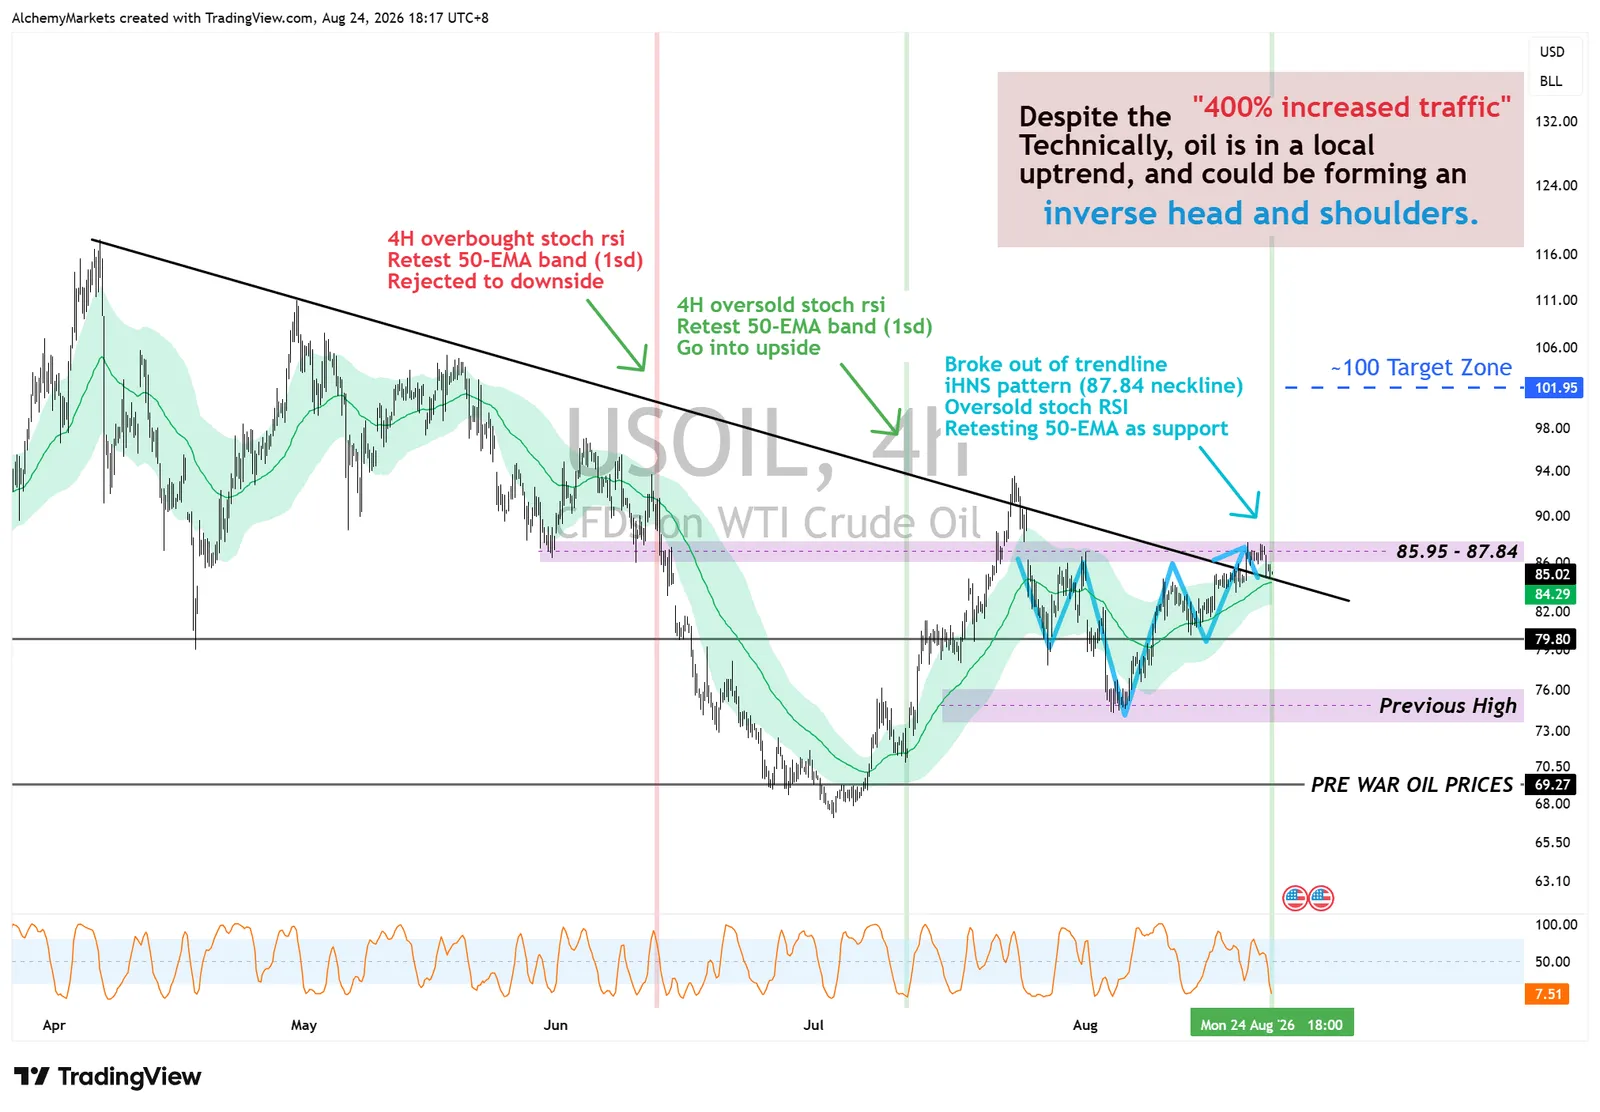
WTI has broken through the descending trendline we’ve been tracking, and price is now retesting the 4H 50-EMA band after the Stochastic RSI moved back into oversold territory.
There is also a possible inverse head-and-shoulders forming here, with the neckline around 85.95–87.84.
If the 50-EMA band continues to act as support, and WTI can properly break through that neckline, the measured move points towards roughly the $100 area.
That’s what I’ll be watching over the next few days.
- If Hormuz really is softening, does oil finally start breaking lower?
- Or does WTI hold the local uptrend despite more traffic getting through the Strait?
Elsewhere, equities have been remarkably calm.
The VIX has now been sitting in extreme low-volatility territory for 17 days straight...