
USDJPY traded near 163.50 on Monday, leaving the pair within reach of the 1986 high at 164.50. The level matters, but the more useful signal is what failed to move the pair.
Price continues to make higher highs, while daily RSI is making lower highs. The bearish divergence shows weaker momentum, and has preceded a few notable declines on USDJPY – especially when the divergence taps into the overbought region.
The same setup is repeating now, and 1986’s high at 164.500 would be a critical resistance to watch for this setup to trigger.
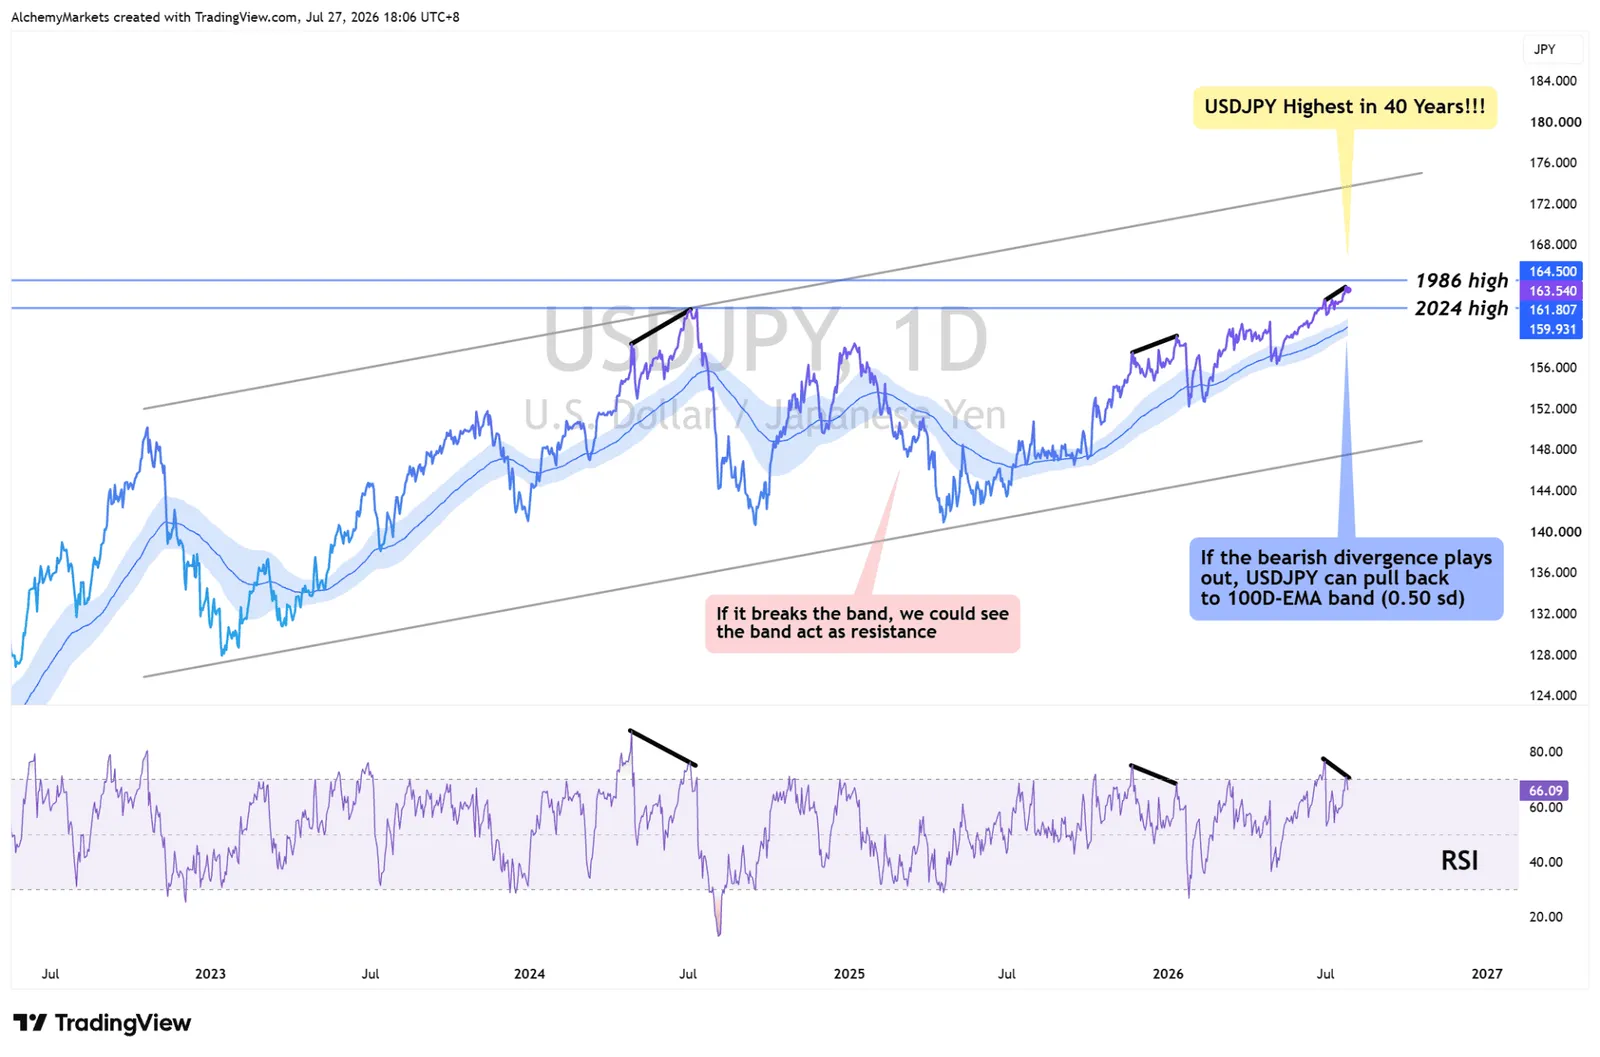
If a decline happens, I would first expect this 100 EMA band to hold. Only when USDJPY closes below the band, followed by weakness through 158 and softer AUDJPY or GBPJPY, would the data provide stronger evidence that yen-funded carry positions are unwinding.
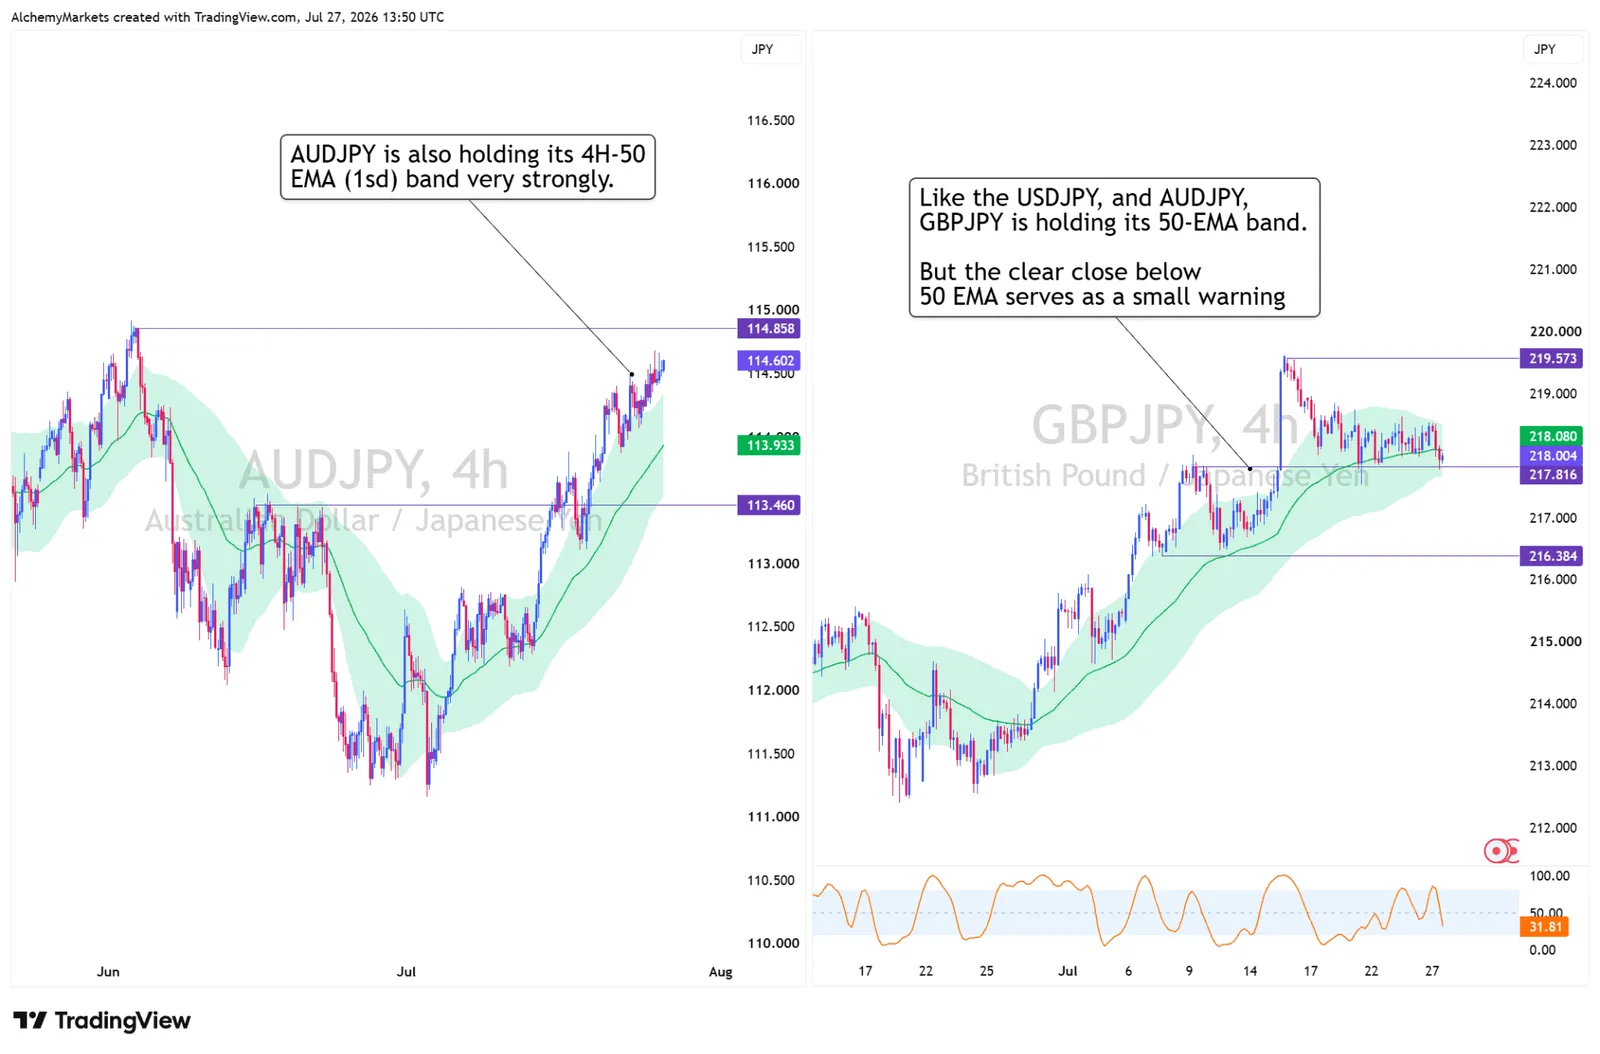
As of now, AUDJPY and GBPJPY are still holding their 4H-50 EMA (1 standard deviation) bollinger band, but if that breaks, it would be the first short term sign of a strengthening Yen.
Cooling oil changes the intervention balance
WTI reached its bull-flag target above $90 before falling into its four-hour 50-EMA band and the 76.73-83.99 support region.
The decline reflects the latest de-escalation move...