just now

Liquidity Finder Ltd is incorporated in England and Wales, company number 10610740, registered address 167-169 Great Portland Street, Fifth Floor, London W1W 5PF, United Kingdom.
Published: just now
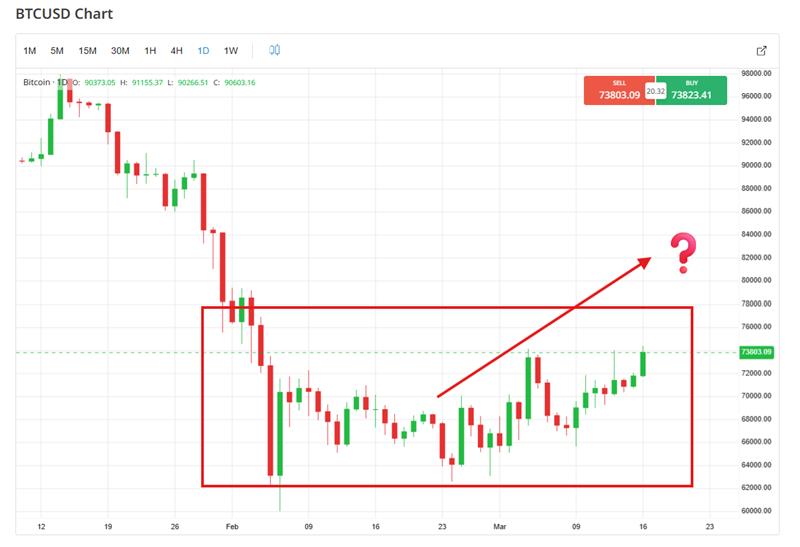
Bitcoin is at a crossroads that separates the "moon boys" from the professional operators. As of today, Monday, March 16, 2026, BTCUSD is trading at $73,786.72, up 3.43% in a move that looks, on the surface, like a textbook V-shaped recovery. However, beneath the hood of this rally lies a "Priced-In Trap" that could catch retail traders off guard.
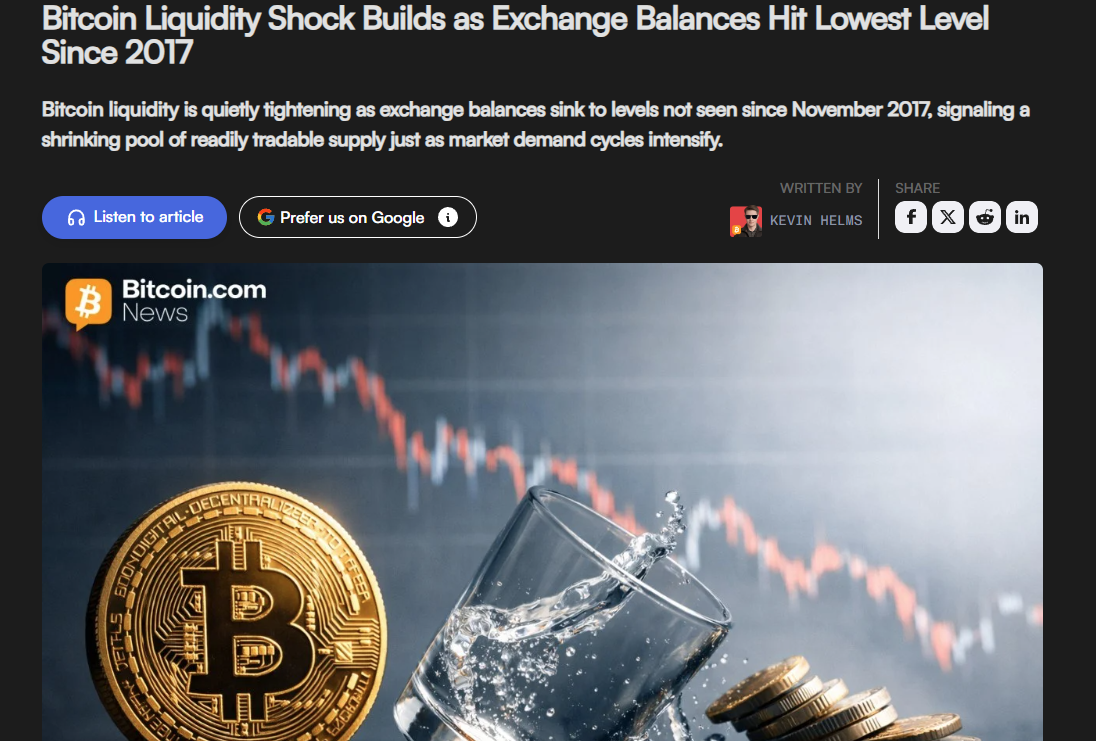
While the "Fear & Greed Index" remains suppressed in the "Extreme Fear" zone (currently reading 16), price action has decoupled from sentiment. This "disbelief rally" is being driven by a perfect storm: escalating Middle East tensions pushing oil toward $120, a looming FOMC meeting (March 17-18), and a systemic liquidity shock as exchange balances hit 2017 lows.
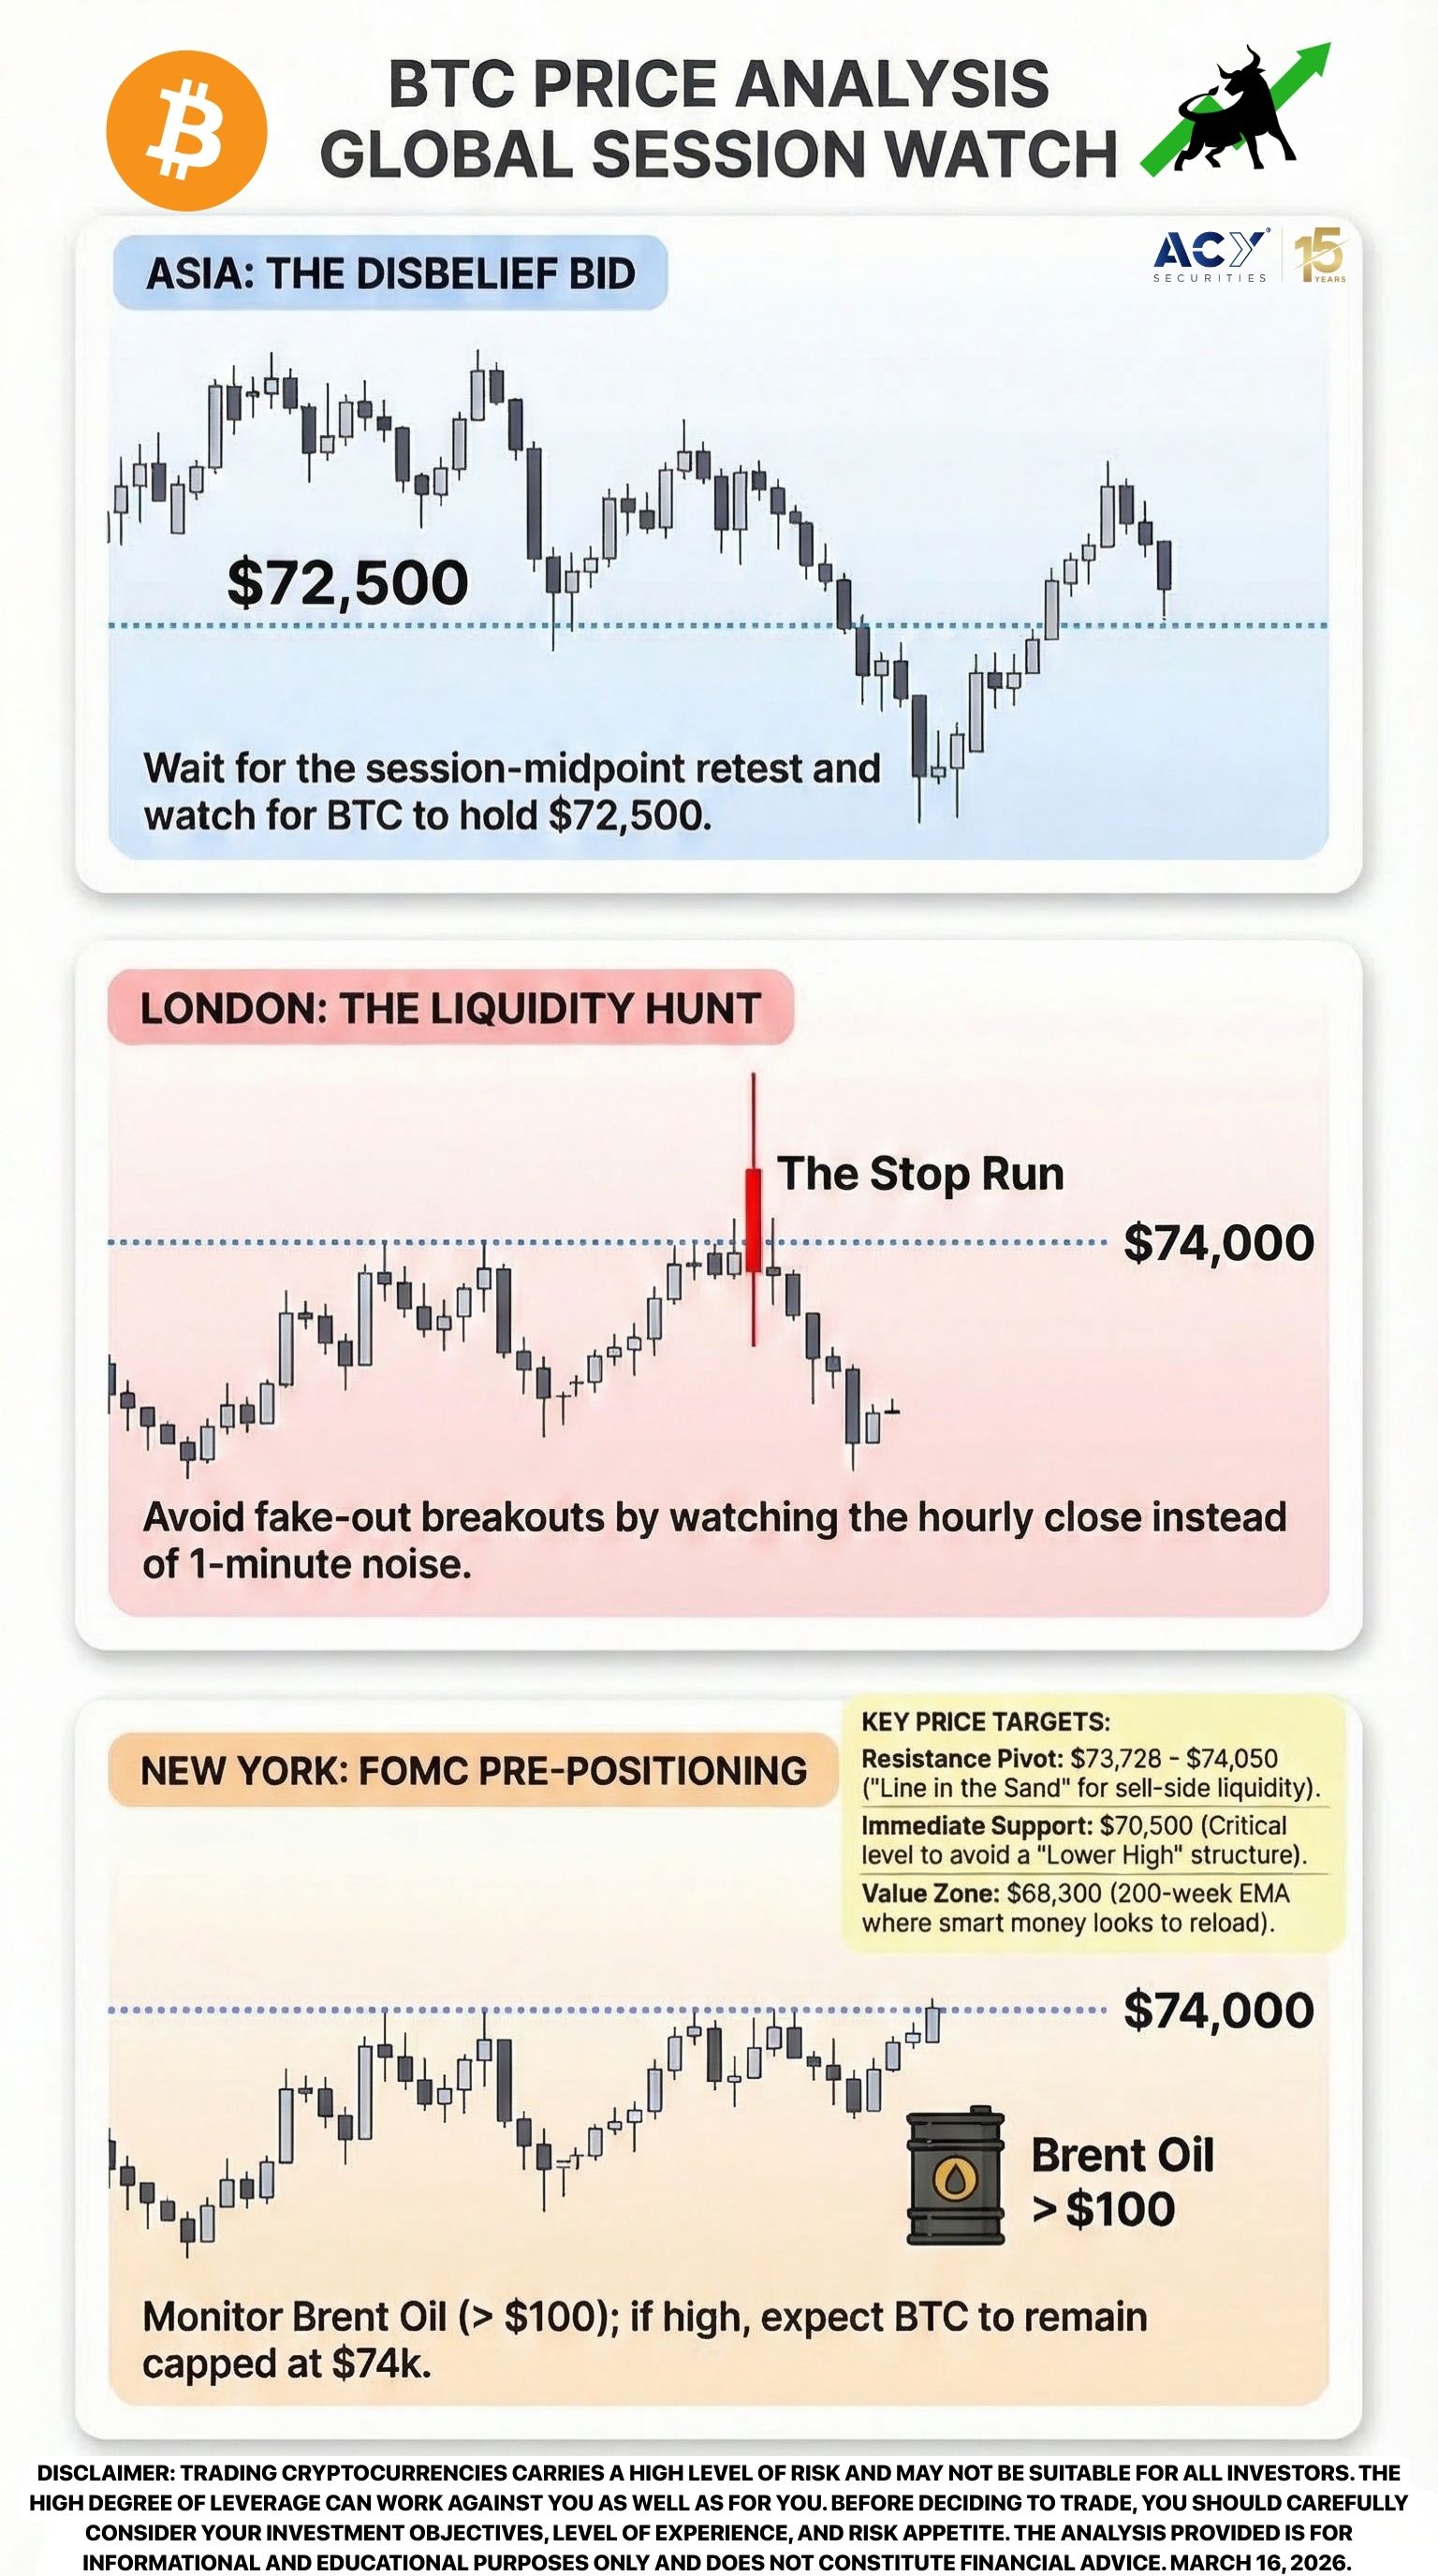
But there is a massive technical ceiling looming. The $74,000 zone isn't just a round number; it is a graveyard of previous support that has flipped into a formidable supply wall.
Read more about the 'Crowd Psychology' in our Forex News Mastery eBook
Looking at the daily BTCUSD chart, the price action from late January and February tells the real story. During the massive February breakdown, the $74,000 level served as a critical floor. When that floor collapsed, it didn't just drop it cratered, leaving behind a "supply vacuum" where institutional sell orders are now lying in wait for a retest.
Key Levels to Watch:
The current V-shaped move has been sharp, but it lacks the volume profile of a sustainable trend reversal. Without a decisive daily close above $74,050, the current move risks becoming a "Bull Trap" designed to provide liquidity for larger players to exit before the FOMC decision.


The fundamental narrative for March 16, 2026, is a tug-of-war between two massive forces:
With Brent Crude futures surging 5% today toward $119 per barrel following strikes on key infrastructure in the Strait of Hormuz, Bitcoin is being bid as a non-sovereign hedge. Unlike 2022, the 2026 market views Bitcoin as "Digital Gold" during energy-driven inflationary shocks. This is evidenced by the $767 million in ETF inflows last week, led by BlackRock’s IBIT.
The Federal Reserve meets tomorrow, March 17. While a rate hold at 3.50%–3.75% is 94% priced in, the "Dot Plot" (the Fed’s internal rate projections) is the real danger. If the Fed signals "zero cuts" for the remainder of 2026 due to oil-driven inflation, the $74k resistance will likely hold, and we could see a swift 10% correction toward $65,000.
While Bitcoin rallies, the underlying infrastructure is showing cracks. The Chapter 11 filing of BlockFills today reminds us that the "January-February" downturn has left scars. While exchange balances are at 2017 lows (historically bullish), the bankruptcy of a major lender suggests that the "liquidity shock" could cut both ways if a forced liquidation of their 71 BTC (and related holdings) occurs during a period of low order-book depth.
To navigate this volatility, you must move away from reactive trading and toward proactive positioning. Here is how we are viewing the sessions today:
Forget the temptation to short the early morning momentum just because it "feels too high." Since you understand that the Asian session often sets the "value area" for the day, you’ll see how waiting for a session-midpoint retest removes the stress of chasing candles. This setup naturally aligns with your patience to wait for the highest probability moves. The Prescription: Utilize the Sentiment Fade concept from Page 15 of the Forex News Mastery eBook. If the Nikkei continues to rally, look for BTC to hold the $72,500 level.
Will you wait for the 5-minute consolidation at the open, or set your limit orders now?
Don't be fooled by "fake-out" breakouts at the London open. This session is famous for hunting stops above $74,000 before reversing. Since you have the discipline to watch the hourly close rather than the 1-minute noise, you are already ahead of 90% of the retail crowd. The Prescription: This is a classic Dual-Sided Breakout environment as described on Page 25 of the eBook. Look for a "Stop Run" above the February highs followed by a swift move back into the range.
Do you prefer the aggressive entry on the wick, or the conservative entry on the candle close?
Stop trying to "predict" the Fed's next move. Instead, focus on the "Priced-In Trap" mentioned on Page 13 of our Forex News Mastery eBook. Since you value risk management over "gambling" on news, you’ll find that waiting for the NY afternoon "theta decay" provides the clearest entries. The Prescription: Watch the correlation with Oil. If Brent stays above $100, expect BTC to remain resilient but capped at $74k.
Will you de-risk before the 2:00 PM ET bell tomorrow, or hold through the volatility?
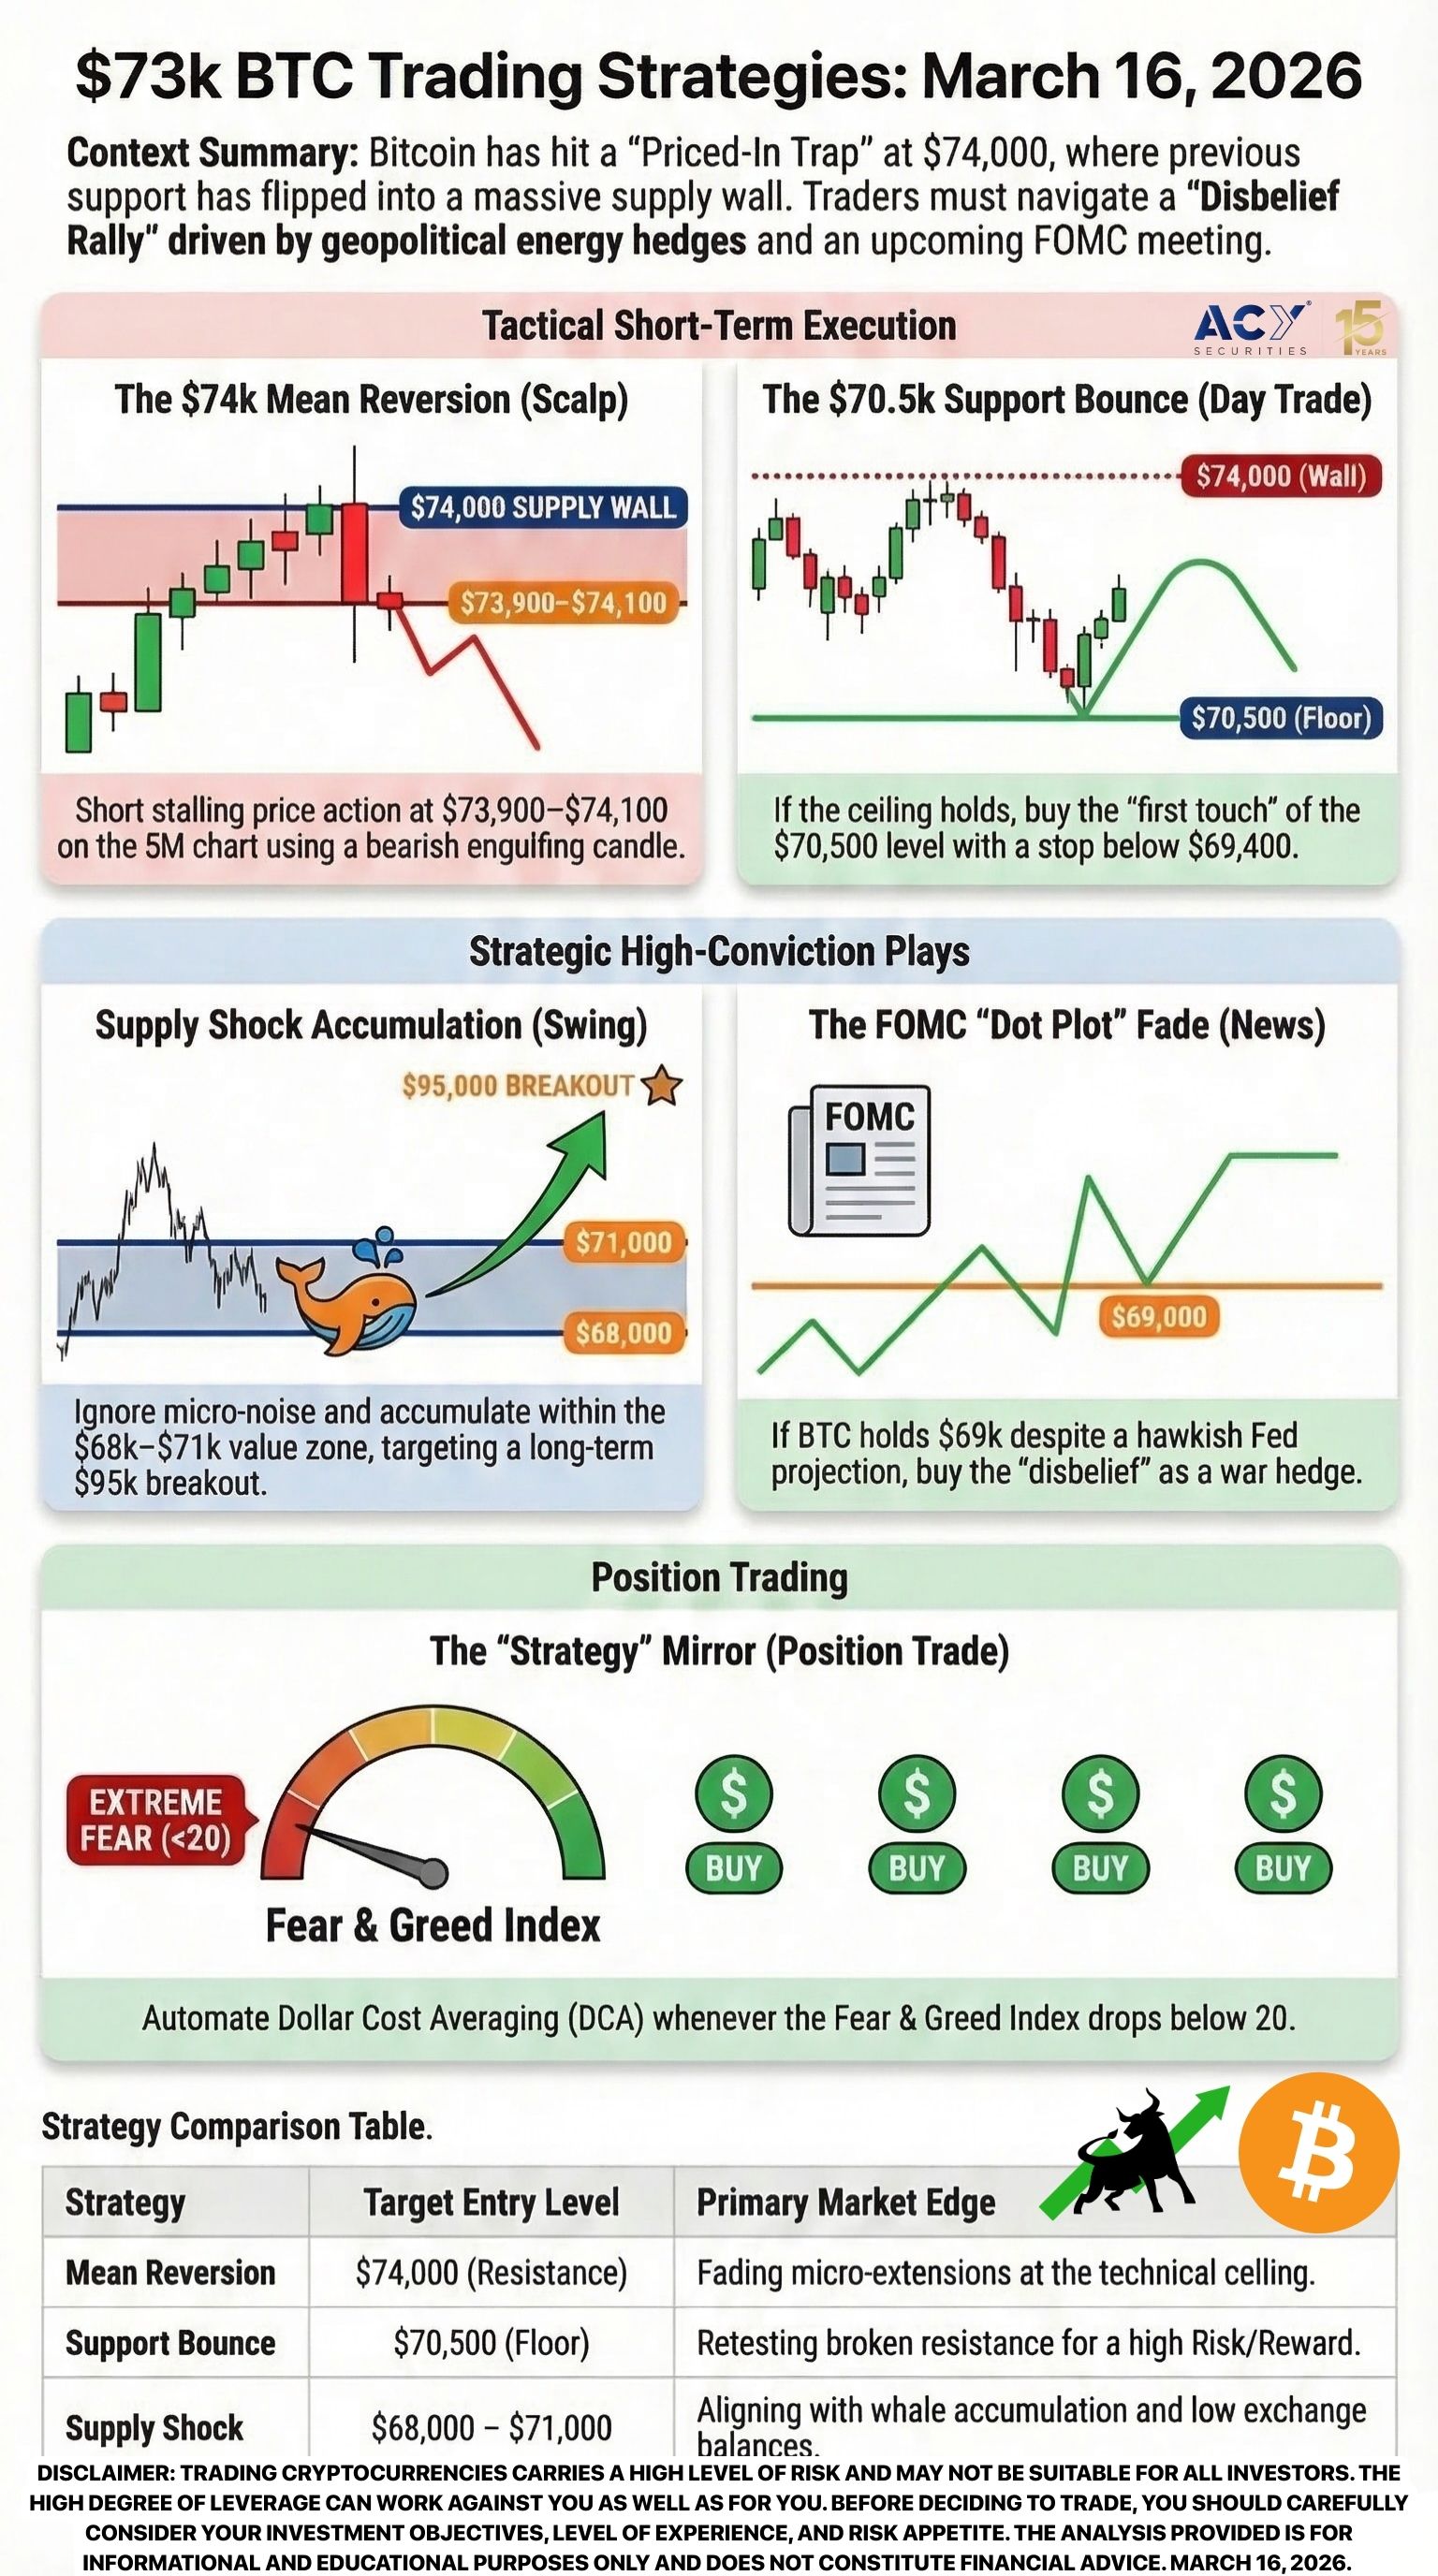
Bitcoin is currently a "Disbelief Rally" testing a "Supply Graveyard." The $74,000 zone will not break easily. It requires a fundamental catalyst likely a dovish shift in the Fed's dot plot or a further escalation in the "Energy War" that solidifies BTC as a mandatory hedge.
At ACY Securities, we don't just give you the levels; we give you the framework to trade them. The Dual-Sided Breakout strategy is your most powerful tool this week. If we reclaim $74,000 on a weekly close, the path to $95,000 is open. If we fail, $65,000 is the next stop.
Ready to master the macro?
Disclaimer: Trading cryptocurrencies carries a high level of risk and may not be suitable for all investors. The high degree of leverage can work against you as well as for you. Before deciding to trade, you should carefully consider your investment objectives, level of experience, and risk appetite. The analysis provided is for informational and educational purposes only and does not constitute financial advice. March 16, 2026.
ACY Securities is one of Australia's fastest growing multi-asset online trading providers, offering ultra-low-cost trading, rock-solid execution, technologically superior account management and premium market analysis.
Select the categories and companies you wish to follow directly to your person rss feed.
Create Custom RSS FeedSign up and join over 5,000 professional members who receive personalized news alerts, curated professional connections, and more for free!
Spotex has appointed Joe Tuccio, previously Head of Digital Partnerships at Seabury Capital, as Head of Digital Assets. Tuccio brings 20 years of financial markets experience and will lead partnerships with liquidity providers and custodians as Spotex expands its institutional FX venue into digital assets.
RoboForex has integrated its MobileTrader platform into Telegram as a Mini App, giving traders account management, order execution, analytics and copy trading access within the messaging platform, with real-time synchronisation across Telegram, iOS, Android and web versions.
Learn how deliberate practice can improve your trading skills faster than spending more time on the charts. Discover practical tips to build discipline, consistency, and long-term trading success.
XS.com has appointed Anna Pastusenco as Group PSP and Banking Manager, tasking her with leading global payment partnerships across banks, EMIs and PSPs. She joins from IC Markets, bringing experience in payment infrastructure, banking relationships and commercial negotiations to the global broker's expanding payments ecosystem.
Looking at the latest Gold XAU/USD price action? See why a bearish trend continuation point to a massive drop.
Want to learn how to trade ECB events? Discover the top strategies for ECB announcement days, including volatility trading and breakout tactics.
Darwinex has integrated with TradingView, letting traders on the charting platform build a verified, publicly auditable track record from every trade. The move links Darwinex's regulated broker and Darwinex Zero development platform to investor capital allocation, based purely on trading performance.
Pepperstone has appointed Mohammed Almadhoun as Head of Middle East and Osama Hamdan as Head of Sales, strengthening its regional leadership team as the FX and CFD brokerage continues its expansion across the UAE, GCC and wider MENA region following its Dubai office launch.
Payments company Stripe and private equity group Advent International have launched a joint offer to acquire New York-listed payments group PayPal in a deal that would value the business at around $53bn, according to the Financial Times.
ATFX has launched the World Trading Cup, a three-stage trading competition offering up to USD 210,000 in prizes. Pre-registration opens 20 July 2026, with regional qualifiers and finals leading to a global final in December, where 15 traders from five regions will compete for the championship title.