just now
Liquidity Finder Ltd is incorporated in England and Wales, company number 10610740, registered address 167-169 Great Portland Street, Fifth Floor, London W1W 5PF, United Kingdom.
Published: just now
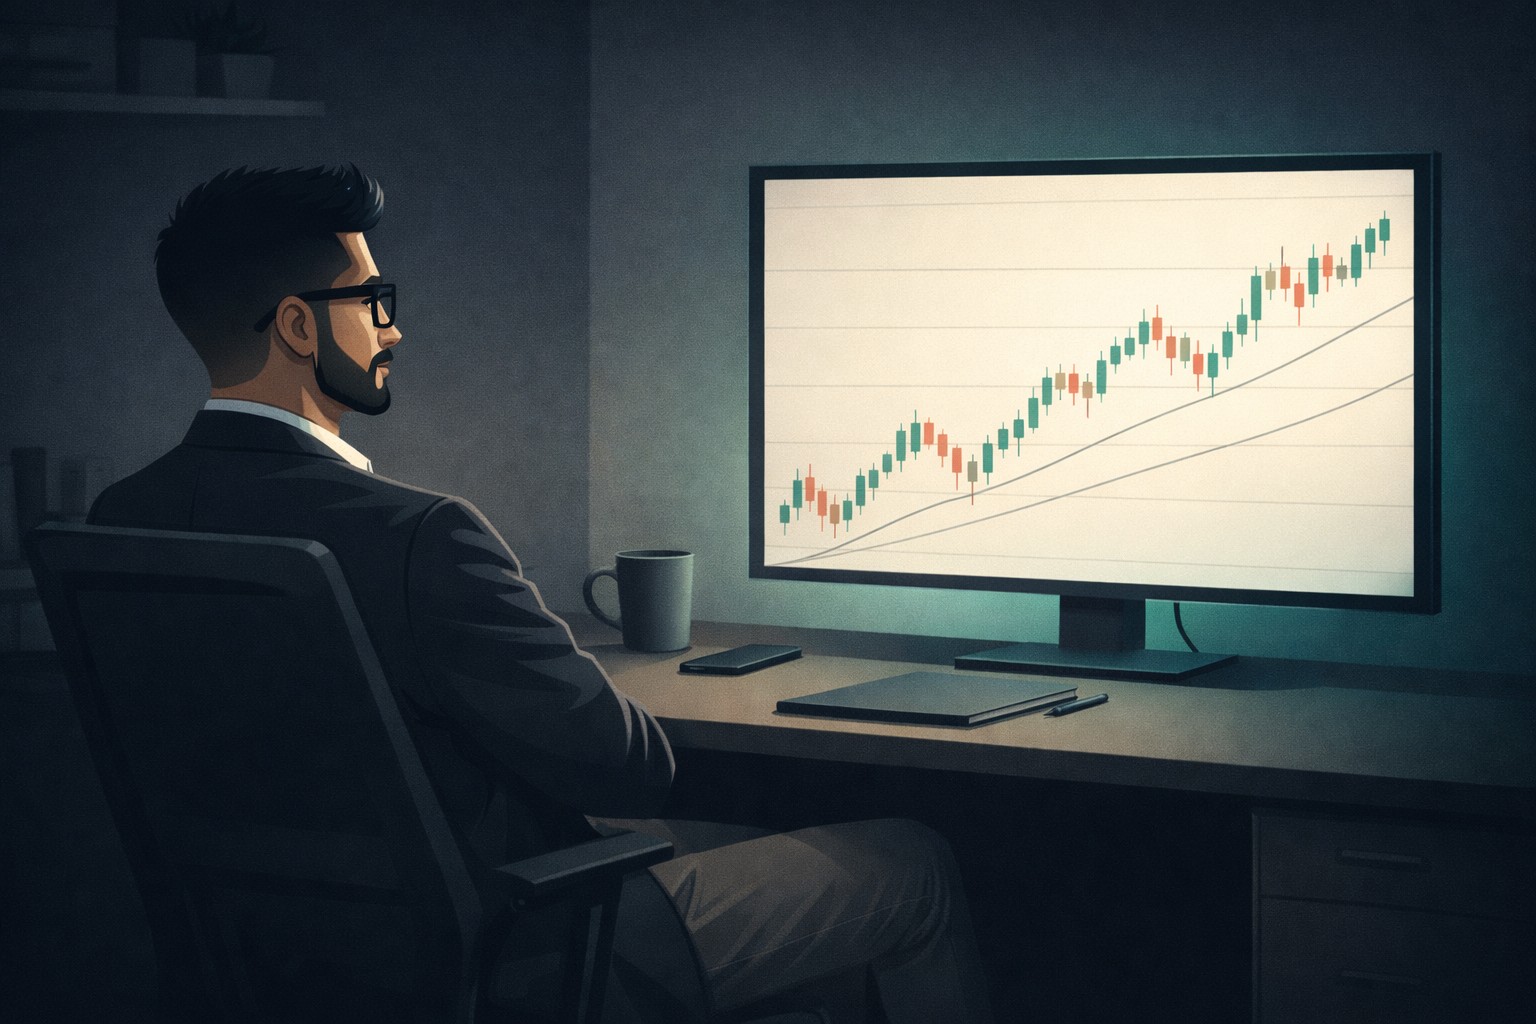
Most traders don’t lose because they can’t read charts. They lose because they read too much into them.
Indicators stack up. Signals contradict each other. Every candle feels important. Instead of clarity, charts become noisy, stressful, and overwhelming. In Trading for a Living, Alexander Elder repeatedly warns against this exact trap. The goal of chart reading is not to predict every move, but to identify structure - the visible footprint of crowd behavior left behind on price.
Once you understand how mass psychology drives price movement, the next step is learning how to see it clearly - without clutter.
A chart does not tell the future. It tells you where price has been accepted, rejected, and contested.
Elder treats charts as organizational tools, not crystal balls. Their value comes from helping traders see:
When traders expect charts to predict outcomes, they overload them. When they expect charts to describe structure, simplicity starts to make sense. That mental shift is the same one explored in How to Think Like a Price Action Trader - observing first, reacting second.
Indicators aren’t the enemy. Emotional dependence is.
Elder explains that many traders add indicators when uncertainty rises - not because the tools add clarity, but because the trader is uncomfortable making decisions . More indicators feel like protection, but they usually do the opposite.
Most indicators:
This is why traders feel stuck despite having “signals.” If your chart feels heavy or mentally exhausting, stripping it back to a minimalist trading indicator approach often restores clarity faster than adding anything new.
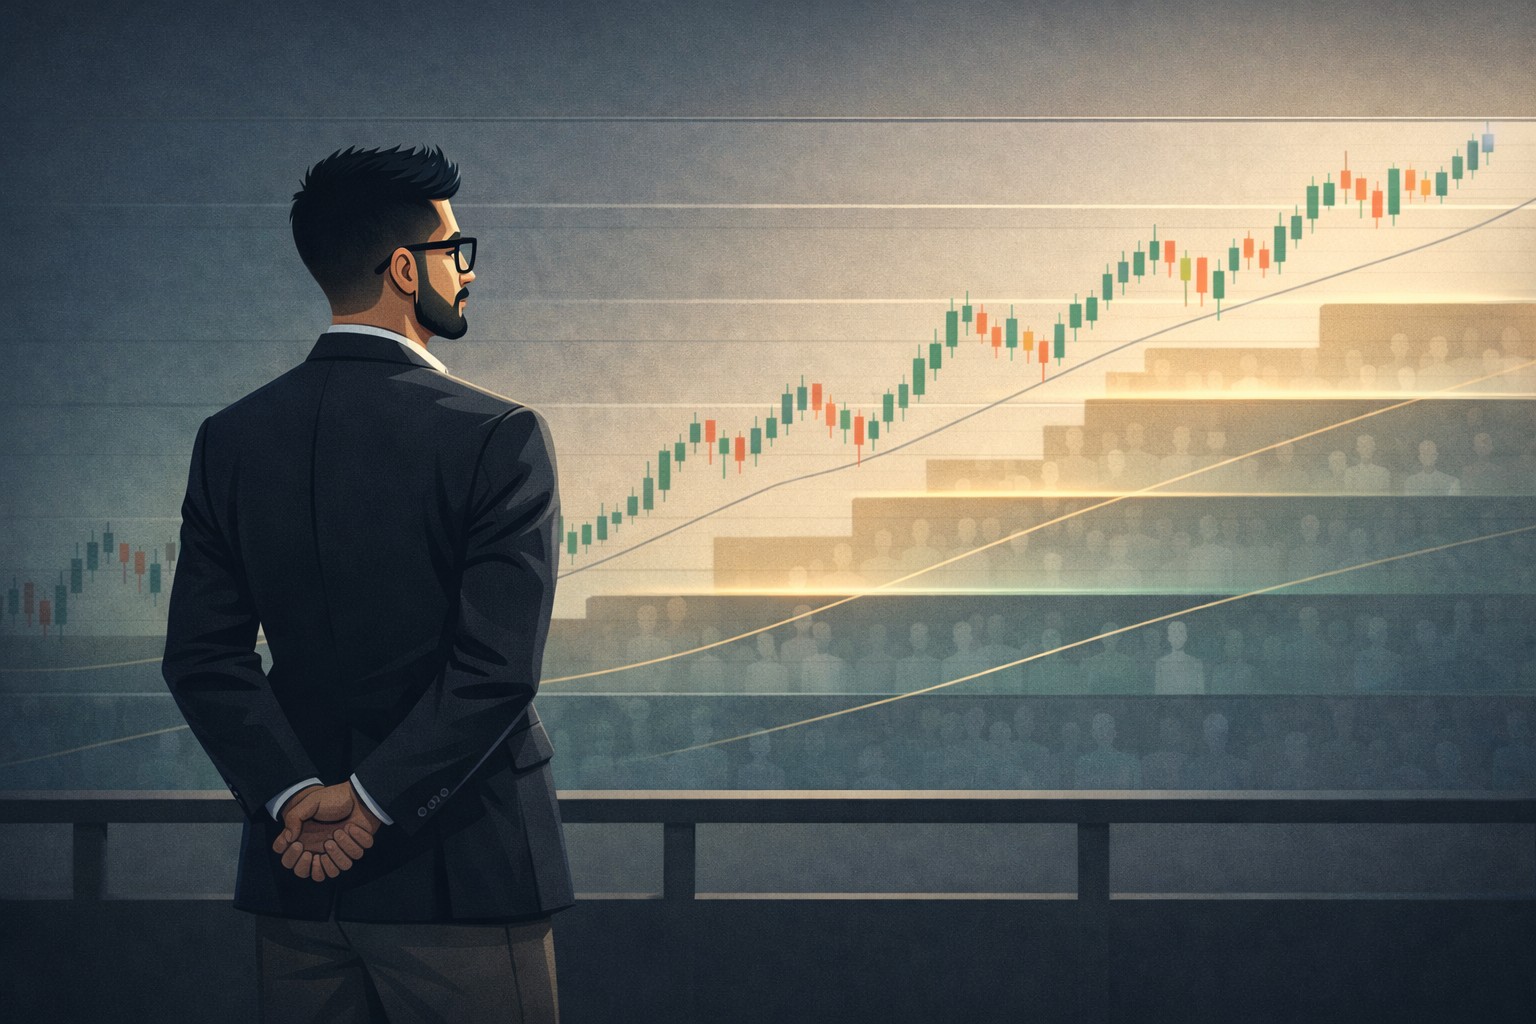
Market structure is simply organized crowd behavior.
Elder makes it clear that trends, ranges, and breakouts exist because traders remember where they felt pain, relief, or regret. Those memories shape decisions long after the event.
That’s why price consistently reacts around:
Support and resistance aren’t lines - they’re zones of memory. Once you start reading structure this way, price action at key levels stops feeling random and starts feeling familiar.
One of the most overlooked benefits of clean charts is psychological.
Elder notes that emotional mistakes increase as decision complexity increases. When traders have too many signals to interpret, they hesitate, override rules, or act impulsively.
Clean charts don’t remove uncertainty. They remove reaction.
That’s why traders who simplify their charts often notice:
This transition mirrors what happens when traders shift from impulse-driven behavior to structured control, as outlined in Discipline vs. Impulse in Trading.
Markets change. Human behavior doesn’t.
Elder explains that traders remember where they were wrong, where they were right, and where they hesitated. Those emotional memories cluster orders around certain areas, causing price to react again and again.
That’s why price:
Support and resistance aren’t mystical concepts - they’re psychological anchors reinforced by repetition, something explored deeper in Mastering Price Action at Key Levels.
Elder never argued against indicators. He argued against letting them replace thinking.
Used properly, indicators:
Used poorly, they:
This is why experienced traders usually commit to one or two tools they understand deeply - often something as simple as moving averages - instead of constantly rotating systems, a philosophy applied in the Moving Averages Trading Strategy Playbook.

Imagine driving while staring only at your dashboard.
Speed, RPM, fuel - all useful.
But if you ignore the road, you crash.
Charts are the road.
Indicators are the dashboard.
Professional traders watch structure first. Indicators only help confirm what’s already visible.
One of the most dangerous effects of noisy charts is false certainty.
When multiple indicators align, traders feel validated - even when structure is weak. Elder warns that confidence without structural backing often leads to oversized risk and emotional attachment.
That’s why many traders feel most confident right before they’re wrong - a pattern often reinforced by overconfidence and cognitive traps in trading.
Clarity doesn’t come from agreement between indicators. It comes from alignment between structure, risk, and behavior.
Clarity in trading doesn’t come from complexity.
It comes from seeing what matters and ignoring what doesn’t.
When noise disappears, structure becomes visible.
When structure becomes visible, execution becomes calm.
That’s when trading stops feeling overwhelming - and starts feeling professional.
Yes. Most rely on structure first and use indicators only for confirmation.
It can be - unless structure and invalidation rules are clearly defined.
No. They’re useful when they support structure, not replace it.
Because they remove false certainty and force patience.
It’s time to go from theory to execution!
Create an Account. Start Your Live Trading Now!
Looking for step-by-step approaches you can plug straight into the charts? Start here:
Sharpen your edge with proven tools and frameworks:
News moves markets fast. Learn how to keep pace with SMC-based playbooks:
From NASDAQ opens to DAX trends, here’s how to approach indices like a pro:
Gold remains one of the most traded assets - here’s how to approach it with confidence:
Candlesticks are the building blocks of price action. Master the most powerful ones:
Ready to go intraday? Here’s how to build consistency step by step:
Markets swing between calm and chaos. Learn to read risk-on vs risk-off like a pro:
Step inside the playbook of institutional traders with SMC concepts explained:
Forex pairs aren’t created equal - some are stable, some are volatile, others tied to commodities or sessions.
If you’ve ever been stopped out right before the market reverses - this is why:
Mindset is the deciding factor between growth and blowups. Explore these essentials:
The real edge in trading isn’t strategy - it’s how you protect your capital:
If you’re not sure where to start, follow this roadmap:
This way, you’ll grow from foundation → application → mastery, instead of jumping around randomly.
Follow me for more daily market insights!
Jasper Osita - LinkedIn - FXStreet - YouTube
This content may have been written by a third party. ACY makes no representation or warranty and assumes no liability as to the accuracy or completeness of the information provided, nor any loss arising from any investment based on a recommendation, forecast or other information supplies by any third-party. This content is information only, and does not constitute financial, investment or other advice on which you can rely.
ACY Securities is one of Australia's fastest growing multi-asset online trading providers, offering ultra-low-cost trading, rock-solid execution, technologically superior account management and premium market analysis.
Select the categories and companies you wish to follow directly to your person rss feed.
Create Custom RSS FeedSign up and join over 5,000 professional members who receive personalized news alerts, curated professional connections, and more for free!
Sterling steadies after political uncertainty rattled gilt markets, while EUR/USD and EUR/GBP approach key technical levels ahead of today's European session.
GBP/AUD remains trapped in a well-defined bearish trend on both the weekly and daily timeframes.
Discover the key drivers, technical levels, and central bank expectations shaping the EUR/USD trend as the ECB prepares to hold rates and markets watch for a potential breakout.
Sydney-based multi-asset broker ACY Securities has introduced PAXGUSD, a new CFD instrument that allows clients to trade tokenised gold against the US Dollar 24 hours a day, seven days a week. The instrument is available across MetaTrader 4, MetaTrader 5, and the ACY Trading Platform.
Binance has lowered its VIP 3 Wallet Assets threshold from $3 million to $1 million and will now count OTC Spot Trading Volume at a 4x multiplier toward VIP qualification, removing the previous VIP 4 cap and allowing eligible users to progress through the full tier framework up to VIP 9.
Retail futures trading leader NinjaTrader Group has appointed Mark Omens as Senior Vice President, Commercial Strategy, bringing a 25-year veteran of derivatives marketplace CME Group into a newly created role focused on exchange partnerships and enterprise growth.
Gold Price Action Forecast: Will XAU/USD Drop to $3930? Meta Description: Read our Gold price action forecast to see if XAU/USD will drop to $3930.
BitDelta Securities Financial Services LLC (“BitDelta Securities”) today announced that it has received full regulatory approval from the Capital Market Authority (“CMA”) of the United Arab Emirates under the Category 5 — Arrangement and Advice license framework (License No. 20200000439). The approval follows the firm's receipt of In-Principal Approval earlier this year and represents the successful conclusion of the CMA's full licensing process, including the satisfaction of capital requirements, governance appointments, and operational setup.
Crypto.com has received a $400 million strategic investment from Citadel Securities, valuing the firm at $20 billion. It marks the first institutional funding round in the company's history, aimed at accelerating its expansion into tokenised securities, derivatives and other asset classes.
WTI’s pullback into $79–82 is the first major test of the bullish Elliott Wave count, with buyers targeting a renewed break above $85.


