just now
Liquidity Finder Ltd is incorporated in England and Wales, company number 10610740, registered address 167-169 Great Portland Street, Fifth Floor, London W1W 5PF, United Kingdom.
Published: just now
Copper’s resilience since August reflects a quiet macro inflection: the global narrative flipped from “cautious slowdown” to “measured optimism.”
China’s targeted stimulus and easier central bank tone globally have encouraged traders to price in 2025 growth stabilization rather than contraction. Even as manufacturing PMIs remain soft, copper’s ability to hold the $10,000/t handle through August–September signaled that the market was leaning toward recovery, not collapse.
The shift became tangible after the International Copper Study Group projected a refined deficit by 2026, trimming 2025 mine-growth expectations. That announcement catalyzed a rotation of capital back into cyclical metals, with copper outperforming aluminum and nickel over the past month.
The once-distorted LME–COMEX arbitrage that spiked mid-year normalized through Q3, eliminating noise that had capped bullish follow-through earlier in 2024.
Meanwhile, warehouse stocks remain near multi-month lows, and large miners such as Teck and Anglo have recently revised production lower in Chile and Peru - two of the most supply-critical regions globally.
Taken together, the micro backdrop aligns with a “buy-the-dip” environment: dips near $10,000/t or $5/lb continue attracting long interest from funds positioned for the electrification cycle.
Copper isn’t a replacement for gold or silver - it’s their opposite.
For traders, copper expresses the risk-on leg of the macro barbell, while gold and silver remain the defensive counterpart. Watching the copper/gold ratio helps gauge global risk appetite: it has been climbing again since early September - confirming the market’s tilt back toward cyclical optimism.
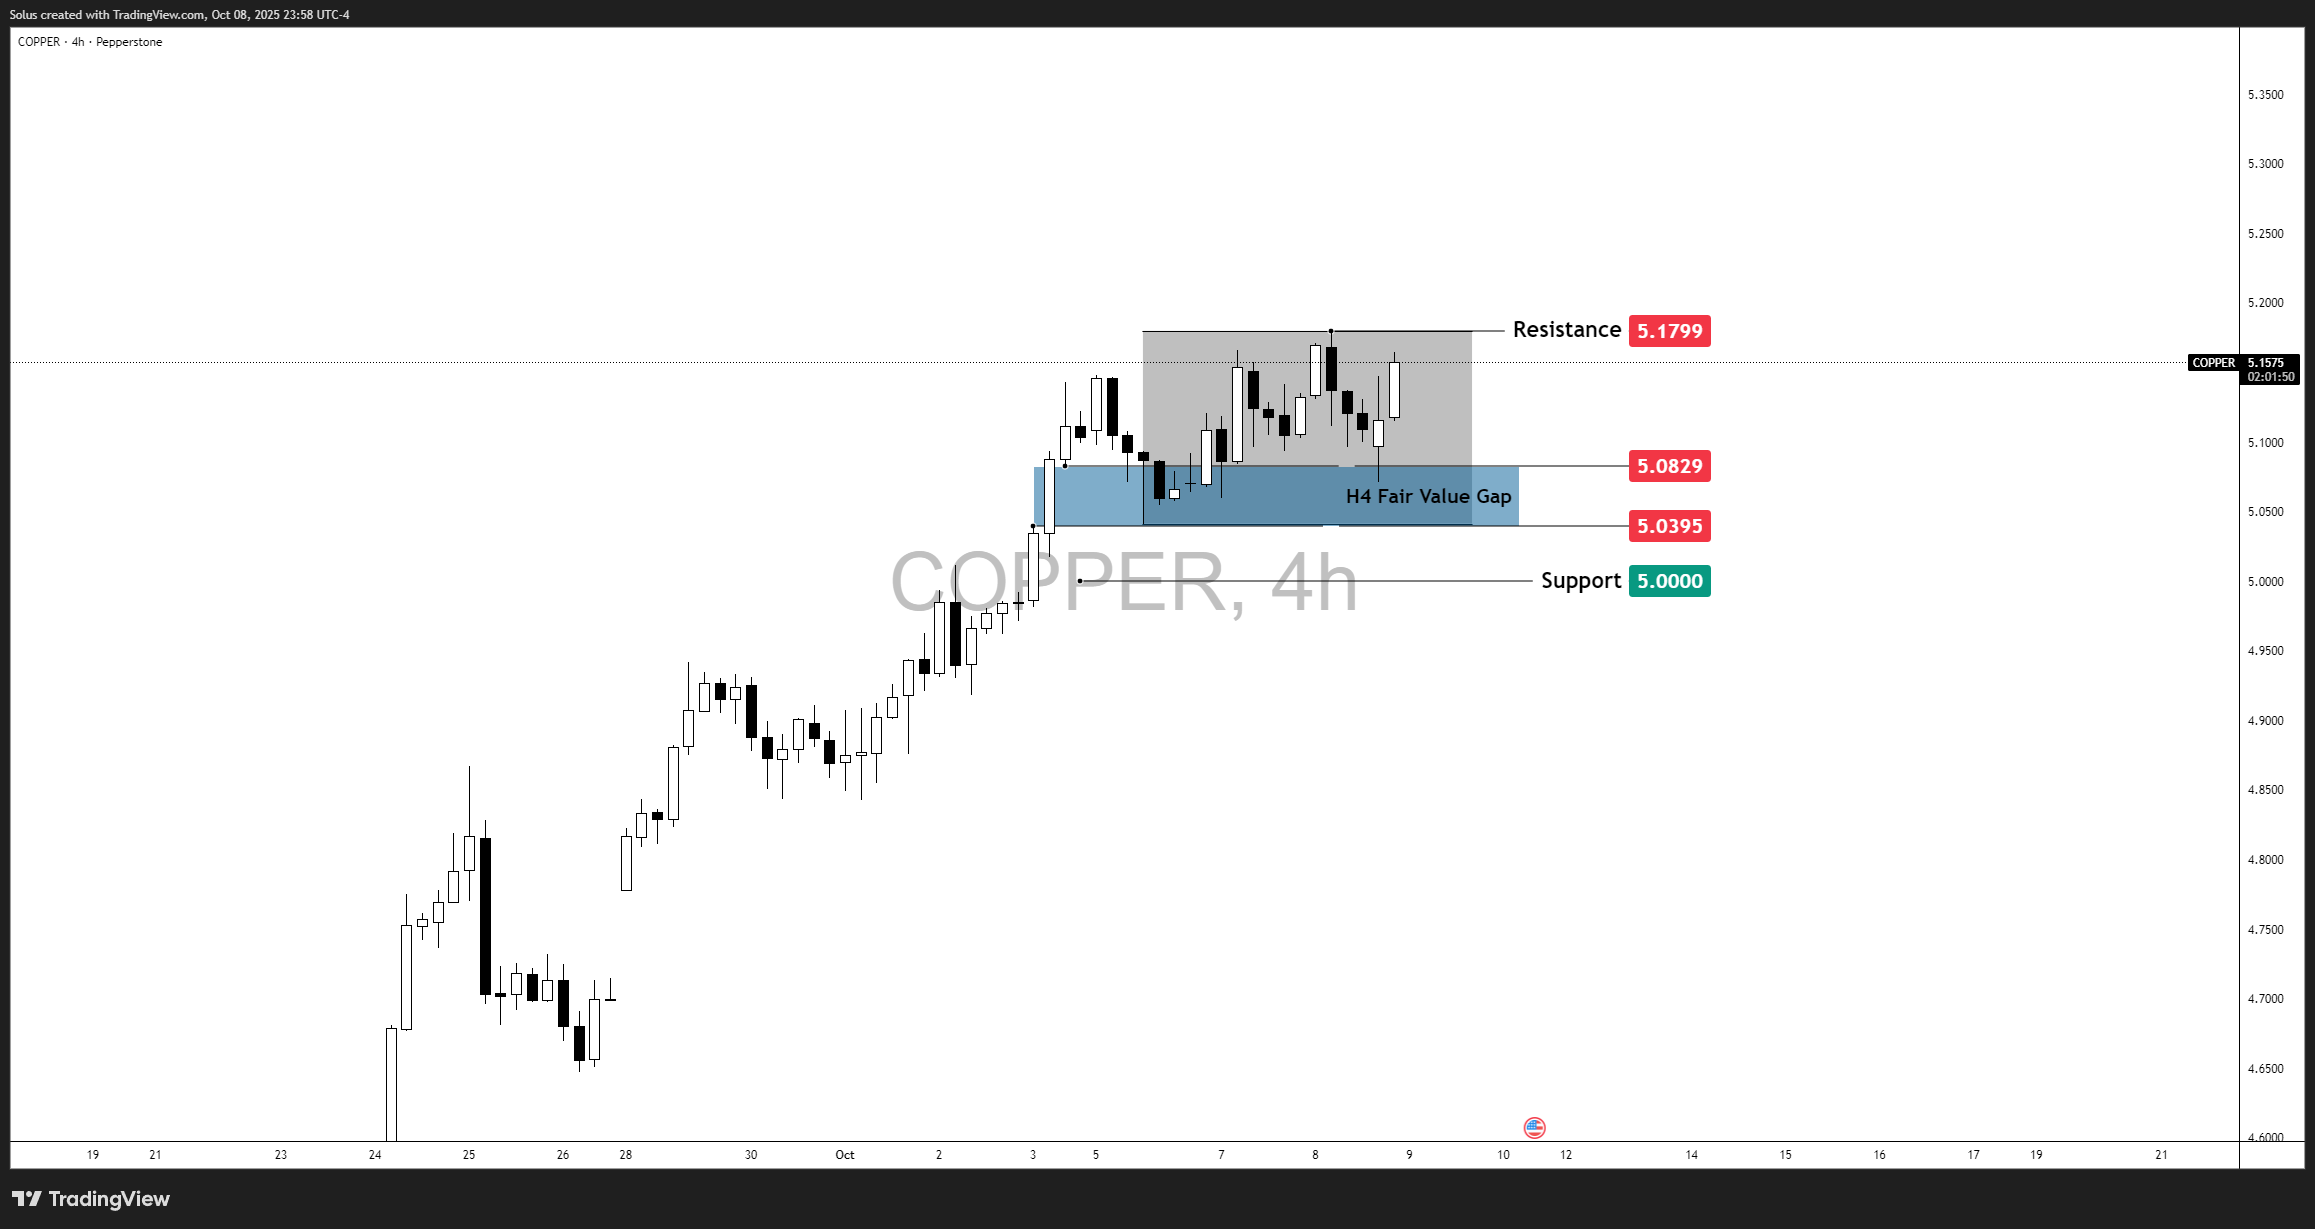
Copper’s 4-hour structure now paints a classic accumulation range within an ongoing uptrend, with price oscillating between a defined resistance at $5.1799 and a support shelf at $5.0000.
This range is anchored by an active H4 Fair Value Gap (FVG) between $5.0395–$5.0829, which has repeatedly acted as a reaccumulation zone throughout October.
The sequence of higher highs and higher lows since late September remains intact. Price continues to respect the FVG as an internal liquidity pocket, suggesting that institutional order flow is defending this zone. Until this FVG is violated, the overall market tone remains constructively bullish.
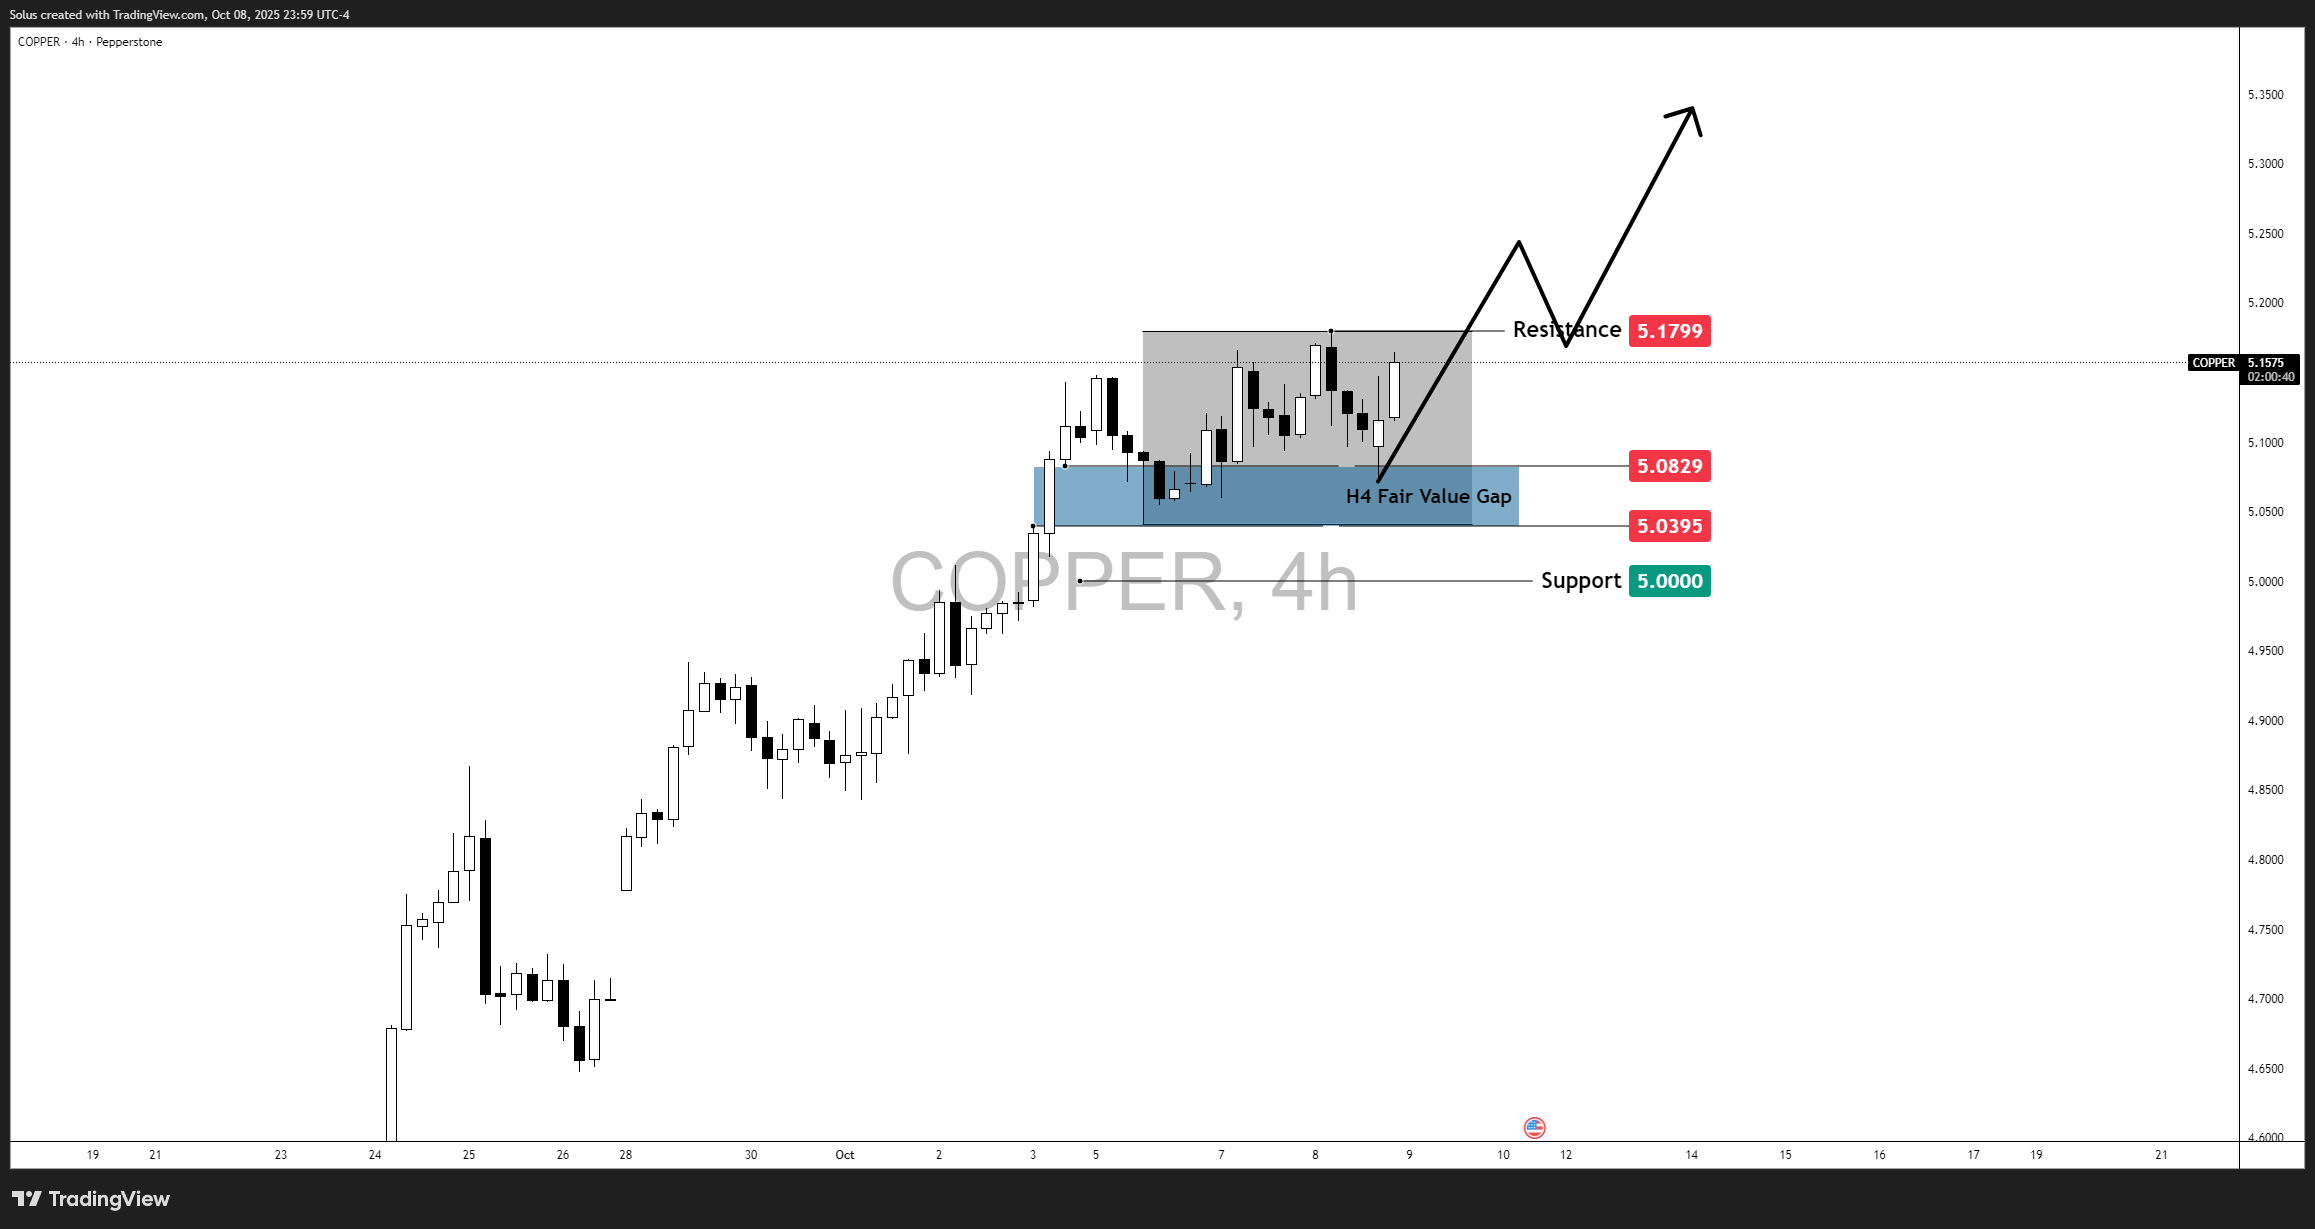
Bulls will look for price to retest and hold above the H4 FVG ($5.0395–$5.0829), confirming fresh absorption of liquidity.
Key Bullish Triggers:
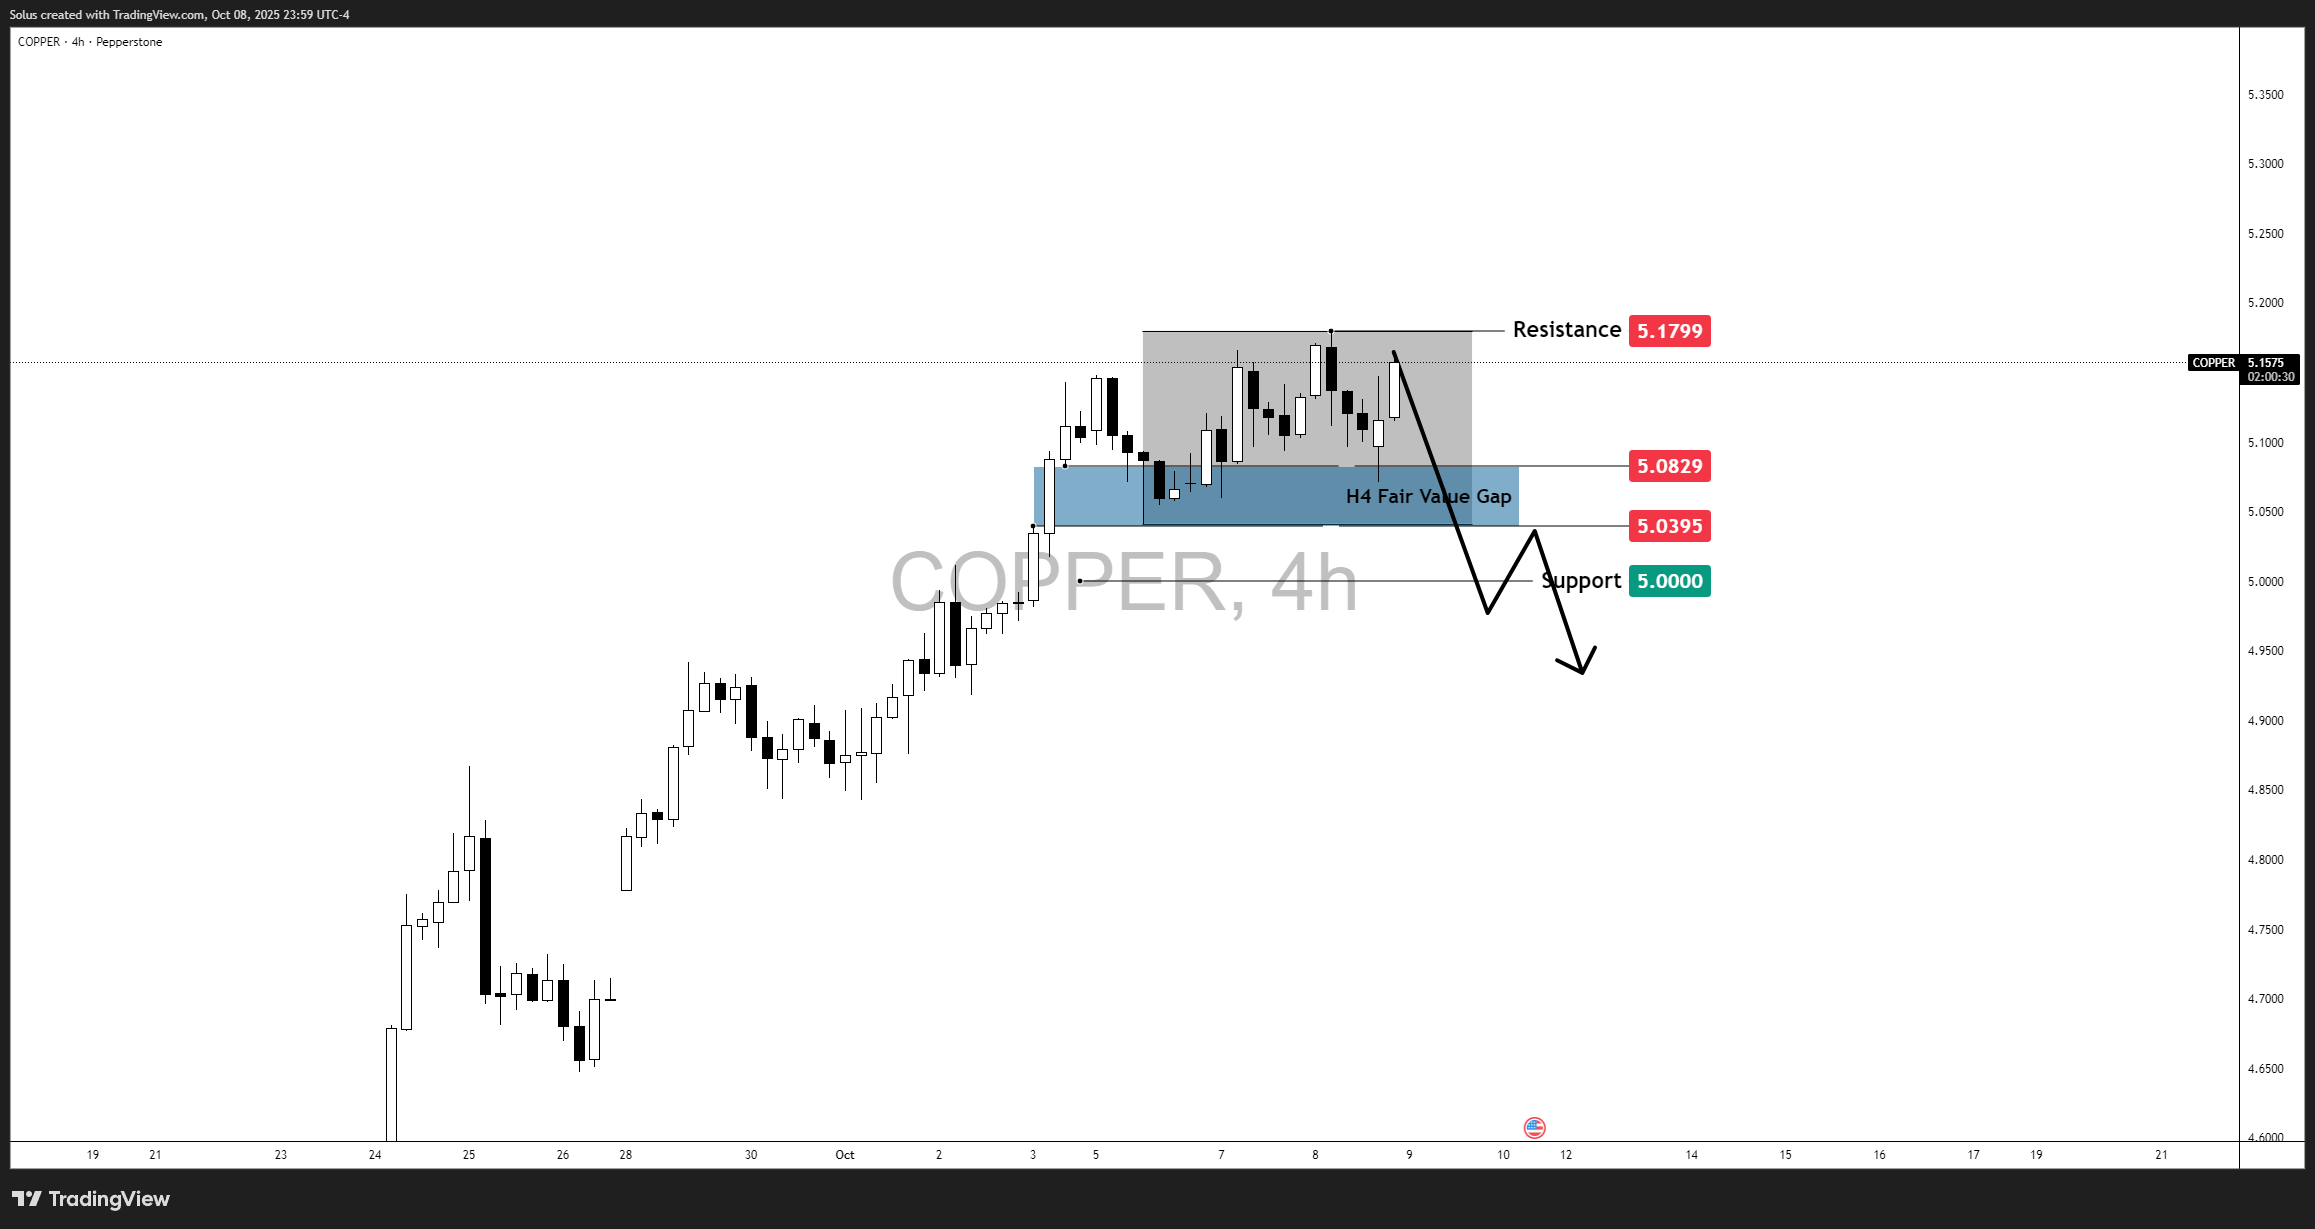
A decisive break below $5.0000 would invalidate the current accumulation pattern and signal a short-term correction.
Bearish Triggers:
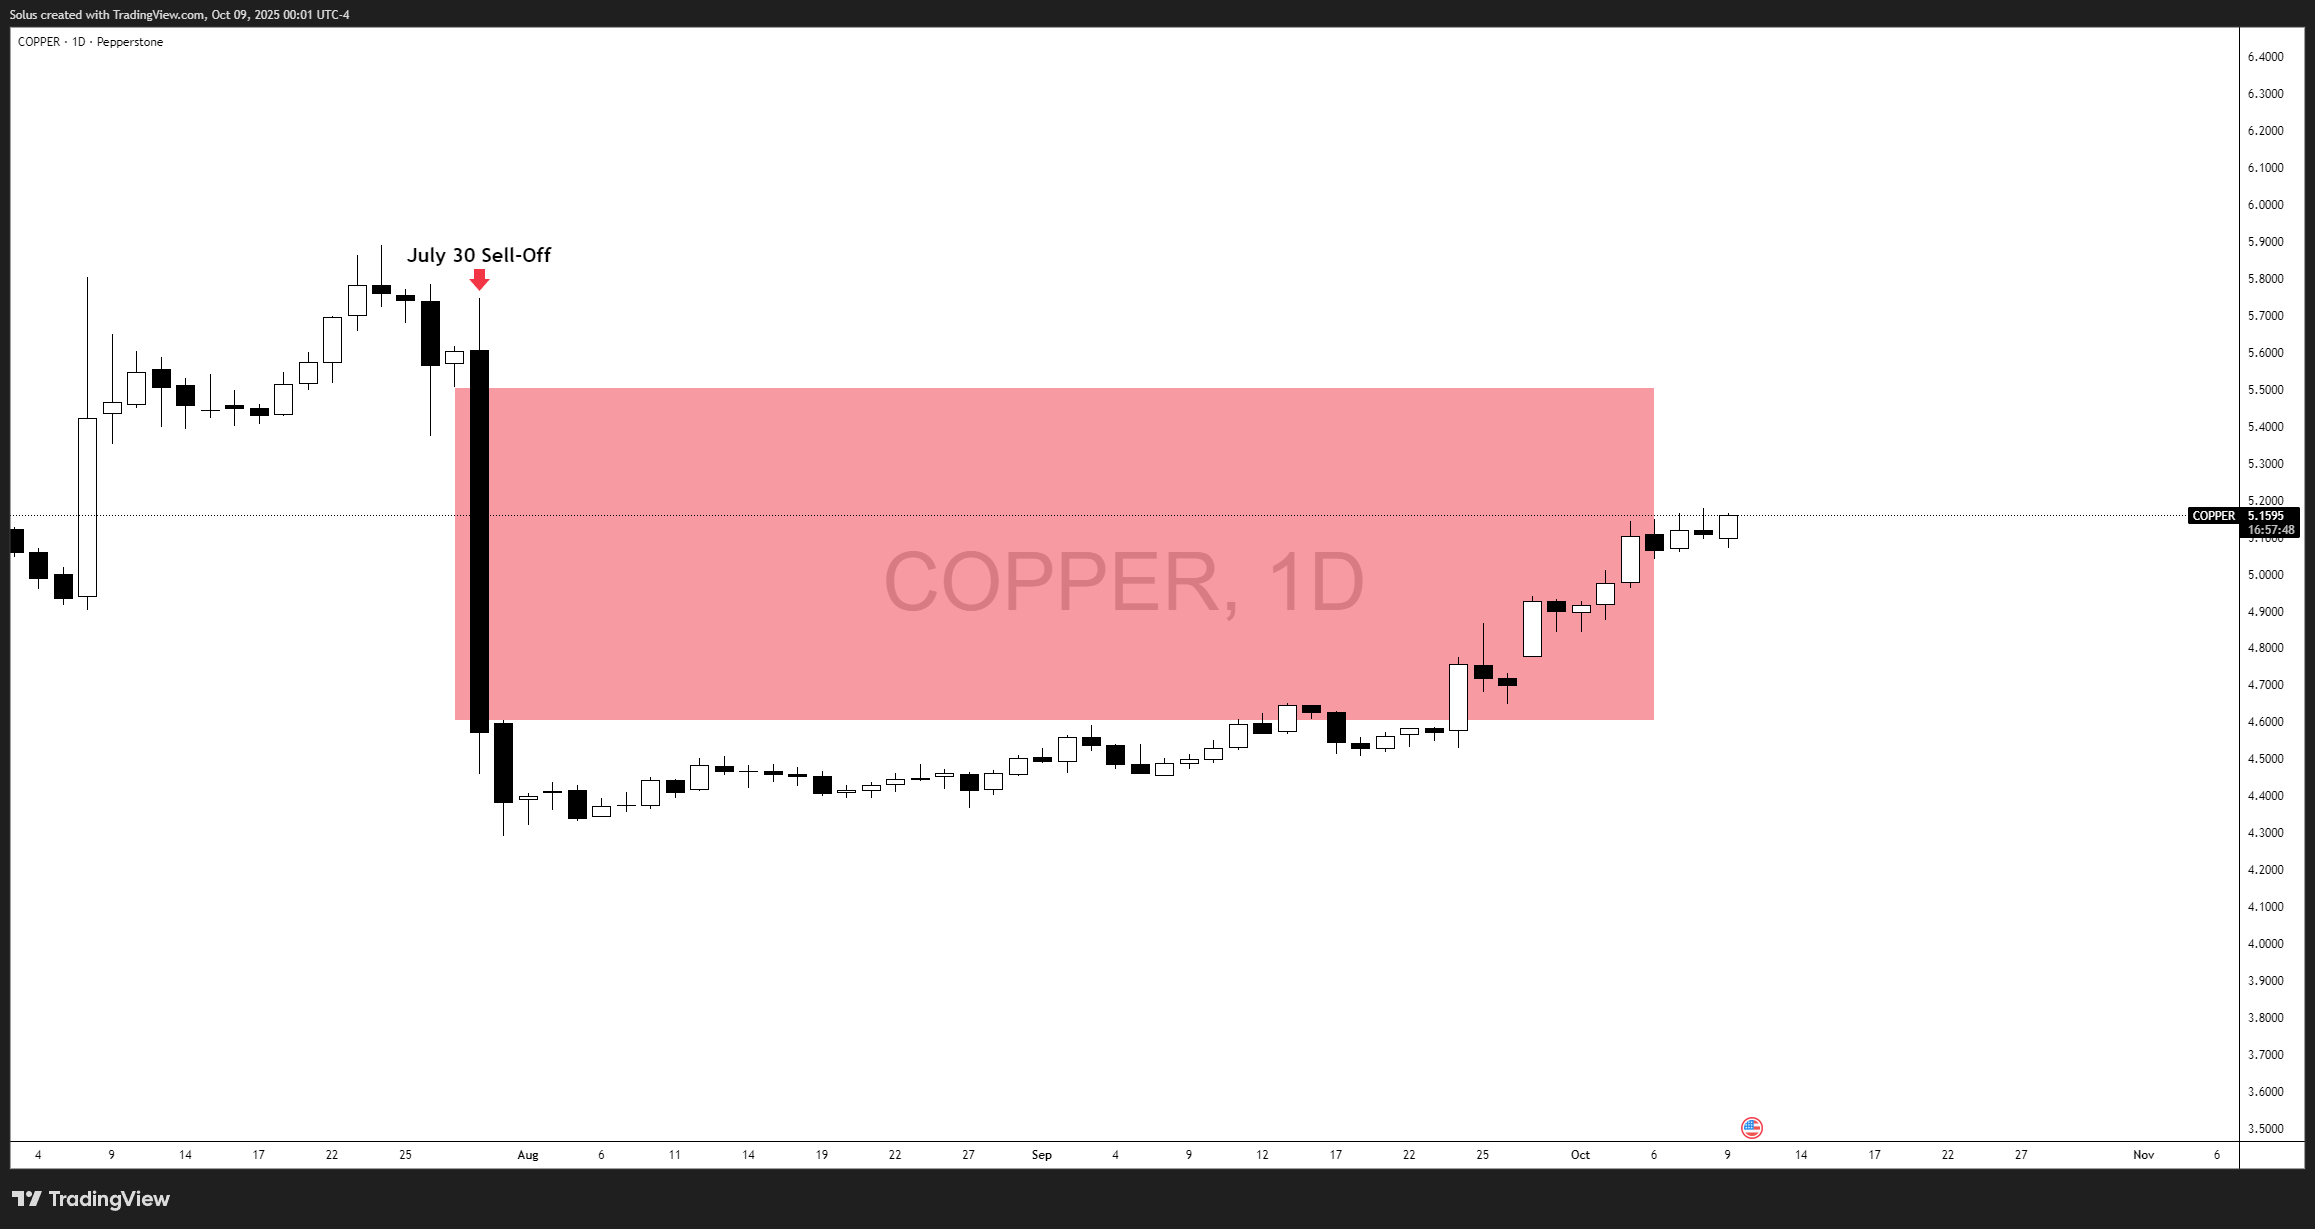
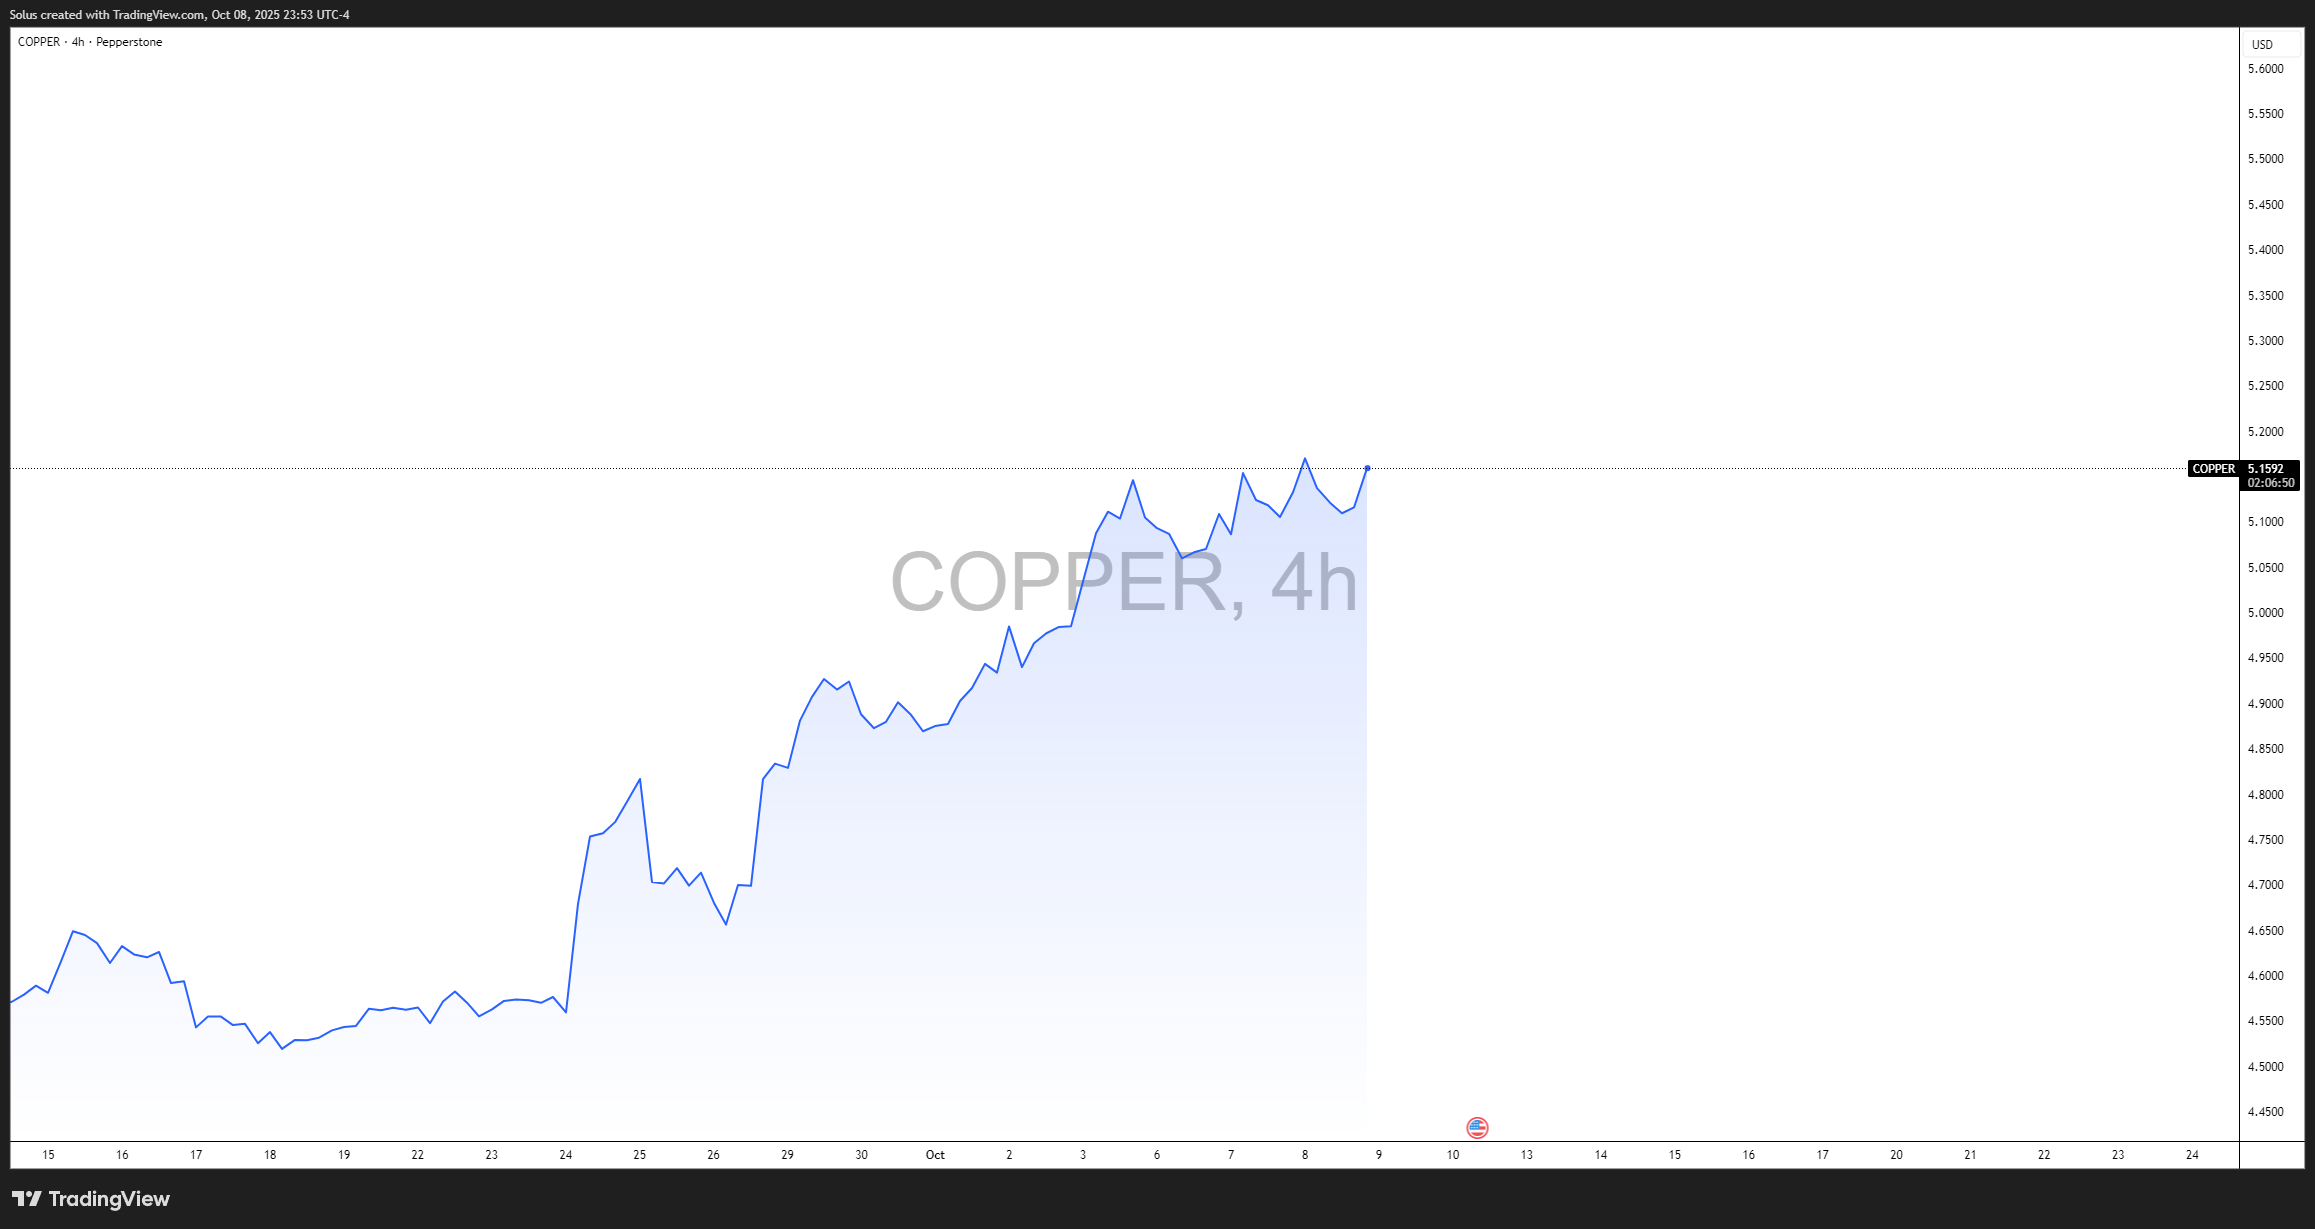
Big picture - copper is standing strong.
After months of accumulation, the market is now reclaiming the entire July 30 sell-off range, a region that previously capped bullish attempts during Q3.
The reclaim signifies structural repair and renewed institutional participation in the metal.
This behavior aligns perfectly with the ongoing 2026 deficit narrative and the global electrification cycle.
While short-term volatility may persist around $5.00–$5.18, the overall trend remains constructive and underpinned by real-world demand.
Unless the macro backdrop deteriorates sharply, copper’s story is not one of exhaustion - it’s one of resilience and revival.
It’s time to go from theory to execution - risk-free.
Create an Account. Start Your Free Demo!
Looking for step-by-step approaches you can plug straight into the charts? Start here:
Sharpen your edge with proven tools and frameworks:
News moves markets fast. Learn how to keep pace with SMC-based playbooks:
From NASDAQ opens to DAX trends, here’s how to approach indices like a pro:
Gold remains one of the most traded assets - - here’s how to approach it with confidence:
Candlesticks are the building blocks of price action. Master the most powerful ones:
Ready to go intraday? Here’s how to build consistency step by step:
Markets swing between calm and chaos. Learn to read risk-on vs risk-off like a pro:
Step inside the playbook of institutional traders with SMC concepts explained:
Forex pairs aren’t created equal - - some are stable, some are volatile, others tied to commodities or sessions.
If you’ve ever been stopped out right before the market reverses - - this is why:
Mindset is the deciding factor between growth and blowups. Explore these essentials:
The real edge in trading isn’t strategy - it’s how you protect your capital:
If you’re not sure where to start, follow this roadmap:
This way, you’ll grow from foundation → application → mastery, instead of jumping around randomly.
Follow me for more daily market insights!
Jasper Osita - LinkedIn - FXStreet - YouTube
This content may have been written by a third party. ACY makes no representation or warranty and assumes no liability as to the accuracy or completeness of the information provided, nor any loss arising from any investment based on a recommendation, forecast or other information supplies by any third-party. This content is information only, and does not constitute financial, investment or other advice on which you can rely.
ACY Securities is one of Australia's fastest growing multi-asset online trading providers, offering ultra-low-cost trading, rock-solid execution, technologically superior account management and premium market analysis.
Select the categories and companies you wish to follow directly to your person rss feed.
Create Custom RSS Feed
just now
Sign up and join over 5,000 professional members who receive personalized news alerts, curated professional connections, and more for free!
Sterling steadies after political uncertainty rattled gilt markets, while EUR/USD and EUR/GBP approach key technical levels ahead of today's European session.
GBP/AUD remains trapped in a well-defined bearish trend on both the weekly and daily timeframes.
Discover the key drivers, technical levels, and central bank expectations shaping the EUR/USD trend as the ECB prepares to hold rates and markets watch for a potential breakout.
Sydney-based multi-asset broker ACY Securities has introduced PAXGUSD, a new CFD instrument that allows clients to trade tokenised gold against the US Dollar 24 hours a day, seven days a week. The instrument is available across MetaTrader 4, MetaTrader 5, and the ACY Trading Platform.
Binance has lowered its VIP 3 Wallet Assets threshold from $3 million to $1 million and will now count OTC Spot Trading Volume at a 4x multiplier toward VIP qualification, removing the previous VIP 4 cap and allowing eligible users to progress through the full tier framework up to VIP 9.
Retail futures trading leader NinjaTrader Group has appointed Mark Omens as Senior Vice President, Commercial Strategy, bringing a 25-year veteran of derivatives marketplace CME Group into a newly created role focused on exchange partnerships and enterprise growth.
Gold Price Action Forecast: Will XAU/USD Drop to $3930? Meta Description: Read our Gold price action forecast to see if XAU/USD will drop to $3930.
BitDelta Securities Financial Services LLC (“BitDelta Securities”) today announced that it has received full regulatory approval from the Capital Market Authority (“CMA”) of the United Arab Emirates under the Category 5 — Arrangement and Advice license framework (License No. 20200000439). The approval follows the firm's receipt of In-Principal Approval earlier this year and represents the successful conclusion of the CMA's full licensing process, including the satisfaction of capital requirements, governance appointments, and operational setup.
Crypto.com has received a $400 million strategic investment from Citadel Securities, valuing the firm at $20 billion. It marks the first institutional funding round in the company's history, aimed at accelerating its expansion into tokenised securities, derivatives and other asset classes.
WTI’s pullback into $79–82 is the first major test of the bullish Elliott Wave count, with buyers targeting a renewed break above $85.