just now


Liquidity Finder Ltd is incorporated in England and Wales, company number 10610740, registered address 167-169 Great Portland Street, Fifth Floor, London W1W 5PF, United Kingdom.
Published: just now
The EUR/USD is the pairing of the Euro (EUR) and the US Dollar (USD). Traders in the community affectionately call it the “Fiber” in 1999 due to modern fiber-optic cables or undersea communications cables linking Europe and the US are made of fiber optics.
The Euro is the base currency and this is the actual currency you are buying or selling.
The US Dollar is the quote currency and this tells you how much it costs in dollars.
Example: If the price is trading at $1.1000, it means it costs $1.10 USD to buy €1 EUR.
The World's Most Traded Pair as it makes up nearly a quarter of all daily foreign exchange volume. Because so many people trade it, brokers offer the lowest transaction fees (tightest spreads).
Massive Global News Coverage- Because it represents the two largest western economies (the Eurozone and the US), financial news and analysis are everywhere.
Central Bank Interest Rates with the monetary policies of the Federal Reserve (in the US) and the European Central Bank (in Europe) are the biggest price movers or market movers. If the US raises their interest rates, then the US Dollar usually gets stronger or boosted, causing the EUR/USD price to drop.
Economic Reports: Traders closely watch regular reports like job market data (Non-Farm Payrolls), Inflation reports Consumer Price Index (CPI), and overall economic growth Gross Domestic Product (GDP).
When is the Best Time to Trade?
The London-New York Overlap since the Forex (FX) market is open 24 hours a day, trading activity peaks when both the London and New York stock exchanges are open at the same time (roughly 12:00 PM to 4:00 PM UTC). This window offers the best price movements for active traders.
Core Strategies for Beginners
Trend Following: Spotting whether the pair is moving generally upward or downward, and trading in that same direction.
Range Trading: Buying when the price hits a known technical floor (support) and selling when it hits a ceiling (resistance) during calm markets.
News Trading: Placing trades around major economic announcements to catch fast, short-term price movements.
Essential Risk Management Rules
Watch the Leverage: Brokers offer high leverage, which can supercharge both your wins and your losses. Beginners should keep leverage low.
Use Stop-Loss Orders: Always set automated safety orders to close a trade if the market moves too far against you, protecting your account from heavy losses.
When looking at the EUR/USD from a big-picture macroeconomic perspective, you have to watch more than just the US and Europe. Global banks and international trade rely heavily on offshore US dollars a massive network often called the Eurodollar system.
If there is a sudden shortage of dollars anywhere in the world, it causes a dollar squeeze that violently shakes up the EUR/USD exchange rate.
The Core Economies (Direct Domestic Data)
These are the primary regions directly tied to the two currencies:
United States: Track the Federal Reserve, interest rates, inflation, and employment reports to understand the supply and strength of the US dollar.
Eurozone Core countries Germany, France, Italy as tracking the European Central Bank and regional inflation. Germany acts as the economic engine of Europe, so its industrial health heavily influences the Euro.
Global Financial Hubs (The Global Dollar Plumbing)
Massive pools of US dollars are stored, borrowed, and lent outside of the US through international banking hubs:
United Kingdom (London) as the historic capital of global foreign exchange and offshore dollar trading. Stress in UK banks quickly spreads to global dollar supplies.
Asian Financial Centers in Japan, Singapore, Hong Kong as home to huge pools of dollar assets. Japan is especially important because traders often borrow low-yielding Yen to buy higher-yielding dollar assets, which impacts global cash flows.
Offshore Tax Havens like Cayman Islands, Bahamas as major global banks technically house a huge percentage of short-term offshore dollar deposits through these locations.
Emerging Markets and Global Trade
Developing economies are heavy consumers of global credit. When global dollar supplies tighten, developing countries feel the pressure first, causing investors to panic-buy US dollars for safety:
China: As the world's largest exporter and a massive consumer of raw materials, China's economic health and currency value heavily influence global risk appetite.
Commodity Exporters (Saudi Arabia, Brazil, Australia): Global commodities are priced in US dollars. Crises in resource-rich nations ripple straight back into global dollar demand and shake up the EUR/USD.
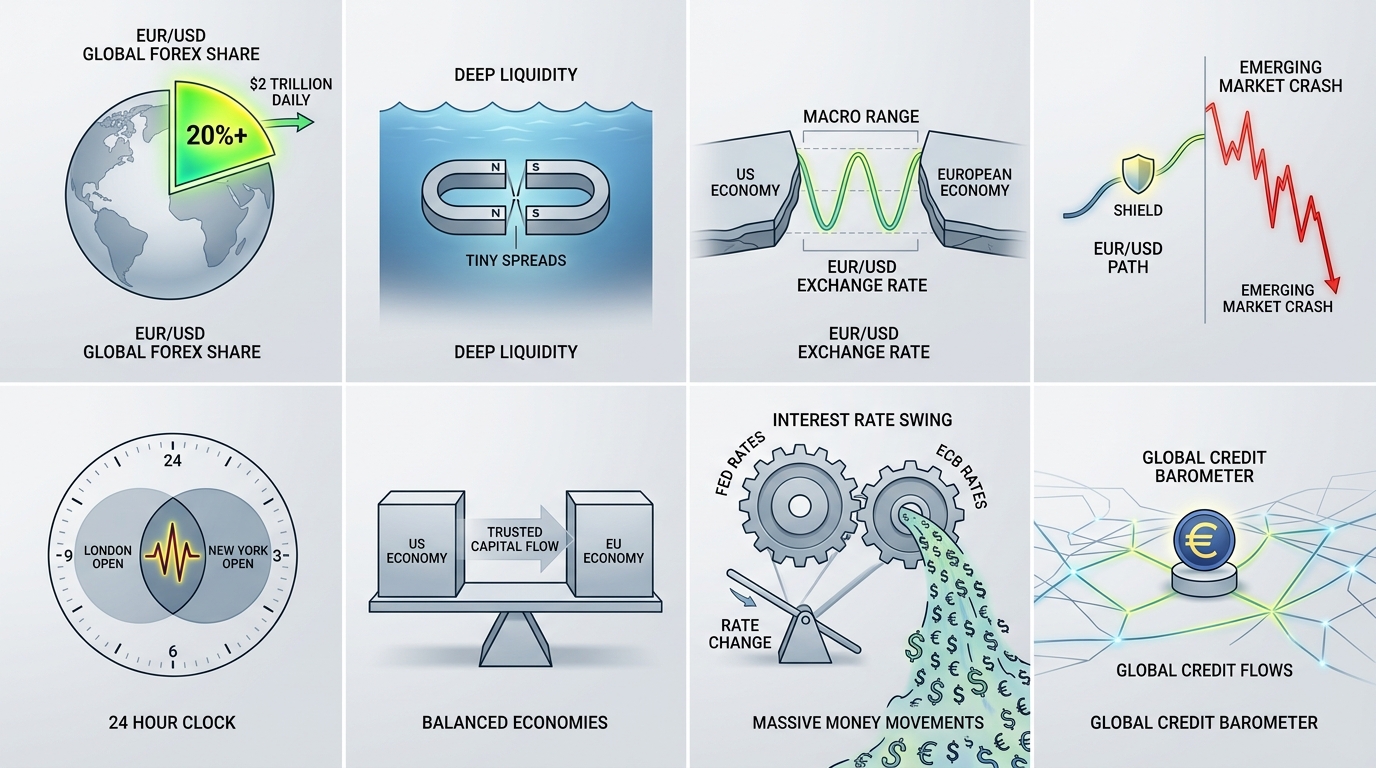
The EUR/USD captures over 20% of the entire global foreign exchange market, translating to roughly $2 trillion in daily turnover. Its dominance comes down to a few unique structural features:
Market Structure and Behavior
Deep Liquidity and Tiny Spreads- Because trading volume is so massive, orders execute smoothly and bid-ask spreads are virtually non-existent under normal market conditions.
Range-Bound Tendencies- Unlike other currencies that can trend wildly for years, the EUR/USD tends to bounce back and forth within predictable macro ranges over the medium term, because the US and European economies share a similar level of development.
Lower Risk of Extreme Surprises- While financial markets are always unpredictable, extreme black swan crashes are statistically rarer in the EUR/USD than in emerging market currencies, making risk easier to manage.
Predictable Daily Activity- Price volatility spikes predictably every day during the London-New York overlap, creating reliable pockets of high activity for active traders.
Why Major Investors Prefer This Pair
Core EUR/USD Mechanics & Contract Sizing (The How-To)
To trade the EUR/USD successfully, beginners must master the foundational math and contract mechanics that govern every position.
Pips and Pipettes Explained
What is a Pip? It is a percentage in point and is the standard unit of measurement for currency movements and usually representing the 4th decimal place (0.0001) in currency pairs like the EUR/USD. If the EUR/USD moves from $1.1000 to $1.1050, it has moved 50 pips.
What is a Pipette? It is a fractional pip representing the 5th decimal place (0.00001), allowing for more precise pricing and tighter spreads.
Forex Lot Sizes: Micro, Mini, and Standard
Forex is traded in standardized batches called lots. Understanding lot sizes is critical and important for managing capital exposure:
Standard Lot is Equal to 100,000 units of the base currency. A 1-pip movement equals roughly $10.
Mini Lot is Equal to 10,000 units of the base currency. A 1-pip movement equals roughly $1.
Micro Lot is Equal to 1,000 units of the base currency. A 1-pip movement equals roughly $0.10 (crucial for beginners with small accounts to manage risk effectively).
Bid or Ask Spread and the Cost of Entry
While the EUR/USD is renowned for its tight spreads, beginners must remember that brokers charge this cost upfront. When you open a market buy order, you immediately enter the trade slightly in the negative by the exact width of the spread, which the price must overcome before the trade becomes profitable.
Practical Risk-to-Reward & Position Sizing Math
In professional trading depends heavily on math rather than guesswork. Protecting your capital requires strict adherence to risk formulas.
The Position Sizing Formula
Telling beginners to use stop-losses is incomplete without showing how to calculate position size. To risk a safe percentage of your account (typically 1% to 2% per trade), use the following approach:
Determine your total account balance.
Essential Technical Execution Tools
Moving from theoretical trends to live execution will require you to start familiarizing yourself with chart indicators and order types.
The Key Technical Indicators for the pair of EUR/USD
Understanding the Order Types
Market Orders, with instructions to buy or sell instantly at the current best available market price.
Pending Orders with automated orders such as Buy Limits, Sell Limits, Buy Stops, and Sell Stops used to enter the market at predetermined price levels without needing to stare at charts all day.
Psychological & Practical Trading Pitfalls to Avoid
Even a technically sound strategy can fail if you fall victim to hidden costs and behavioral traps.
Trading Costs and Swap Rates (Rollover)
Holding a EUR/USD position at past 5:00 PM EST incurs swap rates (rollover interest). Because you are essentially borrowing one currency to buy another, you will either pay or earn interest based on the interest rate differential set by the European Central Bank (ECB) and the Federal Reserve (Federal Reserve).
Avoiding Overtrading and Session Traps
Mostly beginners usually drain their trading accounts by overtrading during low-volatility dead zones (such as late Asian trading hours). During these quiet windows, tight spreads cannot compensate for the lack of meaningful price movements
Disclaimer: This content may have been written by a third party. ACY makes no representation or warranty and assumes no liability as to the accuracy or completeness of the information provided, nor any loss arising from any investment based on a recommendation, forecast or other information supplies by any third-party. This content is information only, and does not constitute financial, investment or other advice on which you can rely.
ACY Securities is one of Australia's fastest growing multi-asset online trading providers, offering ultra-low-cost trading, rock-solid execution, technologically superior account management and premium market analysis.

Select the categories and companies you wish to follow directly to your person rss feed.
Create Custom RSS FeedSign up and join over 5,000 professional members who receive personalized news alerts, curated professional connections, and more for free!
CMC Markets has retired the CMC Connect name and will now present its institutional business as CMC Markets Institutional.
The SEC has approved Cboe's binary options tied to key performance indicators reported by 23 companies, covering more than 100 metrics such as iPhone revenue. The cash-settled contracts pay a fixed $1, Robinhood plans to be the first retail broker to offer them, and trading awaits clearing registration.
Gold is trading around $4,150, recovering sharply after falling to a recent low of $4,073.
Global semiconductor and technology stocks sold off sharply on Thursday, with South Korea’s SK Hynix plunging over 10% and Samsung Electronics falling more than 8%.
Learn gold market structure to identify bullish, bearish and ranging XAUUSD trends using higher highs, higher lows, lower highs and lower lows, support and resistance.
Axi has launched an MCP integration connecting eligible MT5 accounts to Claude, allowing clients to access live market data, track positions, execute trades and update risk parameters through the AI assistant developed by Anthropic. Available to eligible Axi clients with an active MT5 account. Setup runs via Claude.ai.
Movantis has selected Integral to extend its FX liquidity offering for institutional clients including banks, payment networks and digital asset operators, adding an institutional trading platform, direct-to-client API trading and API connectivity into a third-party multi-dealer venue, supporting regional expansion.
Running a venue around the clock is the easy part. Pricing risk when the market underneath it is shut is not. Lars Holst, CEO of GCEX explains how to manage risk in 24/7 markets.
ATFX has released its Q4 2026 Trader Magazine, offering a closer look at the macroeconomic and market forces that could shape trading conditions in the final quarter of the year.
LSEG has announced a collaboration with NVIDIA that lets financial institutions analyse years of LSEG Tick History data in seconds using NVIDIA cuDF on GPUs, without creating another full copy of the dataset. Tick History holds 110 trillion rows across 100 million instruments and more than 580 venues and contributors.