just now


Liquidity Finder Ltd is incorporated in England and Wales, company number 10610740, registered address 167-169 Great Portland Street, Fifth Floor, London W1W 5PF, United Kingdom.
Published: just now
To equip you with the practical tools to use Fibonacci retracement and extension levels for precise stop-loss and take-profit placement, while clearly understanding their differences, use cases, and how to avoid common mistakes.
Imagine a basketball hits the floor:


Both serve different purposes but are part of one coherent move. In trading, you use retracement to wait for the pullback and extension to project how far price could go next.
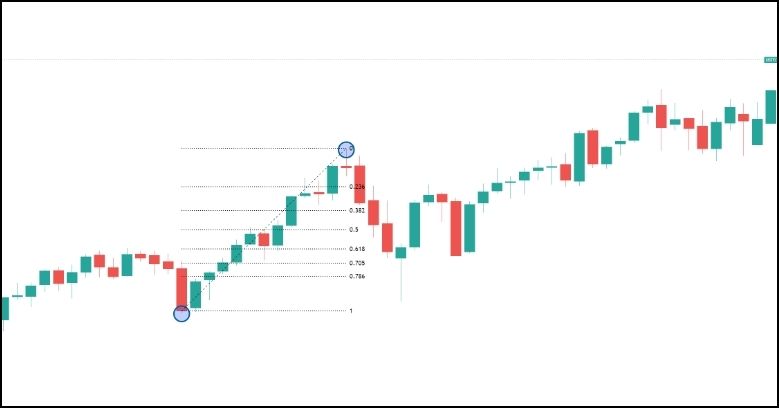
The Fibonacci retracement tool is used to measure the pullback of a price move. It helps traders anticipate where price might reverse or react before continuing in the original direction.
| Fibonacci Level | What It Suggests |
|---|---|
| 0.236 | Shallow pullback in a very strong trend |
| 0.382 | Common correction zone in healthy trends |
| 0.500 | Midpoint level; not a true Fibonacci ratio |
| 0.618 | Golden Ratio; high-probability reversal zone |
| 0.705 | Hidden "sniper zone"; used for precision entries |
| 0.786 | Deep retracement; last chance before invalidation |
| Retracement Level | SL Logic |
|---|---|
| Below 0.618 | Ideal SL if entering at 0.382/0.5 |
| Below Swing Low (or High) | Smart Money SL to avoid retail wicks |
| Below FVG or Order Block | SMC confirmation-based SL |
Golden Rule: Never place your stop directly on a Fib level — always leave a buffer of 5–10 pips ( what I recommend: structure-based after a breakout) to reduce stop-outs from manipulative spikes.
For types of stop-loss, read: Mastering Risk Management: Stop Loss, Take Profit, and Position Sizing
Check this out for breakout trading: How to Trade Breakouts Effectively in Day Trading with Smart Money Concepts
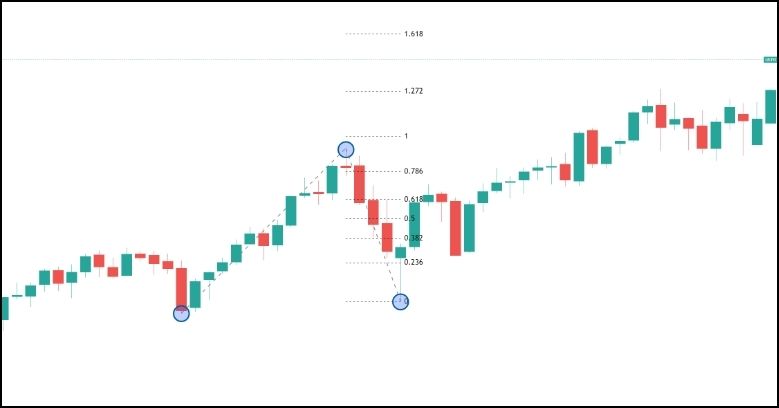
The Fibonacci extension tool goes one step further. It projects future price targets beyond the original impulse move, and is used primarily for setting take-profits after price resumes in the trend direction.
| Extension Level | Meaning | When to Use |
|---|---|---|
| 1.0 | Equal to the original impulse | Conservative TP1 |
| 1.272 | Shallow extension | TP1 or TP2 (choppy markets) |
| 1.618 | Golden extension level | TP2 or TP3 (strong trends) |
| 2.0 | Full expansion move | Final TP in parabolic moves |
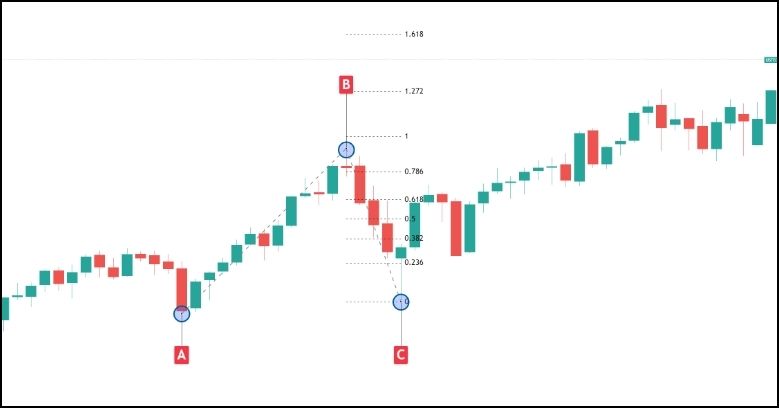
The tool then projects levels like 1.0, 1.272, 1.618, 2.0, and beyond.
| Criteria | Fibonacci Retracement | Fibonacci Extension |
|---|---|---|
| Purpose | Identify pullback zones | Project take-profit zones |
| Plotted From | Two points (swing low to high) | Three points (low → high → retracement) |
| Used For | Entry + stop-loss | Target projection |
| Key Levels | 0.382, 0.5, 0.618 | 1.0, 1.272, 1.618, 2.0 |
| Common Timing | Before entering the trade | After entering the trade |

– You must wait for a proper pullback (Point C) before drawing the extension.
– Only use when a clear trend or impulse leg is present. Avoid using it in consolidation or choppy markets.
– Fibonacci levels are probability zones, not guarantees. Use confirmation like structure breaks, AMD, MSS, or liquidity sweeps.
– Focus on the 1.0, 1.272, 1.618, and 2.0 levels for cleaner trading decisions.
– Even the best Fibonacci setup can fail in high-volatility or news-driven environments. Use calendar filters.
| Step | Tool | Task |
|---|---|---|
| 1 | Retracement | Mark your entry zones (0.5, 0.618) and structure |
| 2 | Retracement | Set SL below 0.618 or swing low with buffer |
| 3 | Extension | Draw 3-point extension for TP1–TP3 levels |
| 4 | Confirm | Look for liquidity sweeps, MSS, or FVGs near these levels |

Now that you understand how to use Fibonacci retracements and extensions for both stop-loss and take-profit placements, it’s time to practice on real charts.
Open a free demo account today and experience institutional-grade spreads, lightning-fast execution, and all the tools you need to grow as a trader.
It’s time to go from theory to execution — risk-free.
Create an Account. Start Your Free Demo!
How To Trade & Scalp Indices at the Open Using Smart Money Concepts (SMC)
How to Trade Breakouts Effectively in Day Trading with Smart Money Concepts
Complete Step-by-Step Guide to Day Trading Gold (XAU/USD) with Smart Money Concepts (SMC)
The Power of Multi-Timeframe Analysis in Smart Money Concepts (SMC)
Forex Trading Strategy for Beginners
Mastering Candlestick Pattern Analysis with the SMC Strategy for Day Trading
Mastering Risk Management: Stop Loss, Take Profit, and Position Sizing
RSI Divergence Trading Strategy for Gold: How to Identify and Trade Trend Reversals
Stochastics Trading Secrets: How to Time Entries in Trending Markets using Stochastics
Gold Trading Stochastics Strategy: How to Trade Gold with 2R–3R Targets
RSI Hidden Divergence Explained: How to Spot Trend Continuations Like a Pro
Why Smart Money Concepts Work in News-Driven Markets - CPI, NFP, and More
How to Trade NFP Using Smart Money Concepts (SMC)-A Proven Strategy for Forex Traders
How to Trade CPI Like Smart Money - A Step-by-Step Guide Using SMC
How to Start Trading Indices and Get into the Stock Market with Low Capital (2025 Guide)
Best Indices to Trade for Day Traders | NASDAQ, S&P 500, DAX + Best Times to Trade Them
How To Trade & Scalp Indices at the Open Using Smart Money Concepts (SMC)
NAS100 - How to Trade the Nasdaq Like a Pro (Smart Money Edition)
How to Trade CPI Like Smart Money - A Step-by-Step Guide Using SMC
Why Smart Money Concepts Work in News-Driven Markets - CPI, NFP, and More
How to Swing Trade Gold (XAU/USD) Using Smart Money Concepts: A Simple Guide for Traders
Complete Step-by-Step Guide to Day Trading Gold (XAU/USD) with Smart Money Concepts (SMC)
The Ultimate Guide to Backtesting and Trading Gold (XAU/USD) Using Smart Money Concepts (SMC)
Why Gold Remains the Ultimate Security in a Shifting World
How to Trade Candlestick Patterns with High Probability: A Complete Guide for Beginners
The Top Japanese Candlestick Guide: What is an Engulfing Pattern and How to Trade It?
Piercing Pattern Candlestick Explained: How to Trade It - Step-By-Step Guide
Morning & Evening Star Candlestick Patterns – How to Trade Market Reversals with Confidence
5 Steps to Start Day Trading: A Strategic Guide for Beginners
8 Steps How to Start Forex Day Trading in 2025: A Beginner’s Step-by-Step Guide
3 Steps to Build a Trading Routine for Consistency and Discipline - Day Trading Edition
The Ultimate Guide to Understanding Market Trends and Price Action
How to Identify Risk-On and Risk-Off Market Sentiment: A Complete Trader’s Guide
How to Trade Risk-On and Risk-Off Sentiment - With Technical Confirmation
The Ultimate Guide to Understanding Market Trends and Price Action
Why Smart Money Concepts Work: The Truth Behind Liquidity and Price Action
Mastering the Market with Smart Money Concepts: 5 Strategic Approaches
Mastering Candlestick Pattern Analysis with the SMC Strategy for Day Trading
Understanding Liquidity Sweep: How Smart Money Trades Liquidity Zones in Forex, Gold, US Indices
The SMC Playbook Series Part 4: How to Confirm Trend Reversal & Direction using SMC
The SMC Playbook Series Part 5: The Power of Multi-Timeframe Analysis in Smart Money Concepts (SMC)
Fair Value Gaps Explained: How Smart Money Leaves Footprints in the Market
The Best Time to Use Smart Money Concepts (SMC): Why Timing Is Everything in Trading SMC
How to Trade the London Session Using Smart Money Concepts (SMC)
The Mental Game of Execution - Debunking the Common Trading Psychology
5 Steps to Backtest a Trading Strategy with AI: A Step-by-Step Guide
Managing Trading Losses: Why You Can Be Wrong and Still Win Big in Trading
The Hidden Threat in Trading: How Performance Anxiety Sabotages Your Edge
Why You Fail in Trading: You Don’t Have Enough Capital to Survive
Why 90% of Retail Traders Fail Even with Profitable Trading Strategies
The Top 10 Best Trading Books That Changed My Mindset, Strategy & Performance
Discovering Your Trader Profile: What Kind of Trader Are You?
Follow me for more daily market insights!
Jasper Osita - LinkedIn - FXStreet - YouTube
This content may have been written by a third party. ACY makes no representation or warranty and assumes no liability as to the accuracy or completeness of the information provided, nor any loss arising from any investment based on a recommendation, forecast or other information supplies by any third-party. This content is information only, and does not constitute financial, investment or other advice on which you can rely.
ACY Securities is one of Australia's fastest growing multi-asset online trading providers, offering ultra-low-cost trading, rock-solid execution, technologically superior account management and premium market analysis.

Select the categories and companies you wish to follow directly to your person rss feed.
Create Custom RSS FeedSign up and join over 5,000 professional members who receive personalized news alerts, curated professional connections, and more for free!
Theorem has integrated Symbiotic’s Liquid Lane RFQ network, letting holders of tokenised real-world assets trade against on-chain pool liquidity and market-maker quotes. The integration is live on Ethereum, with Midas’s yield-bearing mHYPER fund as the first supported asset. Holders can trade for the USDC stablecoin.
US equities were volatile with technology selloff erasing much of the earlier rebound.
FM Summit London 2026 returns to Old Billingsgate on 24 November for its 15th edition, with LMAX Group, Plus500 and oneZero among confirmed exhibitors. The one-day event adds Business Connect meetings and roundtables, and opens with a networking evening at The Folly on 23 November.
Finance Magnates Summit London returns to Old Billingsgate on 24 November 2026 for its 15th edition. The one-day event brings together brokers, liquidity providers, institutional firms, trading technology vendors, payments businesses and digital asset firms.
iSAM Securities Apex has integrated with Match-Prime, giving brokers access to liquidity across more than 2,000 instruments, with tailored pricing and up to 10 levels of market depth.
propfunding.com's free-entry instant funding changes the order of prop funding. Start trading first. Its free-entry instant funding model offers two qualification attempts without an upfront activation fee.
US stocks closed higher on Wednesday, with the Nasdaq gaining 1%, the S&P 500 rising 0.6%, and the Dow advancing 0.7%, as renewed enthusiasm for AI-related stocks lifted market sentiment.
SpaceX went public in June as a rocket company. On October 20 it reported as something else entirely: an AI infrastructure business, financed by a satellite broadband network, with a launch division attached. Rockets generated 12% of third quarter revenue and lost money. The AI segment generated 52% of revenue and consumed 84% of capital expenditure. Starlink generated 85% of operating profit.
Standard Chartered has signed definitive agreements to acquire 100% of Zodia Custody UK Limited, folding its regulated digital asset custody business into Securities Services. Zodia Solutions will be set up under SC Ventures with bank investors including Northern Trust, NAB Ventures, Emirates NBD and Investcorp.
Bybit Fintech FZE has secured a Virtual Asset Service Provider licence from Dubai’s Virtual Assets Regulatory Authority for Exchange Services, covering spot trading. Bybit’s Peter Loo said the firm hopes to add derivatives, subject to regulatory approvals. Its international Dubai headquarters opened in 2022.