just now


Liquidity Finder Ltd is incorporated in England and Wales, company number 10610740, registered address 167-169 Great Portland Street, Fifth Floor, London W1W 5PF, United Kingdom.
Published: just now
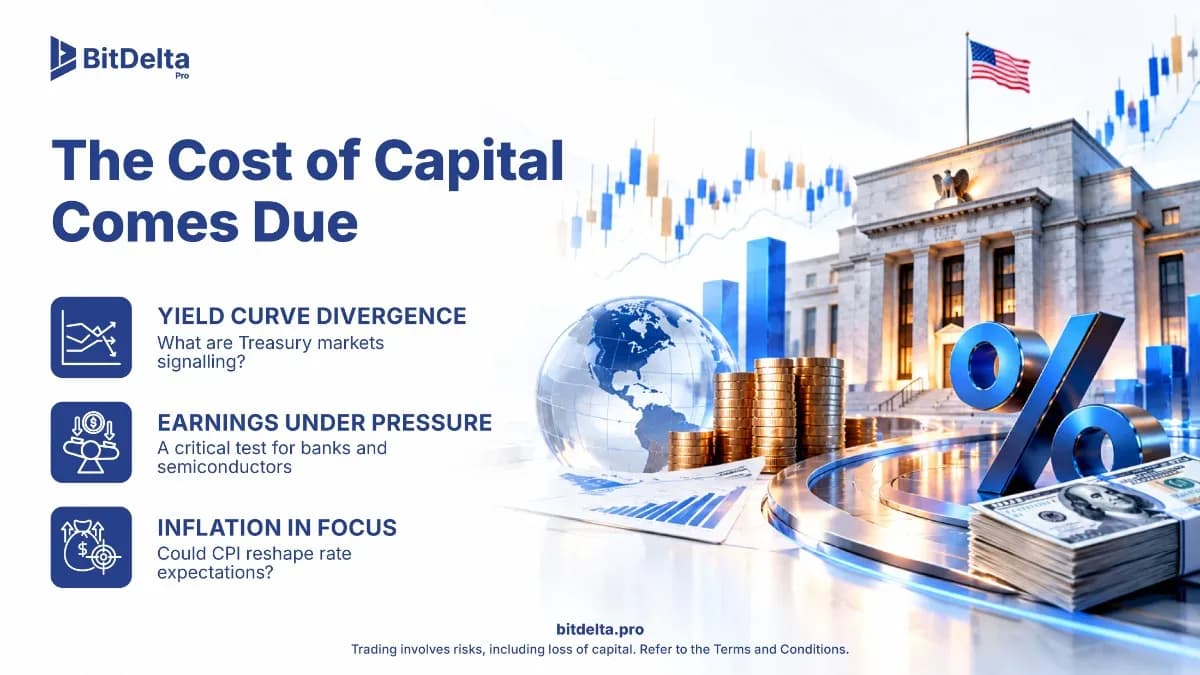
The yield curve is telling two stories at once. The short end is rising on inflation expectations ahead of this week's CPI release, with the 2-year Treasury at 4.791% and Fed Funds futures pricing a 19.4% probability of a 25 basis point hike at the October meeting. The long end is declining, with the 10-year at 5.240%, as institutions lock in duration with conviction. The 10-year auction printed a 2.8x bid-to-cover ratio and the 30-year came in at 2.5x. Institutions clearly trust the institution, even as parts of the market continue to trade as though de-dollarization is imminent. The divergence matters because the cost of capital environment is about to face its most consequential test of the quarter: a packed earnings calendar featuring the largest banks and the most important semiconductor companies, all reporting into a rates backdrop that pressures both sides of the income statement.
The September jobs report added further complexity. Nonfarm payrolls printed 29,000 against expectations of 90,000, with prior months revised down by a combined 60,000 jobs. Unemployment held at 4.2%, and average hourly earnings grew just 0.1% month over month, bringing the year-over-year pace to 3.0%. The labor market is not breaking, but it is clearly decelerating. For the Fed, this creates a tension between the hawkish posture laid out in the September FOMC minutes and a jobs picture that no longer supports aggressive tightening. For equities, the question is simpler: can earnings growth offset the cost of capital drag?
The Yield Curve Signal
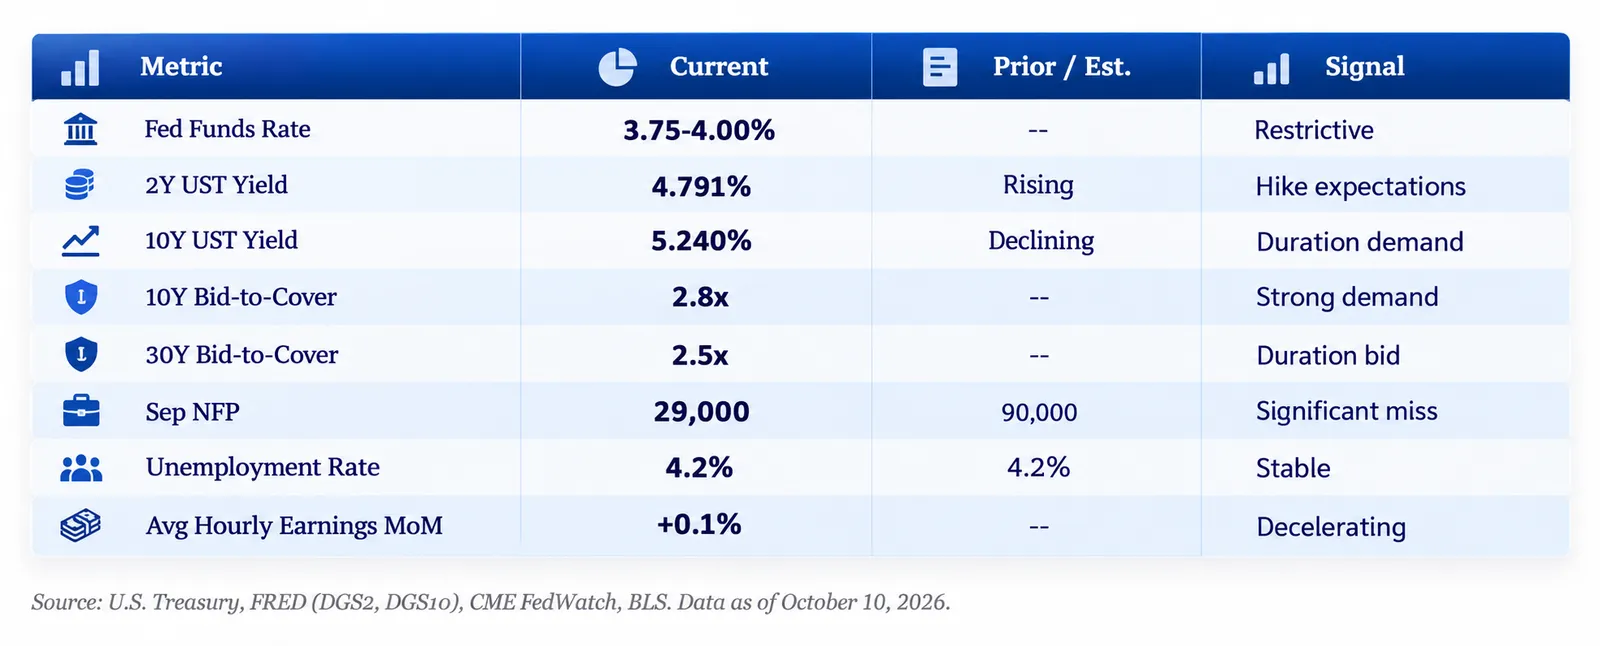
The table above captures the central tension in markets right now. The short end of the curve is rising because CPI is due in four days and there is still energy-led inflation on the horizon as long as the Red Sea conflict continues and oil prices remain elevated. The September FOMC minutes revealed a committee that has turned decidedly hawkish, with several participants noting that another hike would be "likely appropriate" by year-end. Fed Funds futures now price an 84% probability of a December hike, with UOB forecasting a pause in October followed by two more hikes, one in December 2026 and another in Q1 2027, targeting a terminal rate of 4.50%.
The long end tells a different story. Despite the hawkish rhetoric, institutions are buying duration aggressively. The 10-year auction's 2.8x bid-to-cover ratio is well above average, and the 30-year at 2.5x confirms the bid is not a one-off. This is not a market that fears a structural repricing of U.S. sovereign credit. It is a market that believes the hiking cycle is approaching its terminal rate and that locking in 5%+ yields on long-duration paper is the trade. As long as the 10-year remains above 5%, however, the cost of capital overhang persists. Every levered business, every acquisition, every refinancing is more expensive than it was six months ago.
Hawks Take the Mic
The September FOMC minutes were the most explicitly hawkish communication from the committee in over a year. Multiple participants characterized the current policy stance as "not sufficiently restrictive" given the persistence of services inflation and the strength of consumer spending on discretionary categories. The staff projection for core PCE was revised lower, acknowledging that their prior estimates had overshot, but the committee's response was not to ease. It was to signal that the revised lower path still warranted further tightening.
The shift in tone is notable. Powell may have been the secret dove all along. His press conferences consistently leaned toward data dependence and gradualism, while the minutes reveal a committee that is significantly more hawkish in private deliberation. The gap between the press conference tone and the minutes is the widest it has been since the hiking cycle began, and markets are slowly adjusting to the reality that the Fed's revealed preference is for tighter policy.
September Jobs: The Miss That Muddies Everything
The September nonfarm payrolls print of 29,000 against a consensus estimate of 90,000 was the largest miss in six months. Prior months were revised down by a combined 60,000, meaning the three-month average is now running well below the pace needed to absorb new labor force entrants. Average hourly earnings at +0.1% month over month suggest that wage pressures are cooling meaningfully, even as the unemployment rate held steady at 4.2%.
The report does not point to recession. The unemployment rate has held in the 4.1% to 4.2% range for an extended period despite persistent fears of cascading layoffs. What it does point to is a labor market in consolidation, neither strong enough to justify further tightening on employment grounds nor weak enough to force a pivot. The incoming reindustrialization theme, driven by onshoring mandates and infrastructure spending, could inject real momentum into manufacturing and industrials payrolls, but that is a 2027 story. For now, the labor market is a neutral input to the Fed's reaction function.
Equities and the Rates Drag
The S&P 500 closed the week at 7,812, up 1.21%. The Dow gained 1.09% and the Nasdaq rose 0.72%. The modest outperformance of the Dow over the Nasdaq reflects a subtle rotation: in a rising rates environment, duration-sensitive growth names underperform relative to shorter-duration value. This is not yet a full-blown rotation, but the signal is consistent with a market that is beginning to discount the cost of capital overhang into equity valuations.
Bitcoin traded near $114,000 for the week, continuing to consolidate above the six-figure level. The correlation between crypto and equity risk appetite remains elevated, and the asset continues to trade as a beta amplifier rather than a diversifier. A rates-driven selloff in equities this week would likely pull crypto lower in sympathy.
Bank Earnings: NIM Compression in Real Time
This week's bank earnings represent the first real-time stress test of the NIM compression thesis. JPMorgan, Goldman Sachs, Citigroup, Wells Fargo, Bank of America, and Morgan Stanley all report between Tuesday and Wednesday. The setup is straightforward: liabilities for these banks are becoming more expensive as deposit costs reprice higher, while the margin on assets is rising more slowly because loan books turn over on longer timelines. The result is net interest margin compression, which is more or less guaranteed in the coming quarters.
The impact is asymmetric across the sector. Regional banks face the sharpest pressure because they lack the diversified fee income streams that cushion the money center banks. KRE, the regional bank ETF, is already down roughly 13%, and the thesis we laid out months ago is playing out in real time. For the larger banks, the primary drag is on investment banking fees. The cost of financing acquisitions is materially higher, which compresses the deal pipeline and reduces advisory revenue. The same dynamic extends to the private equity complex. Apollo, KKR, TPG, and Carlyle have all seen meaningful drawdowns as the market prices in lower deal activity and reduced carry on existing portfolios.
The question for this week's prints is not whether NIM compression is happening. It is whether the magnitude is better or worse than what consensus has modeled, and whether the guidance commentary signals further deterioration or stabilization.
Semiconductors: Priced for Perfection
ASML and TSMC report this week into what may be the most challenging expectations environment in the semiconductor cycle. Both stocks are trading near all-time highs, and the market is pricing in continued hyper-growth driven by AI infrastructure spending. The problem is that the growth narrative collides with real-world constraints.
ASML's EUV lithography machines are among the highest-value capital goods ever manufactured, with single-unit prices exceeding $300 million. The supply chain is highly concentrated and undiversified, which creates both pricing power and delivery risk. At current valuations, the stock is priced for flawless execution on a multi-year backlog. Any softness in order intake or delivery guidance would reprice the stock aggressively, and the margin of safety at these levels is thin.
TSMC faces a different constraint. Revenue growth is now a function of fab capacity, and new fabs take years to bring online. The incremental revenue available from existing capacity is limited, which means the growth rate is structurally capped until the Arizona and Kumamoto facilities reach volume production. The stock is priced for a growth trajectory that the physical plant cannot yet support.
It is worth noting the irony: banks and semiconductors are hyper-responders to the two most important variables in any DCF model. Banks live and die by changes in WACC, because their business is fundamentally the spread between their cost of funding and their lending rate. Semiconductors live and die by changes in the growth rate (g), because their valuations are built on forward earnings multiples that compress violently when growth expectations are revised downward. Both sectors are reporting in the same week, into a rates environment that pressures both variables simultaneously.
The Week Ahead
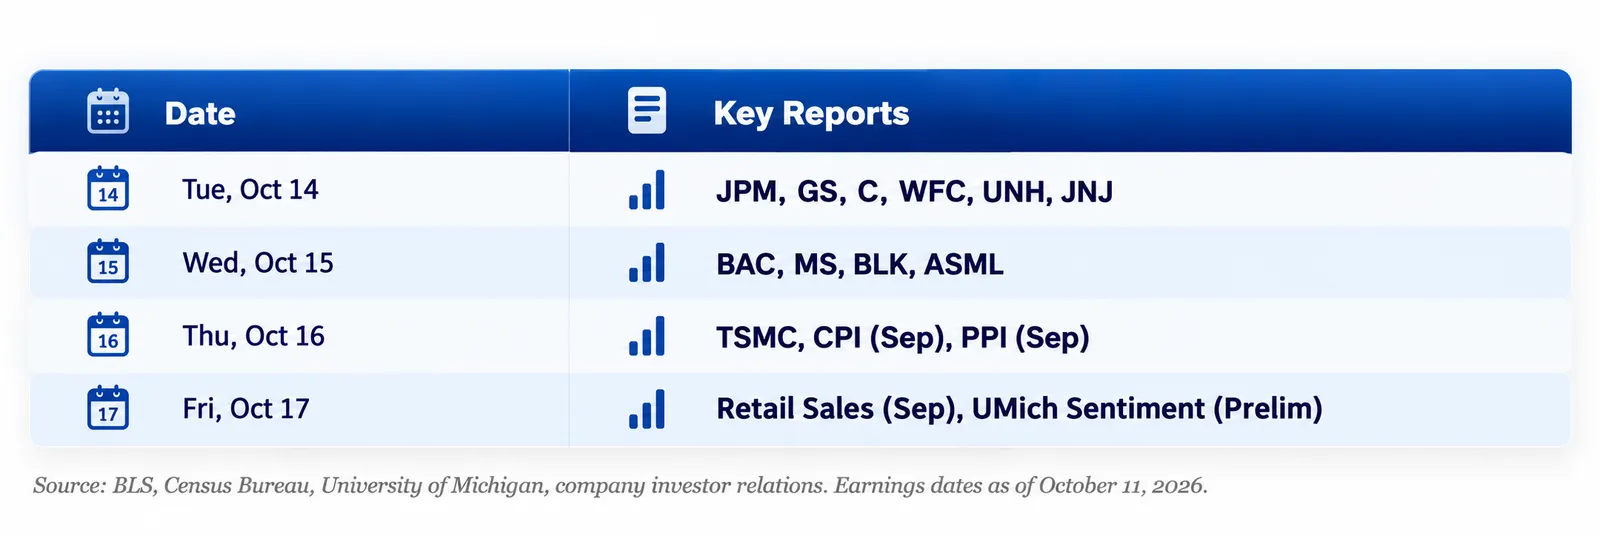
Wednesday's CPI release is the marquee data point. Consensus expects headline CPI at 3.6% year over year, up from 3.3% in August, driven by energy costs tied to the ongoing Red Sea disruption. Core CPI is expected at 2.5% year over year, with core month-over-month at +0.2%. The headline month-over-month print of +0.6% reflects the pass-through of higher gasoline prices. A hot core print would validate the FOMC's hawkish posture and likely push the December hike probability above 90%. A cooler core print would reopen the debate about whether the Fed has room to pause.
Friday brings September retail sales and the preliminary University of Michigan consumer sentiment reading. Retail sales will test the consumer spending thesis: despite collapsing confidence surveys, actual spending on entertainment, recreation, and services has remained robust. The gap between what consumers say and what they do remains one of the most interesting disconnects in the data. If retail sales confirm continued strength, the question becomes who exactly is being surveyed in these confidence readings, because the spending data does not match the sentiment.
The Constructive Case
It would be easy to read the setup as uniformly bearish: hawkish Fed, elevated rates, NIM compression, unrealistic semiconductor expectations. But there are real reasons to practice skepticism about the macro overhang. The labor market has held the 4.1% to 4.2% unemployment rate for months despite persistent calls for deterioration. Consumer spending on discretionary categories remains strong, which is difficult to reconcile with the narrative of an economy on the brink. The reindustrialization theme is a genuine medium-term growth catalyst for manufacturing and industrials, even if the WACC overhang creates near-term headwinds.
Most importantly, the long end of the curve is seeing demand that contradicts the bearish narrative. A 2.8x bid-to-cover on the 10-year and a 2.5x on the 30-year are not the auction results of a market that has lost faith in U.S. sovereign credit. Institutions are buying duration because they believe the hiking cycle is approaching its end, and 5%+ long-term yields are an attractive entry point. Some of the narratives coming out of the bear camp about structural de-dollarization simply do not square with the auction data.
What We Are Watching
Core CPI month-over-month. The headline number will run hot on energy. Core is the signal. A print above +0.3% would confirm the FOMC's hawkish stance and likely seal a December hike. Below +0.2% would reopen the pause debate and take pressure off the short end of the curve.
Bank NIM guidance. The reported numbers are backward-looking. The forward guidance on net interest margins and deposit cost trajectories is what will move the sector. Any commentary suggesting stabilization would be a catalyst for the beaten-down regional bank complex.
ASML order intake. Backlog and new orders are the leading indicators for the capex cycle. A miss on order intake at current valuations would be punishing. The stock has almost no margin of safety at these prices.
Retail sales vs. consumer sentiment. The divergence between spending data and confidence surveys is one of the most telling features of this cycle. A strong retail sales print alongside weak sentiment would further undermine the recession narrative.
Yield curve shape. The short-end/long-end divergence is the signal. If the short end continues to rise while the long end declines, the market is telling you that inflation expectations are a near-term phenomenon, not a structural shift. That is a very different rates environment than the one bears are pricing.
The cost of capital has become the single most important variable in the market. It is compressing bank margins, slowing deal activity, capping semiconductor valuations, and forcing a quality filter across every asset class. This week's earnings will reveal whether the compression is orderly or accelerating. The rates environment is a headwind, but the labor market is stable, institutions are buying duration, and the consumer continues to spend. The bears have a thesis. The data is more nuanced than the thesis allows.
Research | BitDelta Pro
Disclaimer
BitDelta Securities Financial Services LLC, regulated by the Capital Market Authority under Category 5 (Introduction Only), acts solely as an introducer and does not provide trading, execution, dealing, advisory, portfolio management, or custody services. All trading, execution, and investment-related services are provided by BitDelta Limited, Mauritius, a licensed Investment Dealer excluding underwriting. All trading and investments involve risk. The value of investments may fluctuate, and you may receive less than your initial investment.
The information contained in this article is provided for general informational purposes only and does not constitute financial, investment, legal, or professional advice, or a recommendation to buy, sell, or hold any financial product. Readers should seek independent professional advice and conduct their own due diligence before making any decisions. Neither the publisher nor the contributors accept liability for any loss arising from reliance on this content.
Appendix: Sources
Rates & Monetary Policy
FRED: 2-Year Treasury Constant Maturity Rate (DGS2)
FRED: 10-Year Treasury Constant Maturity Rate (DGS10)
CME FedWatch: Federal Funds Rate Probabilities
Federal Reserve: FOMC Minutes, September 2026
U.S. Treasury: Auction Results
UOB: Federal Reserve Rate Forecast Update
Labor Market
BLS: Employment Situation Summary, September 2026
Inflation & Consumer
BLS: Consumer Price Index Summary
Census Bureau: Advance Monthly Retail Trade Survey
University of Michigan: Consumer Sentiment Index
Equities & Earnings
S&P Global: S&P 500 Index Data
SPDR S&P Regional Banking ETF (KRE)
ASML Holding: Investor Relations
Energy & Commodities
EIA: Petroleum & Other Liquids Weekly Supply Estimates
Institutional multi-asset market access across MT5 Ultency, CQG, Iress Pro and BitDelta Terminal, with transparent execution standards and global market coverage.

Select the categories and companies you wish to follow directly to your person rss feed.
Create Custom RSS Feed
just now
Sign up and join over 5,000 professional members who receive personalized news alerts, curated professional connections, and more for free!
September's US inflation report could be a defining moment for the Federal Reserve's next interest rate decision. With headline inflation expected to accelerate while core inflation remains steady, the growing divergence raises an important question: Is inflation pressure becoming more widespread, or is energy driving the narrative? Ahead of the October 14 CPI release, BitDelta Pro Research examines the forces shaping inflation expectations, the signals policymakers may prioritise, and what the data could mean for the Fed's next move.
BingX has launched US stock trading through an integration with Alpaca, giving eligible users access to more than 7,000 US stocks and ETFs. Trades can be funded with USDT and USDC, start from $5 and run 24 hours a day, five days a week. A $200,000 Stocks Mystery Box promotion runs from 9 to 23 October 2026.
Bybit has opened stocks trading to eligible users, offering access to more than 1,000 U.S.-listed stocks and ETFs funded in USDC. Orders are executed through Alpaca, with 24/5 trading, fractional shares and zero commission on eligible trades, plus support for dividends and stock splits. Users must complete KYC checks.
AUDCAD price forecast tracks a bullish retest of 0.99265–0.99450 toward 0.99940, with a weekly support breakdown putting 0.98740 in focus.
Visa has received approval of its Application to Prepare from the People's Bank of China, allowing it to begin formal preparations to establish a domestic bankcard clearing institution in China. The company will now work to complete the process under PBOC regulations before starting domestic clearing operations in the country.
Plus500 has conditionally agreed to acquire Hedge Capital Markets, an SEC-registered US broker-dealer, marking its entry into US securities. The cash-funded deal supports a planned US super-app in Q1 2027 combining futures, prediction markets, stocks, options and ETFs, plus a new hub in New York.
MAS Markets has appointed Simon Naish as Head of APAC to lead its plans across the Asia-Pacific region. Naish brings over 30 years of experience in institutional banking and FX, most recently as Country Head at ATFX Global and previously 33 years at National Australia Bank (NAB) across Asia-Pacific and global markets.
BTCUSD rejects $78,400–$82,175 support. Watch bullish follow-through toward $86,550 and a daily close below $80,268.75 for weakness.
Gold price forecast: Watch $4,175–$4,190 support for bullish confirmation toward $4,265, or a weekly support breakdown toward $3,935.
WTI crude oil price forecast: A confirmed breakout above $94.765 could open the way toward $100.305, while weekly support remains at $87.360–$90.830.