
just now


Liquidity Finder Ltd is incorporated in England and Wales, company number 10610740, registered address 167-169 Great Portland Street, Fifth Floor, London W1W 5PF, United Kingdom.
Published: just now


Gold (XAUUSD) reached $3,880, completing the bearish target from the November 11 forecast. What explained the next leg lower? The clearest signal came on the four-hour chart. Gold broke a minor support level, rallied back to it, then turned lower again. Buyers had lost the level that had supported their previous bounce. Read the $3,880 target recap.
On the charts, the failed four-hour retest followed two earlier warnings: a lower high at weekly resistance and a break below the nearest daily swing low.
The November 11 forecast began with a split between timeframes. Gold had broken below a sideways range on the weekly chart, but buyers had reclaimed $4,000–$4,100 on the daily chart. The original bearish plan called for a daily close below $4,000 and a failed retest before looking toward $3,880. Read the original gold price forecast.

The November 11 weekly chart marks the resistance area that framed the original bearish outlook.
Three details help explain why the later recovery remained vulnerable:
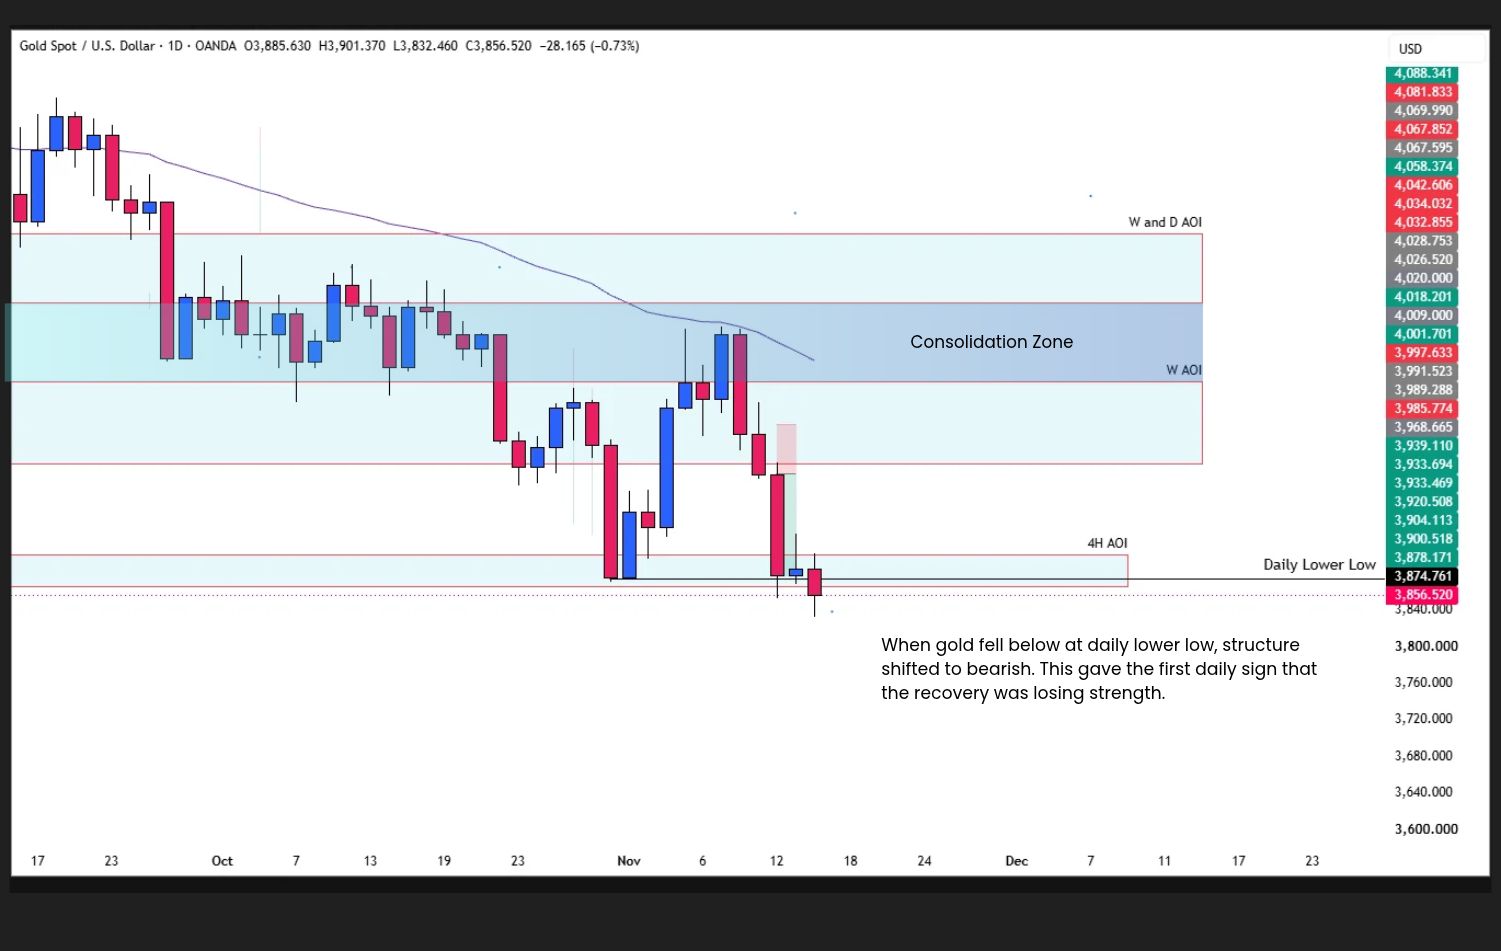
During the recovery, buyers had defended the low of the most recent daily pullback. When gold fell below that low, structure shifter to bearish. This gave the first daily sign that the recovery was losing strength.
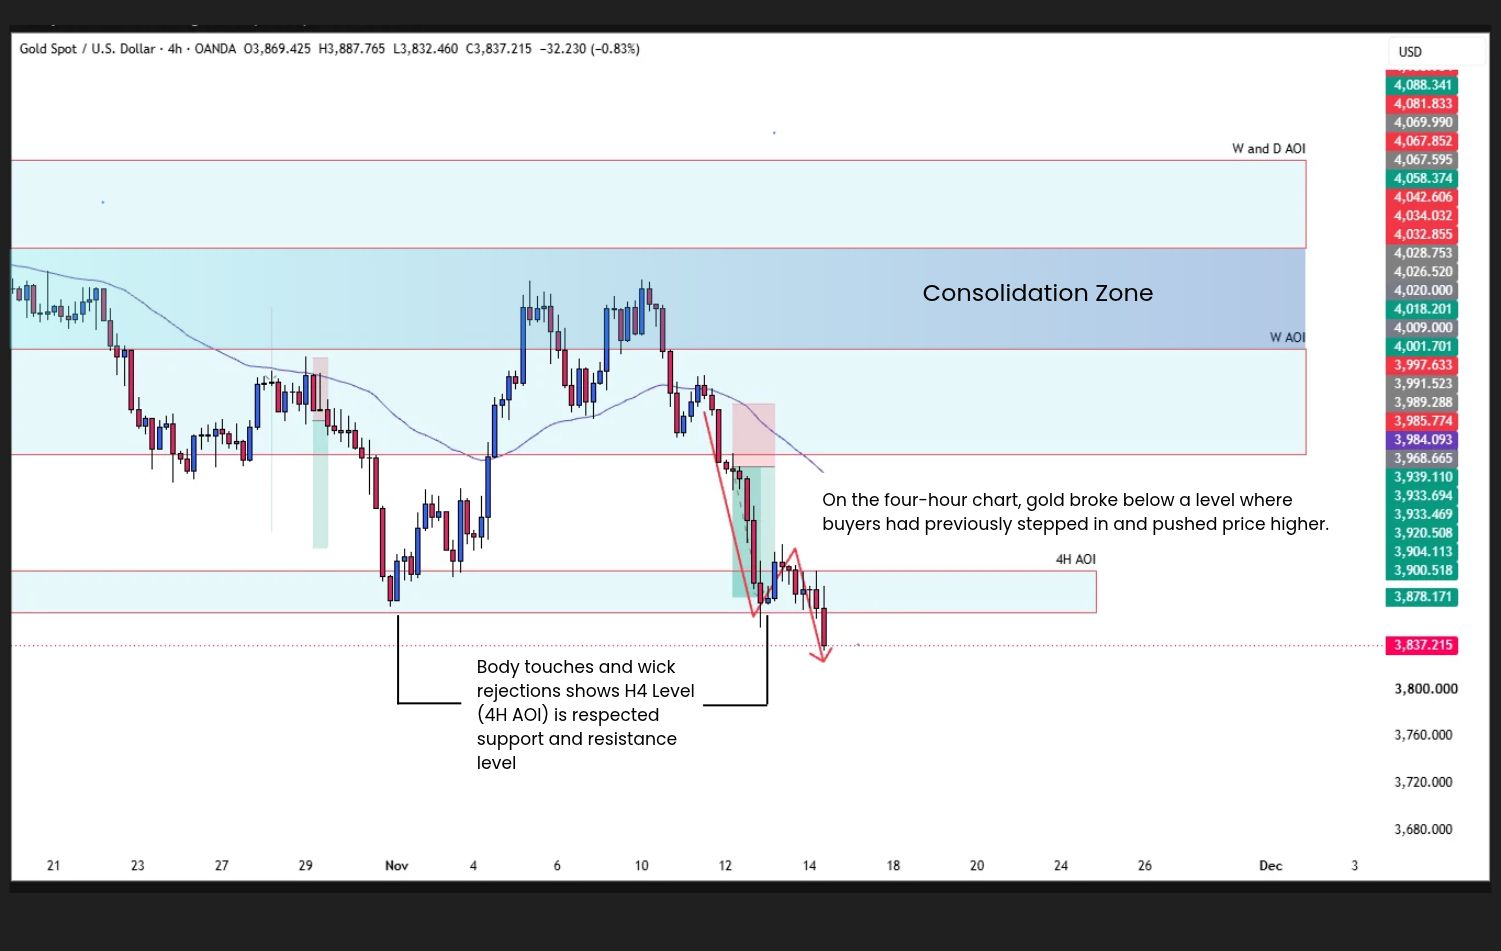
On the four-hour chart, gold broke below a level where buyers had previously stepped in and pushed price higher. This H4 support was separate from the $4,000–$4,100 daily support zone in the original forecast. The next test was whether buyers could reclaim it on a rebound.
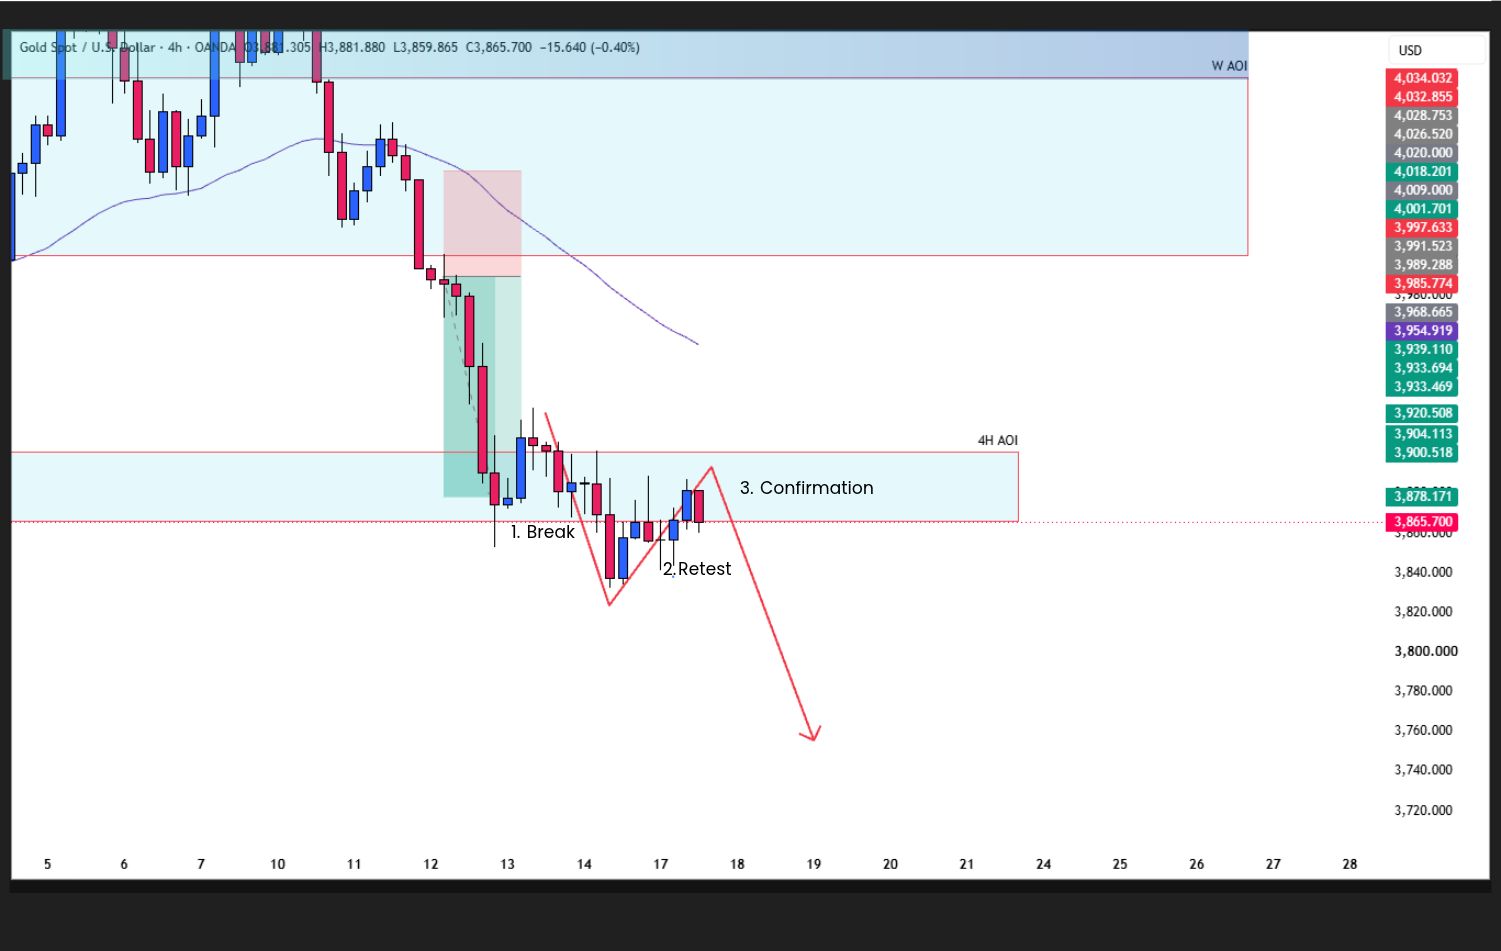
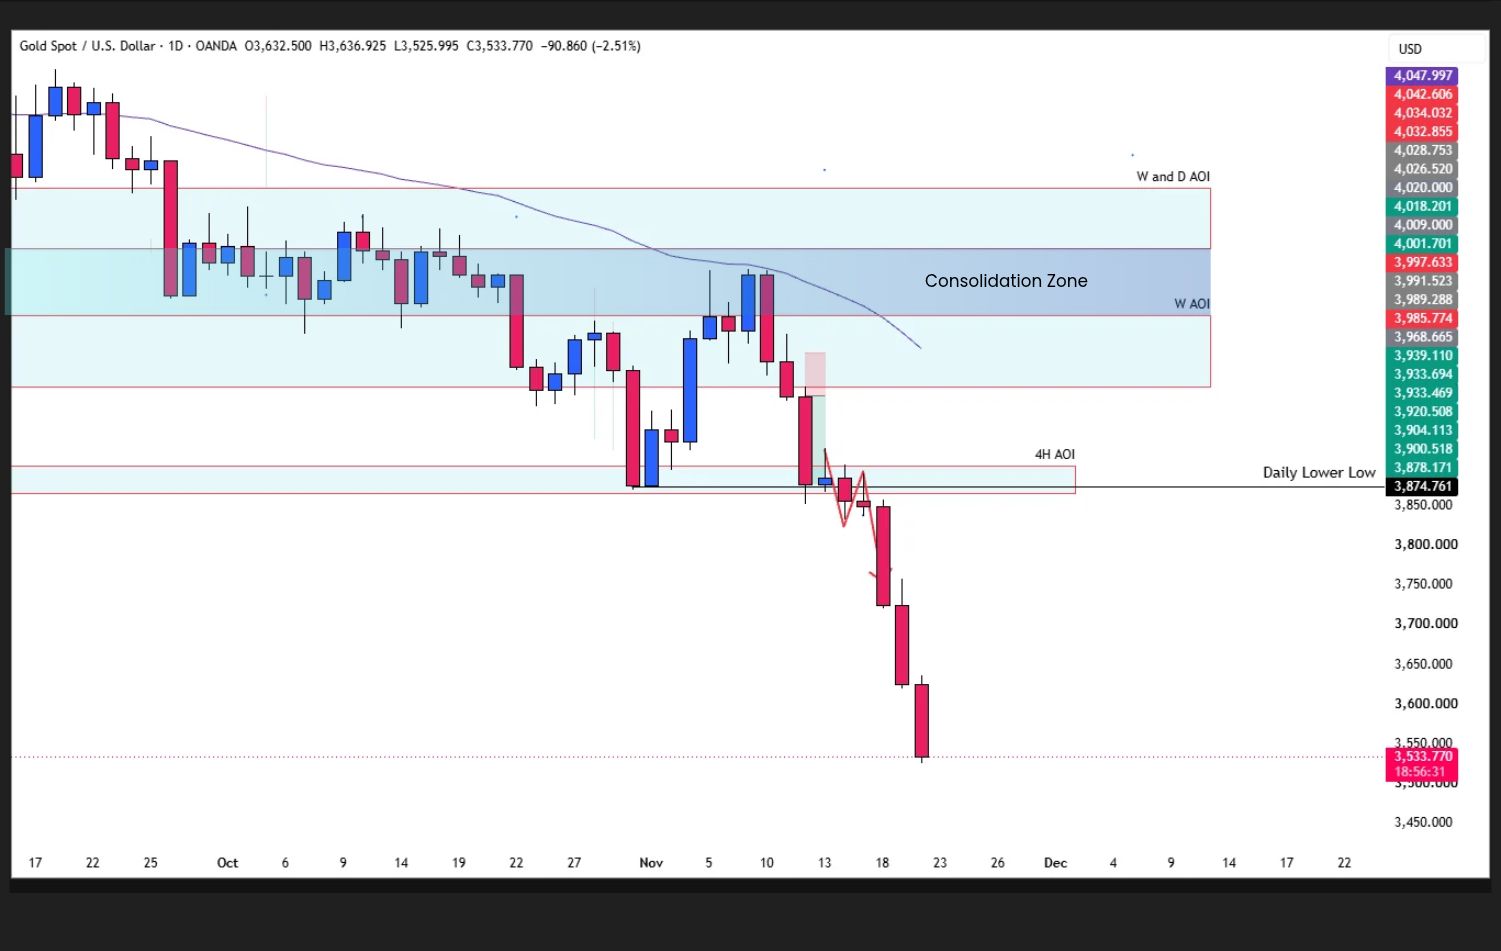
The failed retest showed that former support had become resistance. The same area that had supported an earlier bounce now capped the recovery. How the break-and-retest pattern works
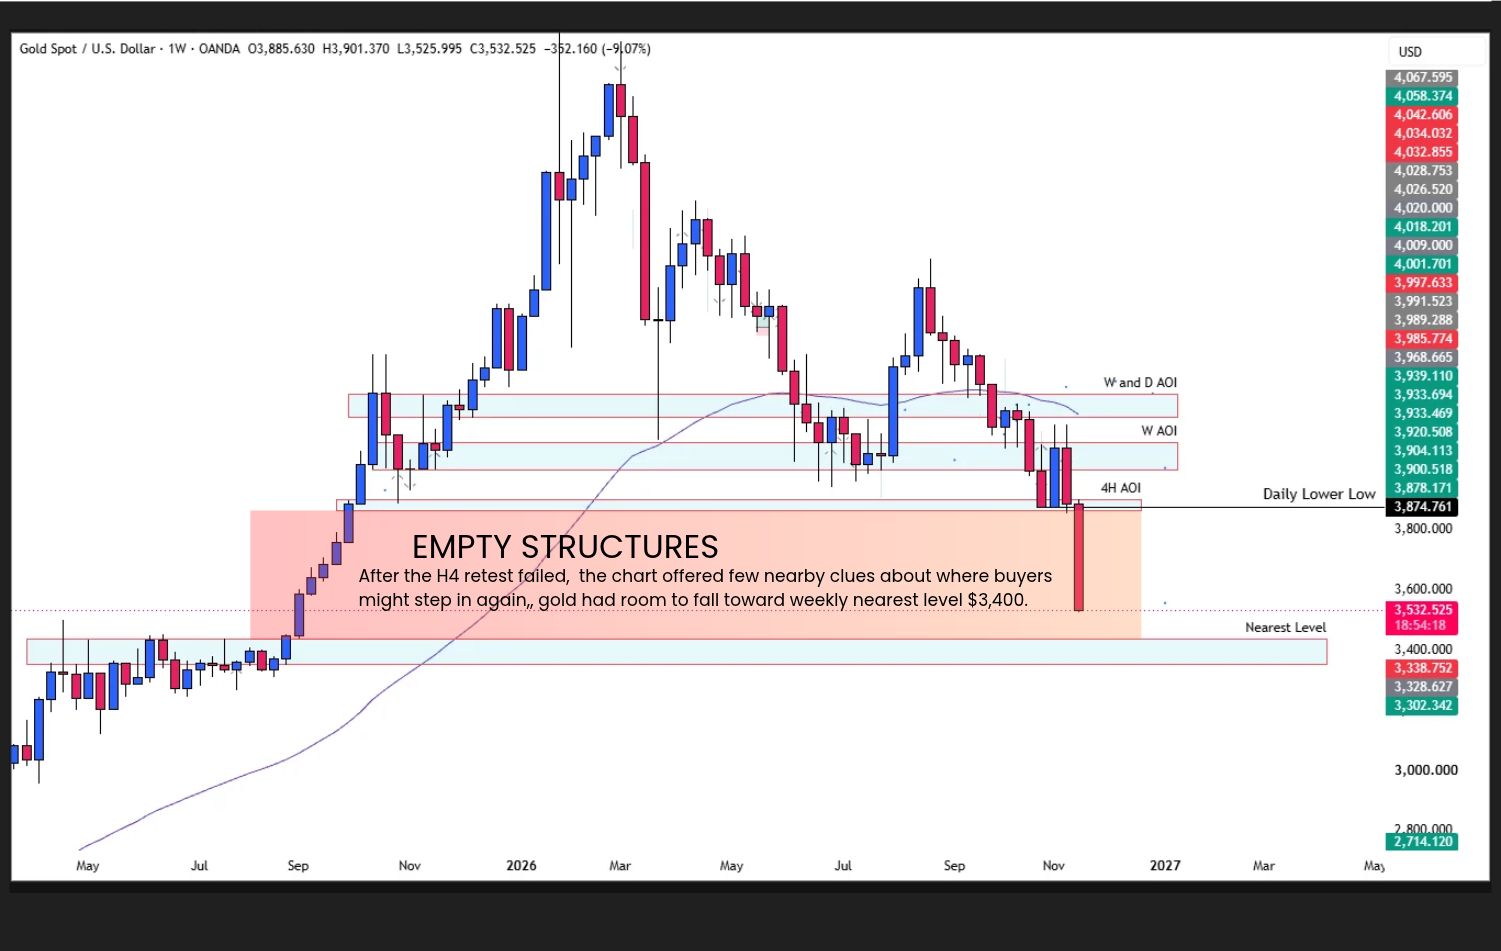
Looking left on the weekly chart, there were few prior structure or consolidation ranges where buyers had repeatedly defended price. Once the H4 rebound failed to hold, the chart offered few nearby clues about where buyers might step in again.
Around $3,400 was the next clearly marked weekly support area in this analysis. Gold could still find buyers sooner, but $3,400 stood out as a level where buyers had previously responded.

Gold reached $3,880, completing the original downside target. Its rebound stalled at weekly resistance below the 50-week EMA, and gold broke below its previous daily swing low. On the four-hour chart, sellers defended former support on the retest, and the decline resumed.
Will gold reach $3,400? XAUUSD is still approaching that nearest weekly support area, and the zone has yet to be tested. If gold stays below the broken four-hour level, a move toward $3,400 remains in play. If buyers reclaim that level and hold it on a pullback, the decline could stall before gold gets there.
Read the trend. Mark the level. Wait for confirmation. No confirmation, no trade.
______________________________________________________________________________________
A clear Gold trading strategy starts with understanding the trend, marking key levels, and waiting for confirmation. Build your foundation with these guides:
Start with one Gold setup and one timeframe combination. Practice on a demo trading account, record your decisions, and review your execution.
______________________________________________________________________________________
Before moving to live trading, understand the account terms, trading costs, and risks. Use only capital you can afford to lose. Demo results do not guarantee live performance.
Explore an ACY Live Trading Account
______________________________________________________________________________________
Follow Ruffy Grant B. Capacio for price action education, Gold and Forex analysis, and trading psychology insights.
Follow on LinkedIn · Join the ACY Securities Discord Community
Risk Disclaimer:
Trading leveraged financial instruments involves significant risk and may not be suitable for everyone. This content is for general education and information only and is not financial advice or a recommendation to trade. Past performance, demo results, and price targets do not guarantee future outcomes. Consider your objectives, experience, and risk tolerance, and seek independent advice where appropriate. Only trade with capital you can afford to lose. November 20, 2026
ACY Securities is one of Australia's fastest growing multi-asset online trading providers, offering ultra-low-cost trading, rock-solid execution, technologically superior account management and premium market analysis.

Select the categories and companies you wish to follow directly to your person rss feed.
Create Custom RSS FeedSign up and join over 5,000 professional members who receive personalized news alerts, curated professional connections, and more for free!
Why did gold keep falling after reaching $3,880? See how a failed 4-hour retest confirmed weakness in XAUUSD and why $3,400 is the next weekly support to watch.
Reality television personality Aaron Chalmers and finfluencer Jason Agbodza have been fined after pleading guilty to illegally promoting an unauthorised foreign exchange trading scheme on social media.
UK retail sales rose a stronger-than-expected 0.7% in October, giving sterling some support, while a deepening tech sell-off pushed the dollar lower overnight against all major currencies. Thanim Islam, Head of FX Analysis at Equals, says the dollar remains in charge as the week ends, with the Fed expected to raise rates more than both the Bank of England and the ECB.
Nvidia beats expectations, reporting $115.8bn in revenue and raising its long-term growth outlook, but the stock still struggled to sustain its gains. AI remains fundamentally strong, but investor expectations are becoming more demanding, particularly around capex and profitability. Wall Street suffered a major sell-off, with the S&P 500 entering a six-session losing streak as rate concerns intensified.
iSAM Securities reviews the ris of weekend gold trading
Webull Corporation reported record third quarter 2026 revenue of $218.7 million, up 39% year-on-year, with customer assets reaching $32.4 billion and options contracts volume up 79%. Net income attributable to the company was $31.2 million, while margin debit balances passed $1 billion for the first time.
Anthropic, the company behind the Claude family of AI models, begins trading on the Nasdaq today under the ticker ANT. It priced its shares at $83 last night, above its marketed range of $70 to $78, and raised about $81.3 billion. That makes it the largest initial public offering on record, ahead of the roughly $75 billion SpaceX raised in June. This note covers what investors need to know: the terms, the business, how the company is governed, and what to watch.
Nvidia's first results without Jensen Huang answered the question that has hung over the AI trade since October. Revenue of $115.8 billion beat consensus by about $7 billion, fourth-quarter guidance of $130 billion came in roughly $5 billion above expectations, and the company raised its outlook for next fiscal year to around 75% growth. All of this assumes no data-centre sales to China.
Marex has entered the football financing market through a partnership with specialist sports investment and advisory firm Pinto Capital, targeting clubs in the Premier League and EFL Championship.
Around 110,000 UK retail investors have secured $300 million worth of Anthropic shares in its record-breaking $81 billion IPO. The heavily oversubscribed offer, coordinated by RetailBook, saw smaller investors prioritised, with 63% of applicants receiving their full allocation.