just now

Liquidity Finder Ltd is incorporated in England and Wales, company number 10610740, registered address 167-169 Great Portland Street, Fifth Floor, London W1W 5PF, United Kingdom.
Published: just now

Goal of This Lesson:
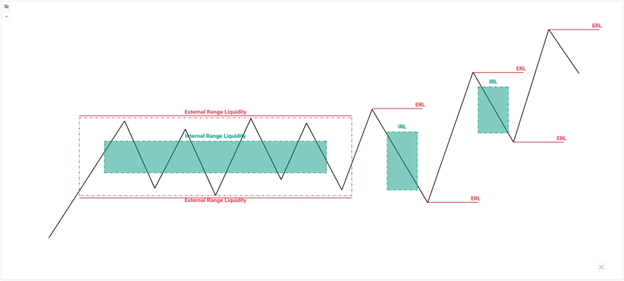
To teach you exactly where liquidity hides on your chart, and how to distinguish between External Range Liquidity (ERL) and Internal Range Liquidity (IRL). These two zones work together like offense and defense in a game—you hunt in one, and you enter in the other.
By the End of This Lesson, You Should Be Able To:
Let’s Start With a Question:
Where do most traders put their stop-losses?
And where do most breakout traders enter?
That’s where liquidity pools form.
Think of ERL as the bait smart money uses to trap retail traders.
These are levels outside the current price range where:
ERL Levels:
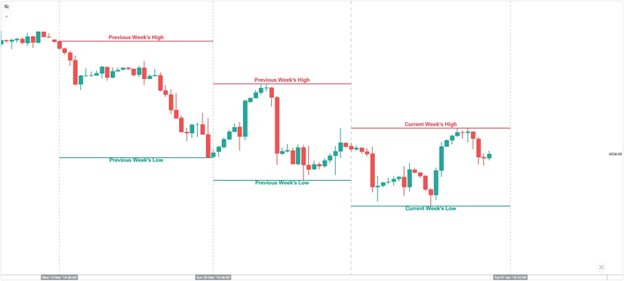
This is the highest high and lowest low that price traded to during the span of the week.
This is usually targeted to be reached at the end or during the week.
The key here is analyzing price and anticipating a draw on the previous highs / lows given that we have a direction in mind.
2. Previous Day High (PDH) / Previous Day Low (PDL)
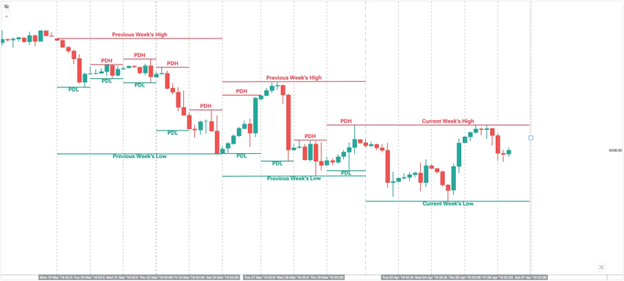
This is the highest high and lowest low that occurred during the day.
Unlike the weekly, the daily highs and lows are used by day traders or scalpers as target for the day and potential continuation to the direction of the previous day’s candle.
3. Previous Session High/Low
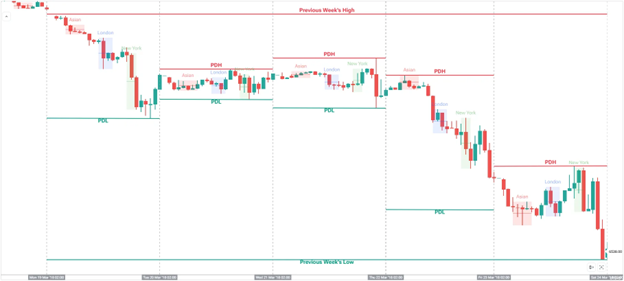
These levels are based on time:
Reversals often occur on these levels.
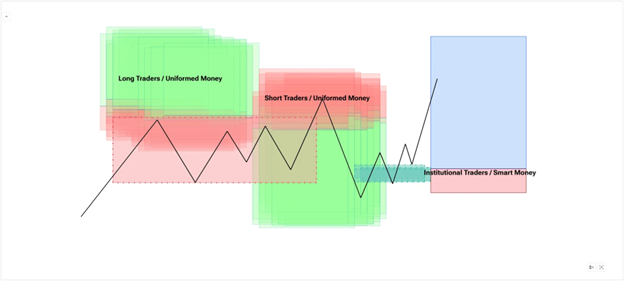
Smart money targets these levels to:
In short, smart money institutions target these levels for the sake of filling orders. Remember, institutions need a large number of resting orders so they could get in in the market.

Imagine a lion hunting a herd of deer. The lion doesn’t chase the deer into the open field. Instead, it waits near the waterhole—the predictable place where deer always gather.
ERL = The Waterhole.
That’s where stop-losses gather. That’s where price will be lured.
Price will always move to a level where there is a resting order, whether it is a high, a low, or even volume imbalances located inside those highs and lows.
Once price sweeps external liquidity, it doesn’t just drop endlessly or fly without pullback. Institutions often re-enter, add to their positions, close their hedges during the retrace. That retrace often targets Internal Range Liquidity.
When price breaks out of a range, this usually triggers buy orders with stop-loss orders just below the breakout level. Reversal traders also get involve and most of those traders, get into short positions blindly without understanding what the current trend is. We will also discuss this in Part 4 on how to determine the trend using market structures.
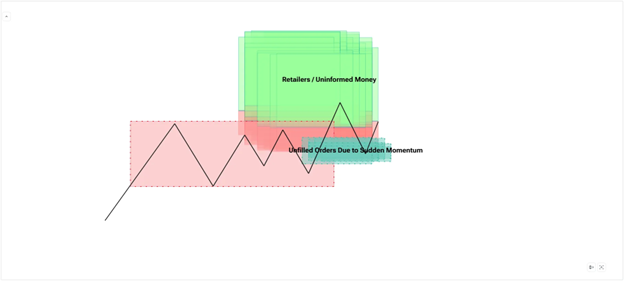
The sudden move outside of the range causes a rush for traders to get in with a “FOMO” mindset. The momentum also causes price to leave Gaps, often called Fair Value Gaps or Volume Balances, which we will discuss in a while, unfilled orders they COULD return to through a pullback or retracement to fill their positions.
Theories for the retracement:
Institutions will fill as much as it can all the available or resting orders so they can get filled with all their positions.
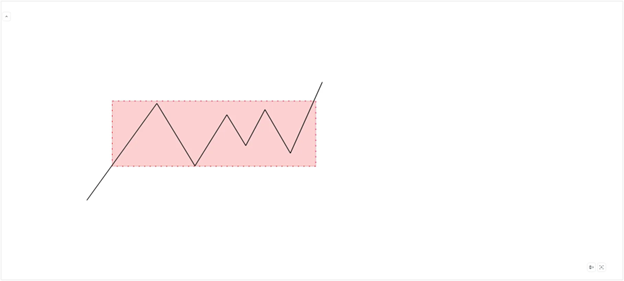
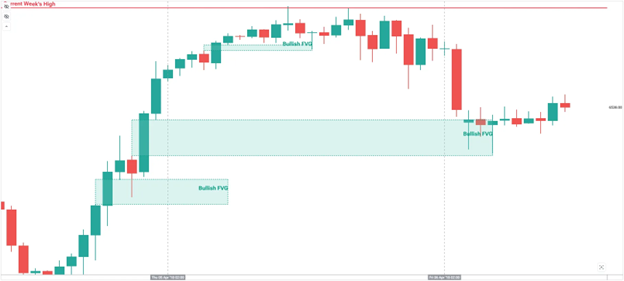
IRL is inside the price leg. It forms as a result of displacement or a sudden move of price, and the most precise tool to spot it is the Fair Value Gap (FVG).
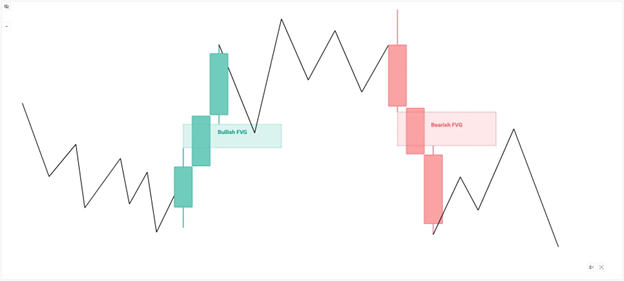
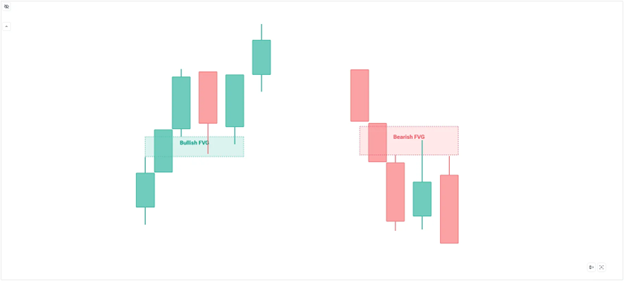
FVG Parameters:
No Fair Value Gap Below

In this case, the middle candle is not considered as an FVG the momentum left no gaps for price to trade to.
The premise is, there are no more “un-filled orders”.
A good fair value gap is where price just touches it and moves away from it fast and going to the direction of the current trend.
Where IRL Shows Up:
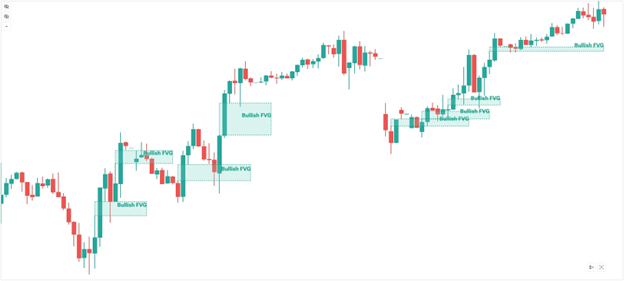
Here’s the institutional flow:
After coming from a downtrend, we are now on a bullish sequence.
We follow the higher timeframe trend at the lower timeframes which in this case is bullish.
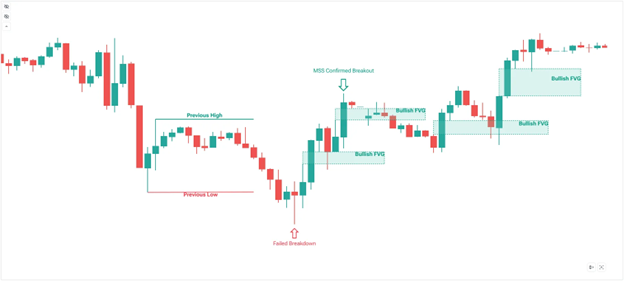
2. Mark your ERL levels:

3. Wait for price to sweep that level → grab liquidity
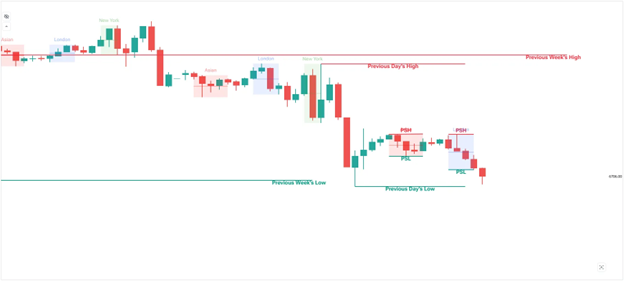
In this case, prior to our trading day, the Previous Week’s Low has already been tapped. And at the current day, the Previous Day’s Low has also been tested.
After touching the low, price reacted bullishly, taking out the sell orders, and potentially proceed to the upside.
To confirm this liquidity being grabbed:
4. Watch for MSS (intent confirmed)
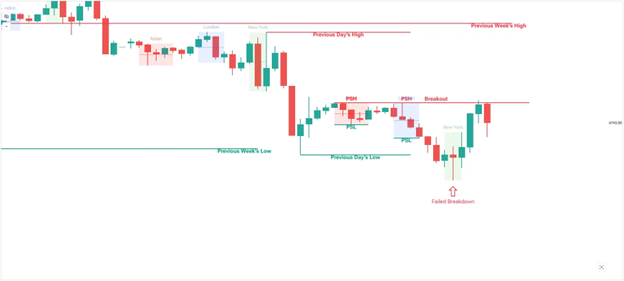
There must be a breakout on the opposing side to confirm the market has already shifted from a bearish stance to bullish.
5. Entry on IRL (FVG) during retrace with stops behind the:
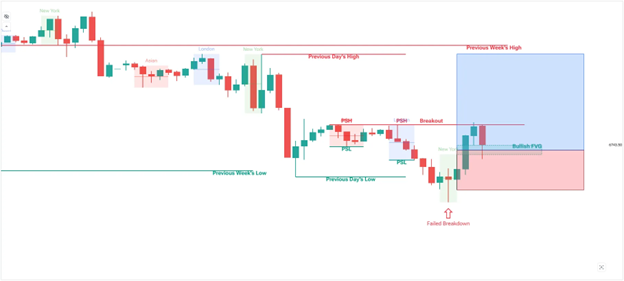
6. Target the next ERL
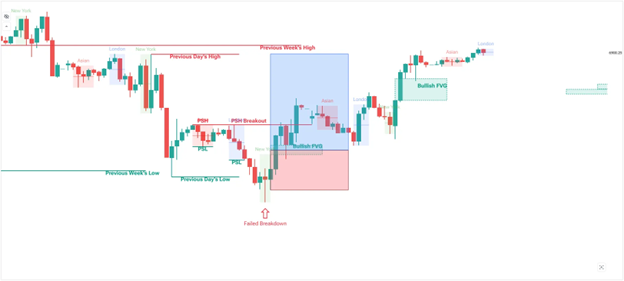
They work like magnets and entry points.
ERL is the target. IRL is the entry.
Beginner Trap to Avoid:

Many retail traders see price hit a previous high and immediately buy the breakout. That high is ERL—it’s not an invitation to enter, it’s a warning that liquidity is about to be collected.
Once you train your mind to say:
you’ve officially started thinking like smart money.
Pro Tip:
Before looking for a trade, wait first for key levels or ERLs to get taken out first and observe price on a lower timeframe like 1-Hour to confirm if that level is being taken out or not.
A good sweep is where price does not trade or close beyond the level then reverses with a new FVG to trade at.
Transition to Part 3: From Identifying Liquidity to Understanding Price Behavior
Now that you know where liquidity hides—External for targets, Internal for entries—you’re beginning to see how smart money maps out its traps and setups. But there’s more to this game than just marking levels.
Liquidity doesn’t just exist in a vacuum—it works hand-in-hand with how price moves. You’ve seen how price hunts ERL and retraces to IRL. But what tells you that the move is real? That the shift in direction is valid?
This is where displacement and intent come in—and that’s exactly what we’re diving into next.
In Part 3: Understanding Displacement and Confirming Market Intent
You’ll learn how to:
This content may have been written by a third party. ACY makes no representation or warranty and assumes no liability as to the accuracy or completeness of the information provided, nor any loss arising from any investment based on a recommendation, forecast or other information supplies by any third-party. This content is information only, and does not constitute financial, investment or other advice on which you can rely.
ACY Securities is one of Australia's fastest growing multi-asset online trading providers, offering ultra-low-cost trading, rock-solid execution, technologically superior account management and premium market analysis.
Select the categories and companies you wish to follow directly to your person rss feed.
Create Custom RSS FeedSign up and join over 5,000 professional members who receive personalized news alerts, curated professional connections, and more for free!
Sterling steadies after political uncertainty rattled gilt markets, while EUR/USD and EUR/GBP approach key technical levels ahead of today's European session.
GBP/AUD remains trapped in a well-defined bearish trend on both the weekly and daily timeframes.
Discover the key drivers, technical levels, and central bank expectations shaping the EUR/USD trend as the ECB prepares to hold rates and markets watch for a potential breakout.
Sydney-based multi-asset broker ACY Securities has introduced PAXGUSD, a new CFD instrument that allows clients to trade tokenised gold against the US Dollar 24 hours a day, seven days a week. The instrument is available across MetaTrader 4, MetaTrader 5, and the ACY Trading Platform.
Binance has lowered its VIP 3 Wallet Assets threshold from $3 million to $1 million and will now count OTC Spot Trading Volume at a 4x multiplier toward VIP qualification, removing the previous VIP 4 cap and allowing eligible users to progress through the full tier framework up to VIP 9.
Retail futures trading leader NinjaTrader Group has appointed Mark Omens as Senior Vice President, Commercial Strategy, bringing a 25-year veteran of derivatives marketplace CME Group into a newly created role focused on exchange partnerships and enterprise growth.
Gold Price Action Forecast: Will XAU/USD Drop to $3930? Meta Description: Read our Gold price action forecast to see if XAU/USD will drop to $3930.
BitDelta Securities Financial Services LLC (“BitDelta Securities”) today announced that it has received full regulatory approval from the Capital Market Authority (“CMA”) of the United Arab Emirates under the Category 5 — Arrangement and Advice license framework (License No. 20200000439). The approval follows the firm's receipt of In-Principal Approval earlier this year and represents the successful conclusion of the CMA's full licensing process, including the satisfaction of capital requirements, governance appointments, and operational setup.
Crypto.com has received a $400 million strategic investment from Citadel Securities, valuing the firm at $20 billion. It marks the first institutional funding round in the company's history, aimed at accelerating its expansion into tokenised securities, derivatives and other asset classes.
WTI’s pullback into $79–82 is the first major test of the bullish Elliott Wave count, with buyers targeting a renewed break above $85.


