just now

Liquidity Finder Ltd is incorporated in England and Wales, company number 10610740, registered address 167-169 Great Portland Street, Fifth Floor, London W1W 5PF, United Kingdom.
Published: just now

To teach you how to properly use the Relative Strength Index (RSI) based on market context — so you can avoid common traps, confirm trends with precision, and time reversals like a pro.

Most traders know what RSI is — but very few know how to use it properly.
You’ve probably heard:
And yet... price keeps pushing against you.
The truth is, RSI isn’t broken — your interpretation might be.
When used with the right market context, RSI becomes one of the clearest, most reliable tools for reading trend strength, spotting reversals, and filtering bad trades.
Let’s fix the myths — and unlock how to use RSI the smart way.
RSI (Relative Strength Index) is a momentum indicator that measures the speed and strength of price movements.
But those zones don’t always mean it’s time to reverse. That’s where most traders get trapped.
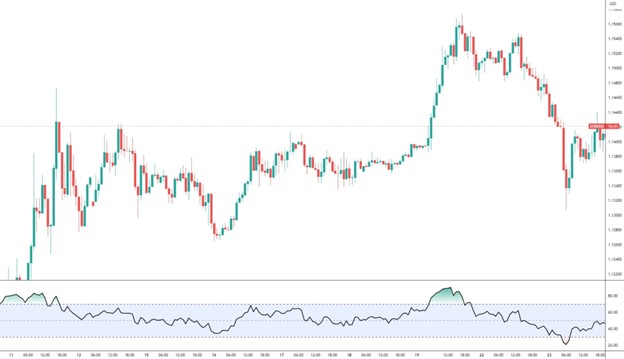
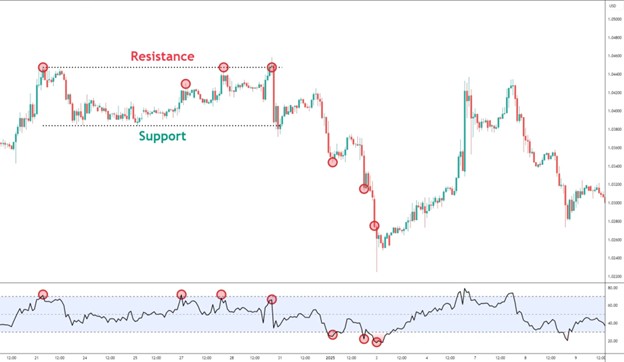
🔄 In a Range-Bound Market
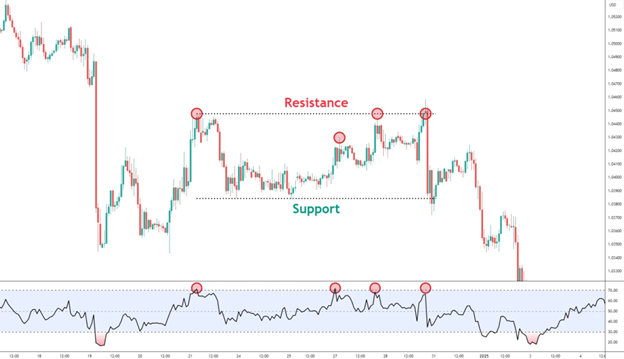
Price is bouncing between support and resistance.
Use RSI like a rubber band — when it’s stretched too far in a sideways market, expect a snap back.
📈 In an Uptrend
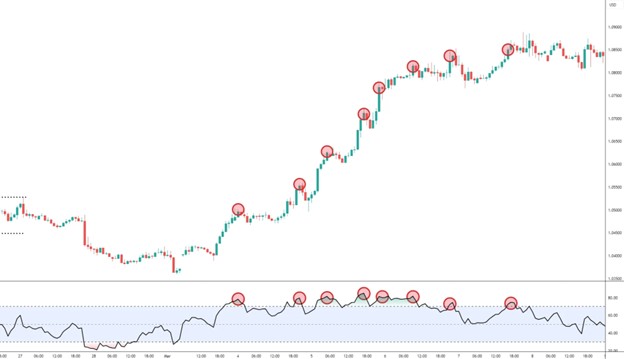
Price is climbing with strong momentum.
In a trend, RSI above 70 is a green light, not a red flag.
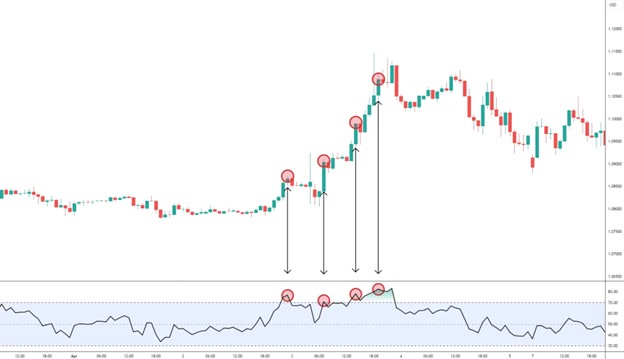
📉 In a Downtrend
Price is declining and sellers dominate.
In a strong downtrend, RSI confirms bearish conviction — don’t fight it.
RSI as a Trend Filter
Use RSI to confirm trend health:
Divergence = a disturbance in momentum.
Tip: Switch to line chart view when spotting divergences — it clears out the candle noise and shows clean RSI behavior.

The secret to using RSI effectively?
RSI is not a signal — it’s a story.
But only when paired with market structure and trend context.
In a range → Trade reversals off overbought/oversold
In a trend → Trade with momentum, not against it
Spot divergences → They often hint at the turning point before price reacts
“Indicators don’t make decisions — traders do. RSI is powerful, but only when you stop reacting to it blindly and start listening to what it’s really telling you.”
Check Out Our Market Education
How to Start Day Trading:
5 Steps to Start Day Trading: A Strategic Guide for Beginners
8 Steps How to Start Forex Day Trading in 2025: A Beginner’s Step-by-Step Guide
3 Steps to Build a Trading Routine for Consistency and Discipline - Day Trading Edition
Learn how to navigate yourself in times of turmoil:
How to Identify Risk-On and Risk-Off Market Sentiment: A Complete Trader’s Guide
How to Trade Risk-On and Risk-Off Sentiment — With Technical Confirmation
The Ultimate Guide to Understanding Market Trends and Price Action
Want to learn how to trade like the Smart Money?
Mastering the Market with Smart Money Concepts: 5 Strategic Approaches
Mastering Candlestick Pattern Analysis with the SMC Strategy for Day Trading
Understanding Liquidity Sweep: How Smart Money Trades Liquidity Zones in Forex, Gold, US Indices
The SMC Playbook Series Part 4: How to Confirm Trend Reversal & Direction using SMC
The SMC Playbook Series Part 5: The Power of Multi-Timeframe Analysis in Smart Money Concepts (SMC)
Fair Value Gaps Explained: How Smart Money Leaves Footprints in the Market
Trading Psychology and Continuous Improvement Contents:
The Mental Game of Execution - Debunking the Common Trading Psychology
5 Steps to Backtest a Trading Strategy with AI: A Step-by-Step Guide
Managing Trading Losses: Why You Can Be Wrong and Still Win Big in Trading
Follow me on LinkedIn: Jasper Osita
Join me in Discord: The Analyst Guild
This content may have been written by a third party. ACY makes no representation or warranty and assumes no liability as to the accuracy or completeness of the information provided, nor any loss arising from any investment based on a recommendation, forecast or other information supplies by any third-party. This content is information only, and does not constitute financial, investment or other advice on which you can rely.
ACY Securities is one of Australia's fastest growing multi-asset online trading providers, offering ultra-low-cost trading, rock-solid execution, technologically superior account management and premium market analysis.
Select the categories and companies you wish to follow directly to your person rss feed.
Create Custom RSS FeedSign up and join over 5,000 professional members who receive personalized news alerts, curated professional connections, and more for free!
Retail futures trading leader NinjaTrader Group has appointed Mark Omens as Senior Vice President, Commercial Strategy, bringing a 25-year veteran of derivatives marketplace CME Group into a newly created role focused on exchange partnerships and enterprise growth.
Gold Price Action Forecast: Will XAU/USD Drop to $3930? Meta Description: Read our Gold price action forecast to see if XAU/USD will drop to $3930.
BitDelta Securities Financial Services LLC (“BitDelta Securities”) today announced that it has received full regulatory approval from the Capital Market Authority (“CMA”) of the United Arab Emirates under the Category 5 — Arrangement and Advice license framework (License No. 20200000439). The approval follows the firm's receipt of In-Principal Approval earlier this year and represents the successful conclusion of the CMA's full licensing process, including the satisfaction of capital requirements, governance appointments, and operational setup.
Crypto.com has received a $400 million strategic investment from Citadel Securities, valuing the firm at $20 billion. It marks the first institutional funding round in the company's history, aimed at accelerating its expansion into tokenised securities, derivatives and other asset classes.
WTI’s pullback into $79–82 is the first major test of the bullish Elliott Wave count, with buyers targeting a renewed break above $85.

BitDelta Securities has secured a full CMA Category 5 licence in the UAE and opened a regulated office in Business Bay, Dubai. The firm operates as an introducing broker, connecting investors with licensed international brokers across multiple asset classes, with CEO Dr. Demetrios Zamboglou commenting on the milestone.
Index volatility is asleep while single stocks fight it out underneath, credit refuses to confirm the equity rally, and a bare macro calendar hands next week to oil.
Digital assets and FX brokerage GC Exchange FZE (GCEX) has appointed Mohammed A. Mulla as a Board Member of its Dubai-based entity, part of the wider GCEX Group.
Learn what Blockchain-as-a-Service is, how it works, and why businesses are using BaaS to build blockchain applications without managing infrastructure.
CFDs vs stocks compared on leverage, ownership, costs, dividends, taxes, and risk. Learn the differences between stocks and CFDs and discover which suits your investing or trading goals.