Both CFD indices for Nasdaq and S&P 500 have since reclaimed their four-hour 200 EMA, giving the recovery a stronger technical base.
A bullish divergence appears when price makes a lower low while RSI forms a higher low. It suggests that selling momentum is weakening, although it does not guarantee that the trend has reversed.
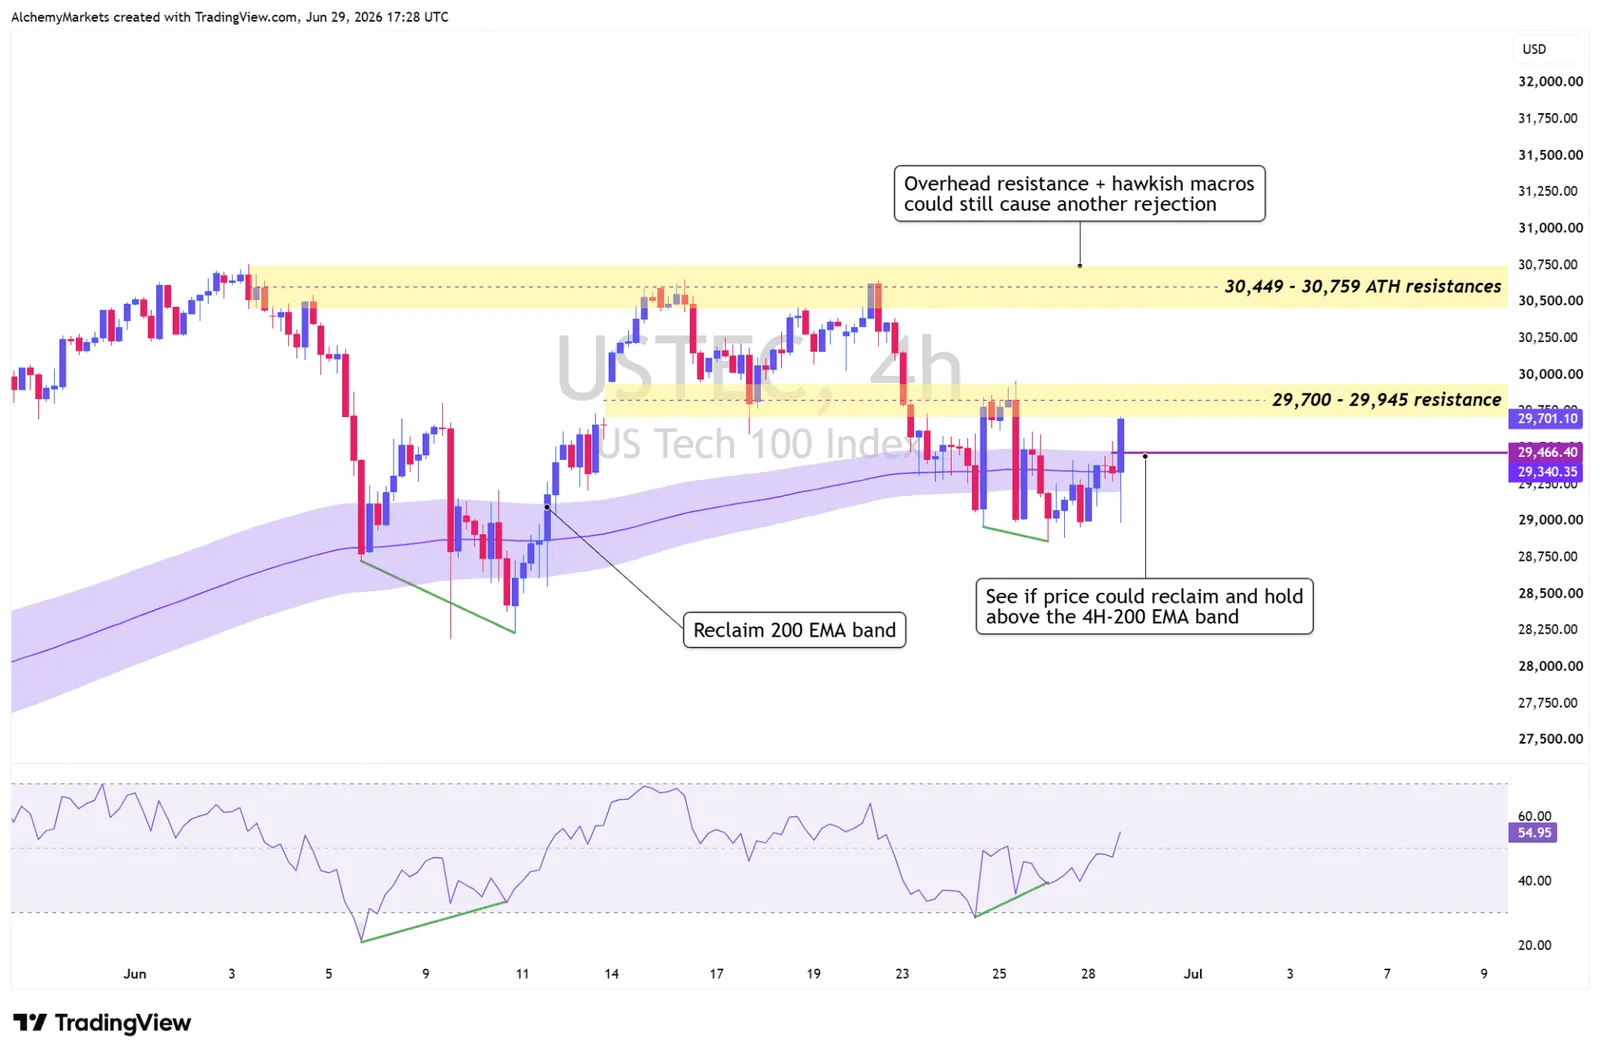
Nasdaq (USTEC) 4H Chart:
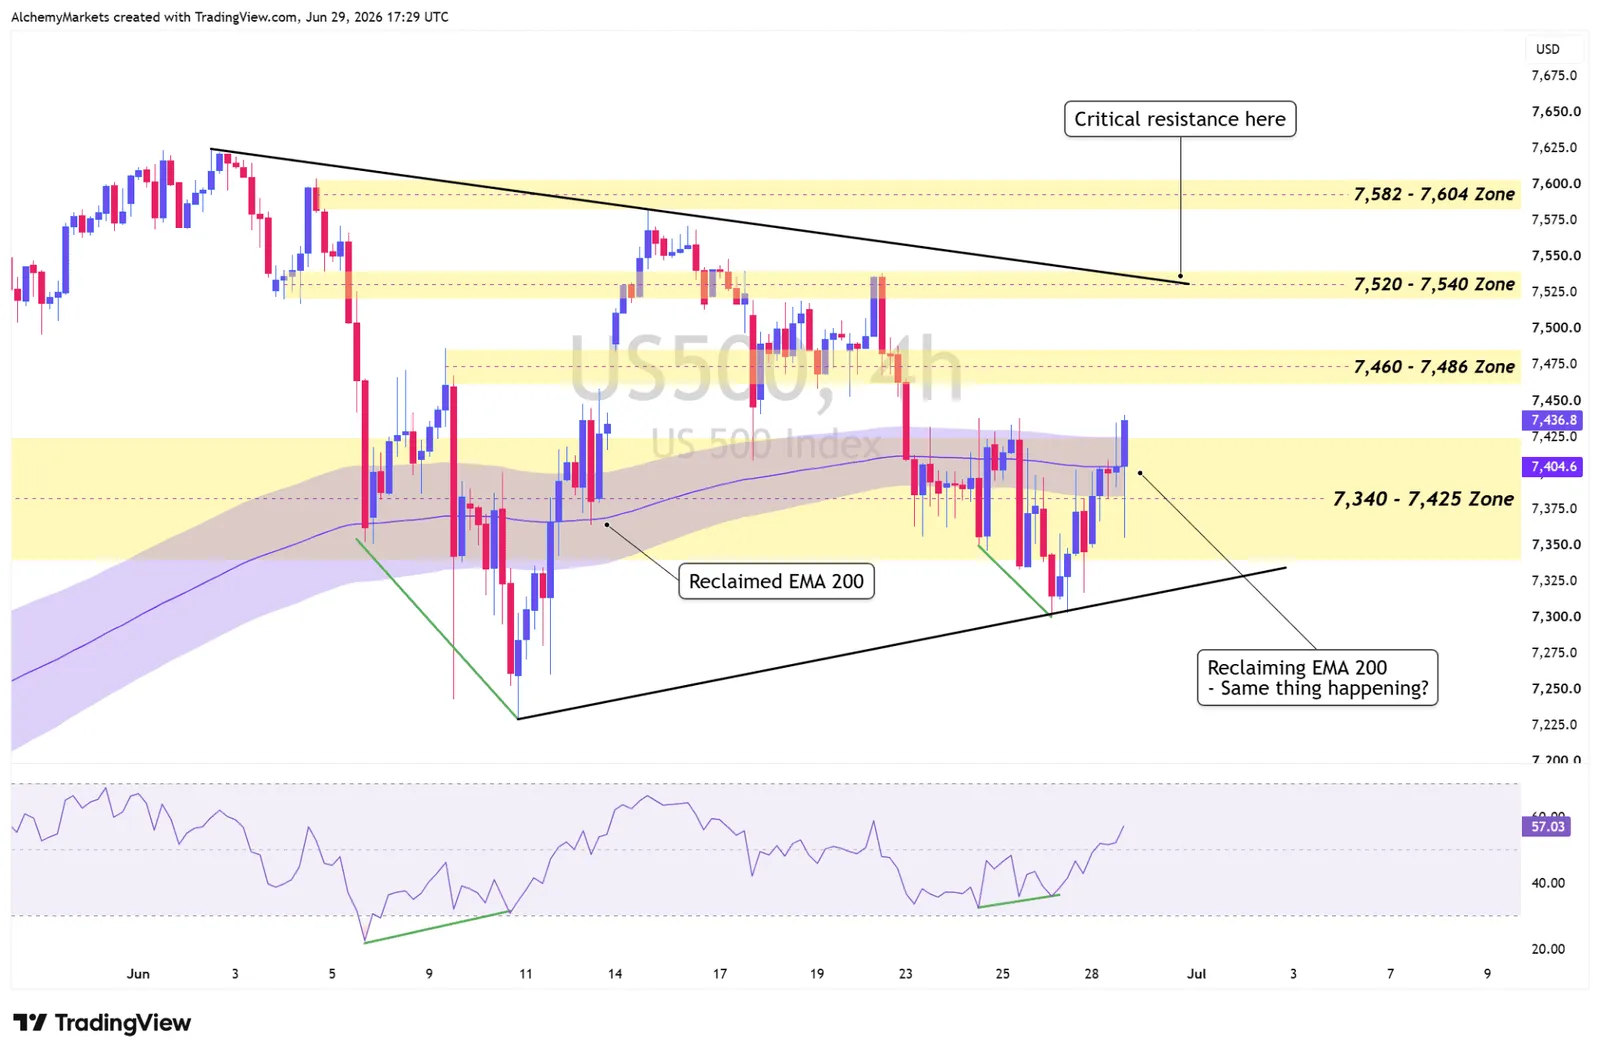
S&P 500 (US500) 4H Chart:
The next issue is overhead resistance.
| Market | Reclaimed support | Next resistance | Larger target |
| USTEC | 29,340–29,466 | 29,700–29,945 | 30,449–30,759 |
| US500 | 7,340–7,425 | 7,460–7,486 | 7,520–7,540, then 7,582–7,604 |
USTEC is already testing the lower edge of its first resistance zone. A clean move through 29,945, followed by a successful retest, would make the recovery more convincing.
US500 has also improved, but it still faces several layers of support and resistance. The falling trendline around 7,520–7,540 may be the more important test.
If both indices hold their reclaimed 200 EMA bands and clear their first resistance zones, the rally begins to look broader than a short-covering bounce.
If they fall back below those moving averages, last week’s downtrend remains in control.
Why the rally could still be rejected
The geopolitical situation has calmed, but it remains fragile. Another round of attacks or a formal breakdown in negotiations could quickly lift oil, inflation expectations and defensive demand for the dollar.
The AI trade has its own unresolved pressure...