
Stocks are still behaving like the worst of the latest macro shock may be passing. Oil has retreated from its September spike, long-end yields have eased from their extremes, and AI and semiconductor leadership remains intact.
But the rally has reached a more difficult point. USTEC (Nasdaq CFD) is sitting at all-time-high resistance while its one-hour trend is weakening, and the part of the Treasury market closest to Federal Reserve policy still has not broken lower.
That keeps the regime selectively bullish, but fragile. Equities do not need an outright dovish Fed to keep rising. They need the dollar and short-term yields to stop tightening financial conditions.
Tech is bullish, but the short-term trend is being tested
USTEC is testing short-term trend support at all-time highs while WTI reacts around $90-$92 support.
That makes a rejection here reasonable to expect since both assets inversely correlate (when one of them goes up, the other goes down).
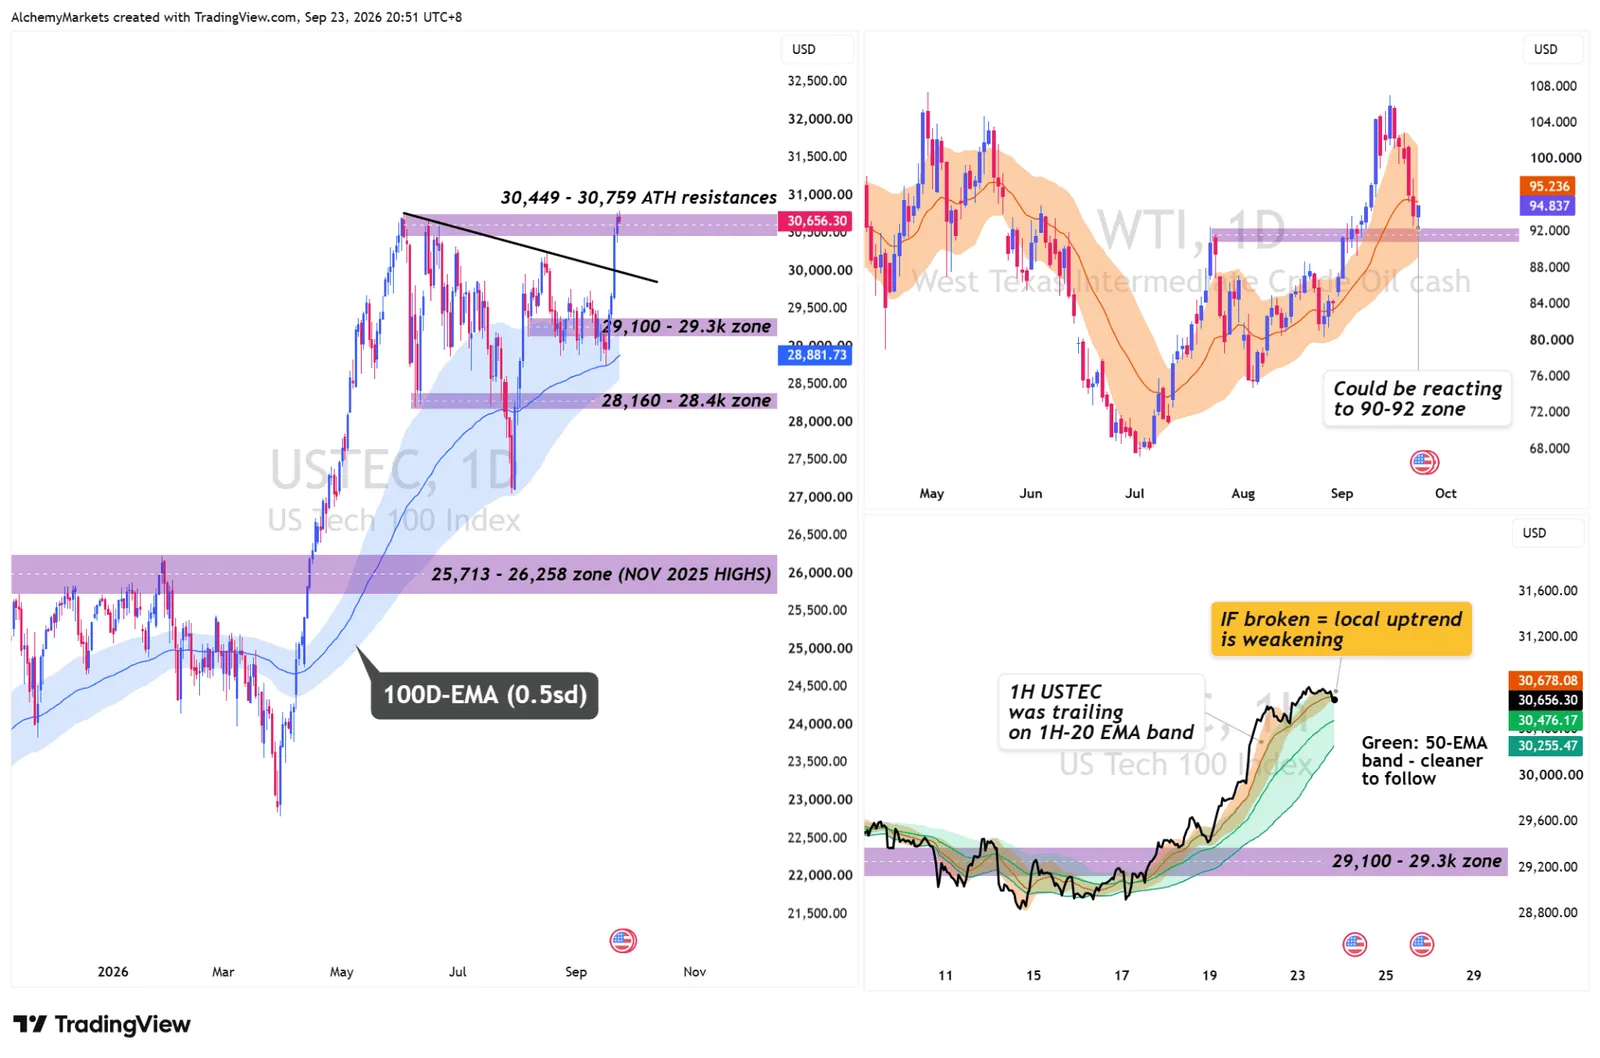
USTEC has pushed back into the 30,449-30,759 all-time-high resistance area, but the one-hour chart on the bottom right is now testing the lower edge of its 20-EMA trend.
That creates the first immediate test for the rally. If the 20-EMA bollinger bands fail, the cleaner trend to watch becomes the one-hour 50-EMA band. Note: both are set to have one standard deviation.
Around 30,255 is the lowest point I would want USTEC to hold to preserve the local bullish structure.
That brings us to another risk… the index is holding up better than the market underneath it. While weak breadth does not end the rally by itself, it also means fewer stocks are carrying more of the load.
If USTEC loses its 50-EMA structure while participation stays weak, the pullback becomes...