

The U.S. 2-year Treasury yield has just printed a violent -10.11% rejection candle on the 1-hour timeframe.
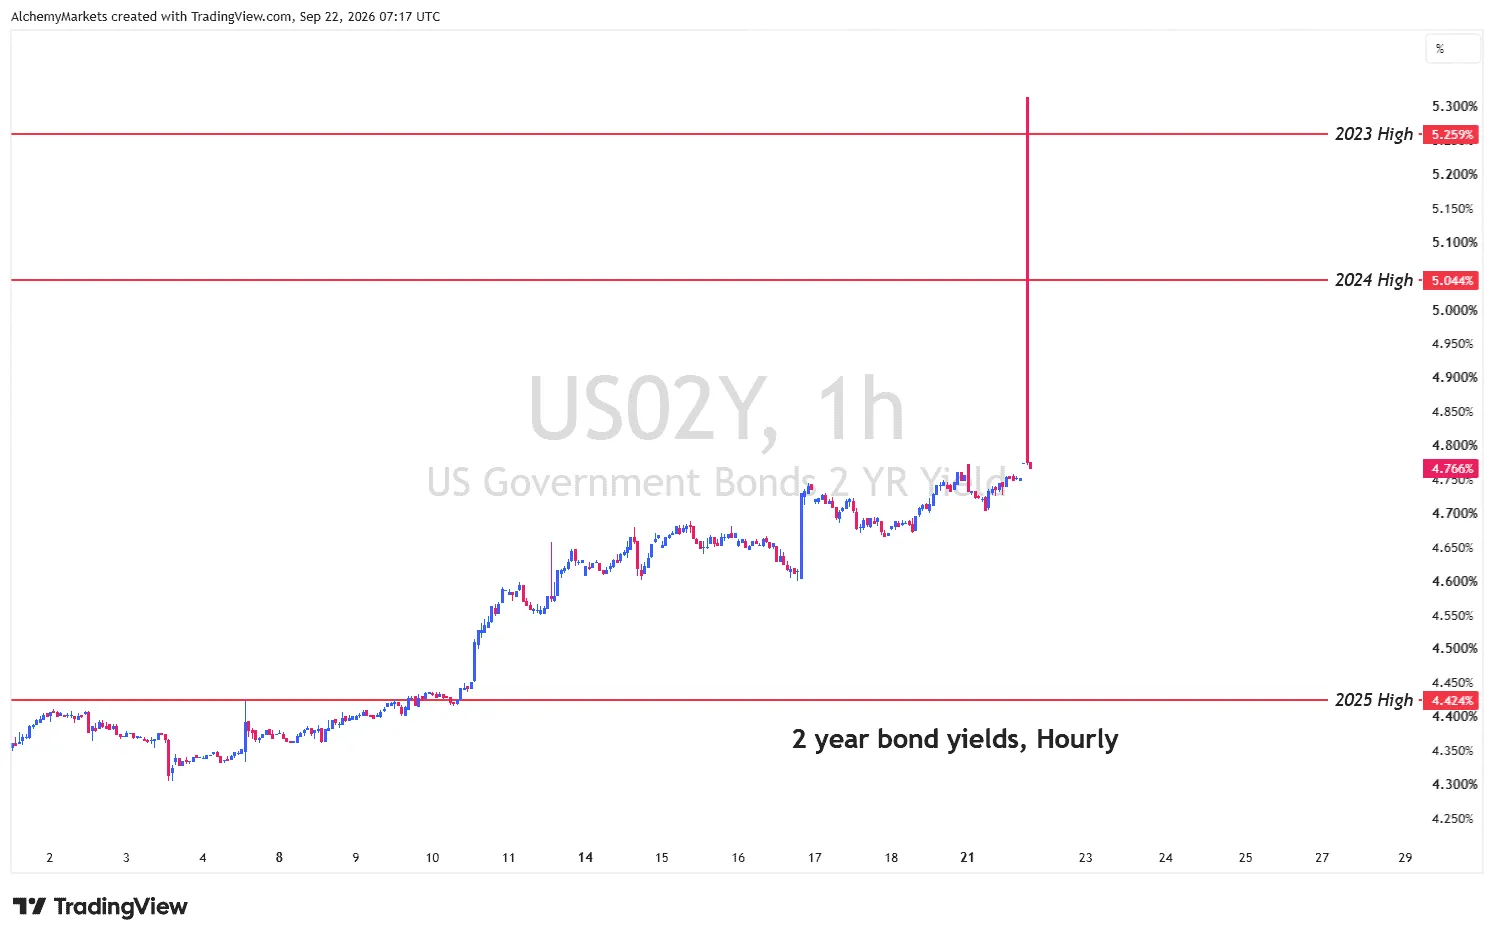
The move pushed into the psychological 5% area, then snapped back. If that rejection survives the session, the daily candle will look even more dramatic.
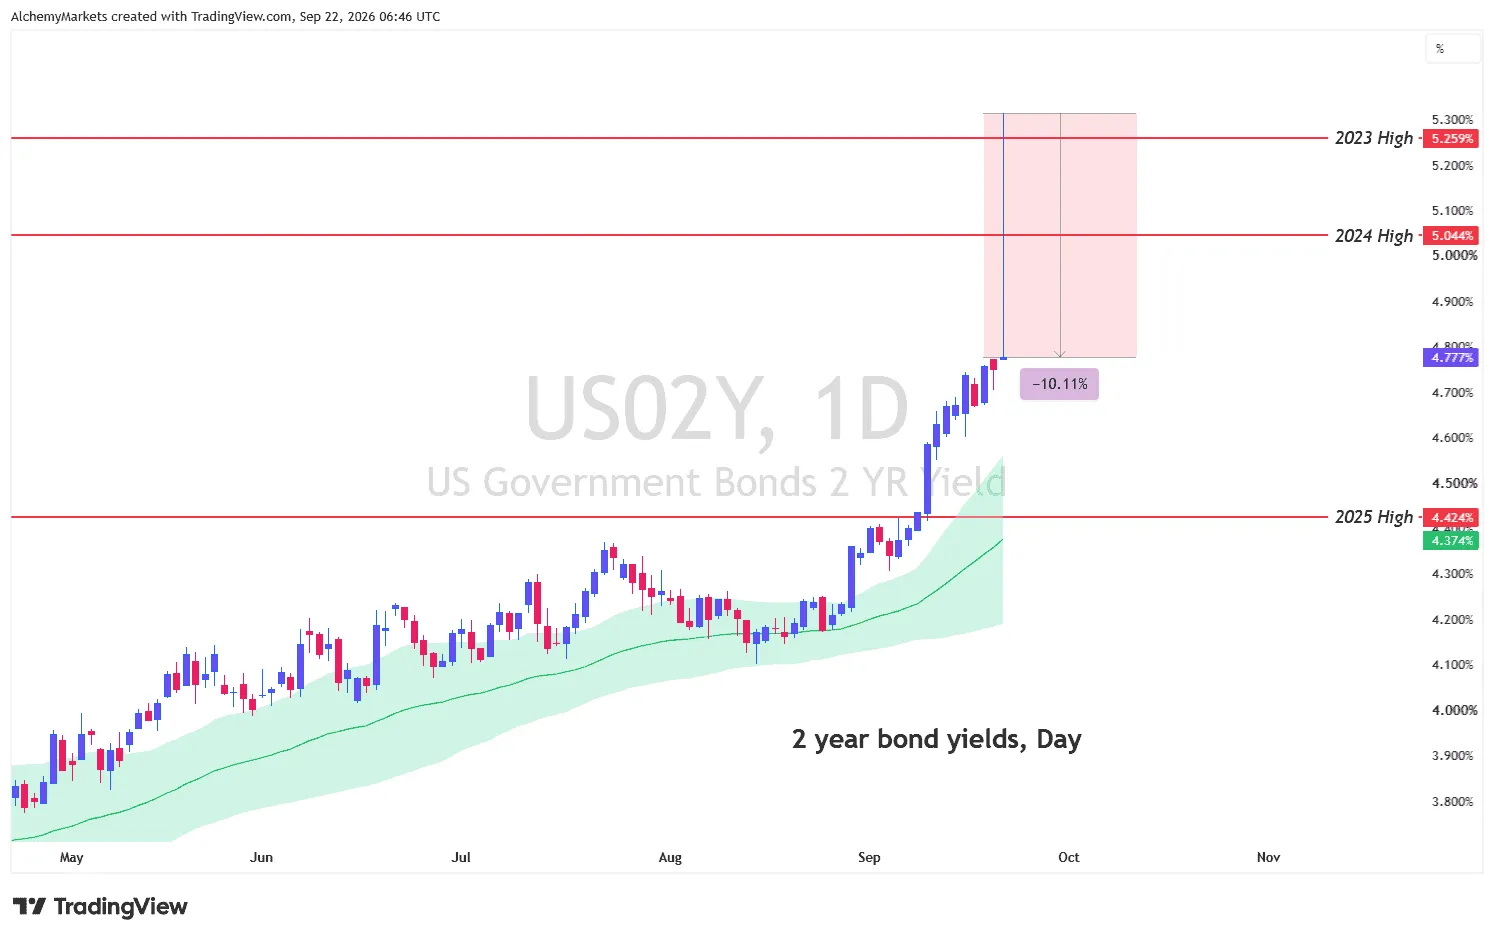
One explanation is simply price. Short-term Treasuries have spent months getting cheaper while the income on offer became much more attractive.
Bond funds were already seeing strong inflows, so another sharp jump in front-end yields gave buyers a better entry rather than a fresh reason to panic.
The question is whether they keep buying.
Why did macro conditions shift so quickly?
The rejection at 5% did not come out of nowhere. Hopes for easier oil conditions had been building, but they were overshadowed by a Fed still signalling more tightening ahead.
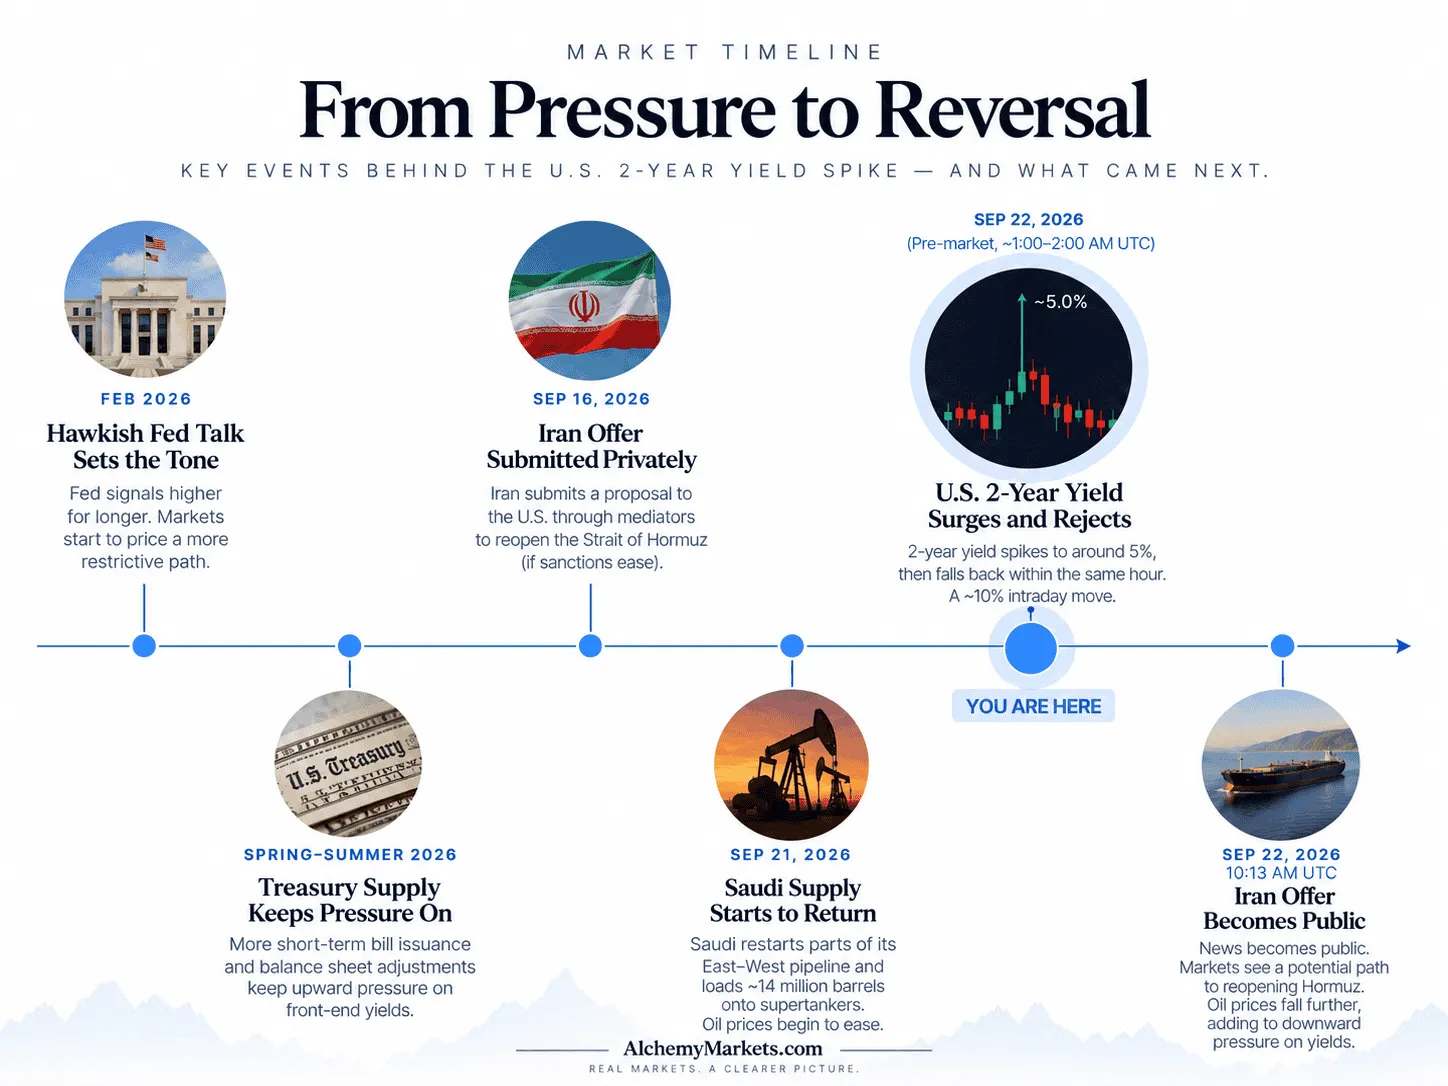
Warsh had already laid out a hawkish case at Jackson Hole and followed through with the September hike. Short-term yields kept climbing.
By 20 September, the oil story was starting to turn. Saudi Aramco loaded roughly 14 million barrels of crude onto seven supertankers as more exports were redirected through Gulf terminals. Brent slipped back towards $100 as traders saw more supply returning.
Iran added another potential source of relief. Tehran had already submitted a proposal to reopen the Strait of Hormuz through mediators on 16 September, although the wider market only learned about it later.
The public Iran headline did not cause the original 2-year rejection. The wick was already there. A possible reopening of Hormuz gives oil another reason to cool, taking some pressure off the inflation trade that helped push yields higher in the first place.
One candle does not end the higher-rate regime. It does show that the market was willing to buy bonds aggressively at the top of the move.
The spread gives us the cleaner gold signal
The 2-year yield on its own only tells part of the story. The US02Y–US30Y spread shows whether the Fed-sensitive front end is tightening faster than the long end.
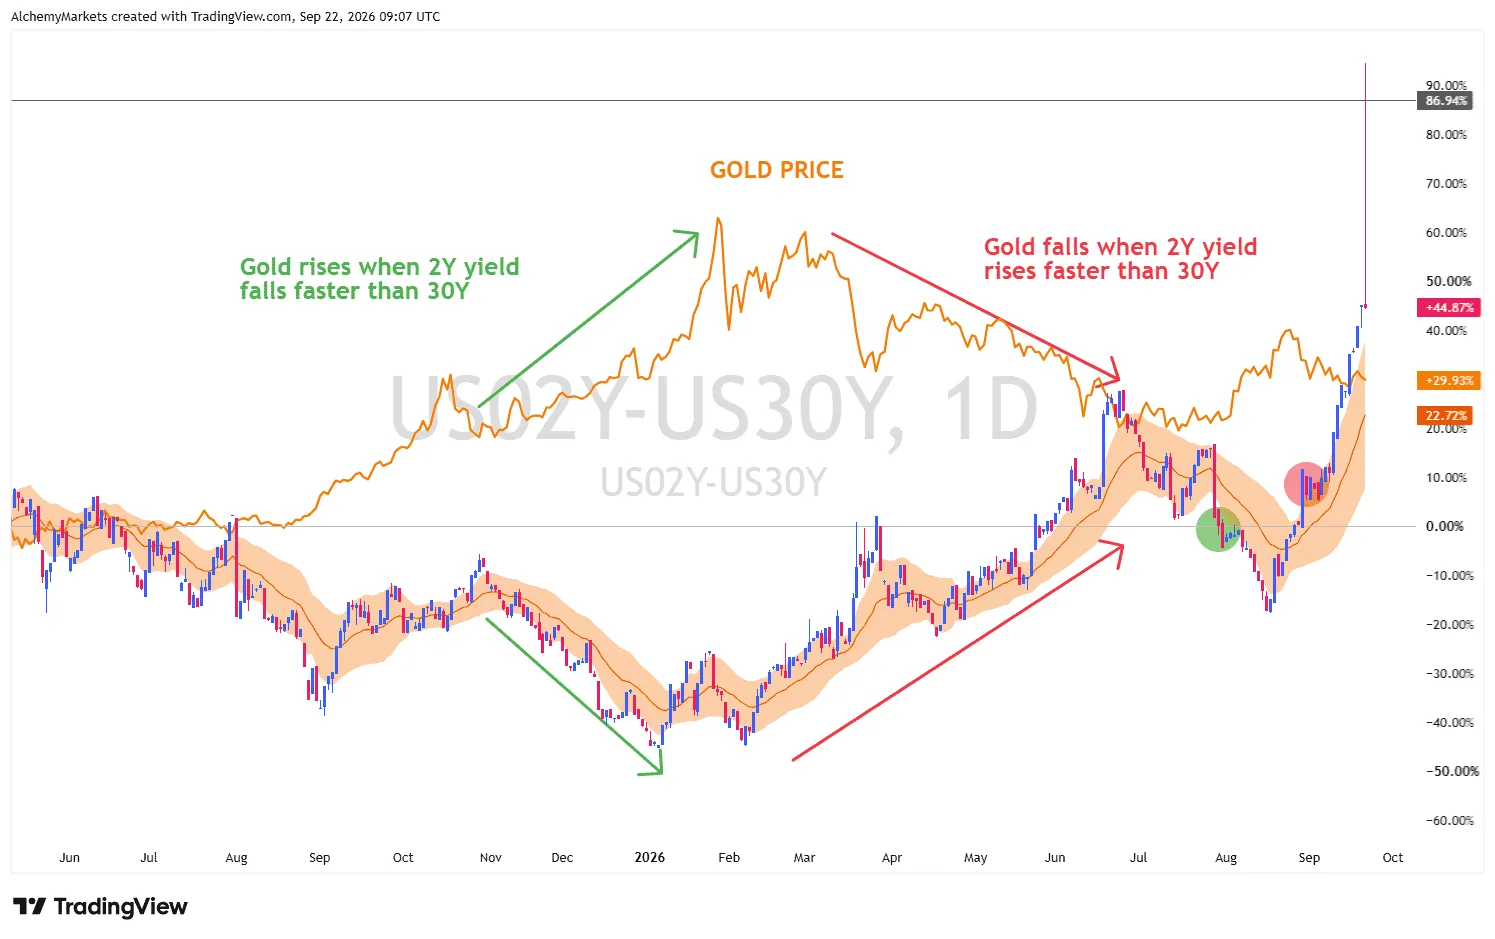
When the 2-year rises faster than the 30-year, the spread climbs and gold has tended to struggle. When that relationship rolls over, conditions have been much friendlier for gold.
The latest upper wick is even more obvious on the spread chart. It is an early warning, not confirmation. The spread is still above...