just now


Liquidity Finder Ltd is incorporated in England and Wales, company number 10610740, registered address 167-169 Great Portland Street, Fifth Floor, London W1W 5PF, United Kingdom.
Published: just now

If you trade energy markets, you are already aware that traditional inventory reports capture only a fraction of the market narrative. Weekly updates from the American Petroleum Institute ( API) and U.S. Energy Information Administration (EIA) are purely reactive they simply show you what has already been pumped, moved, and safely stored away.
If you want to position yourself ahead of the curve in WTI or West Texas Intermediate trading, you need proactive data. That is where the Baker Hughes Rig Count comes in.
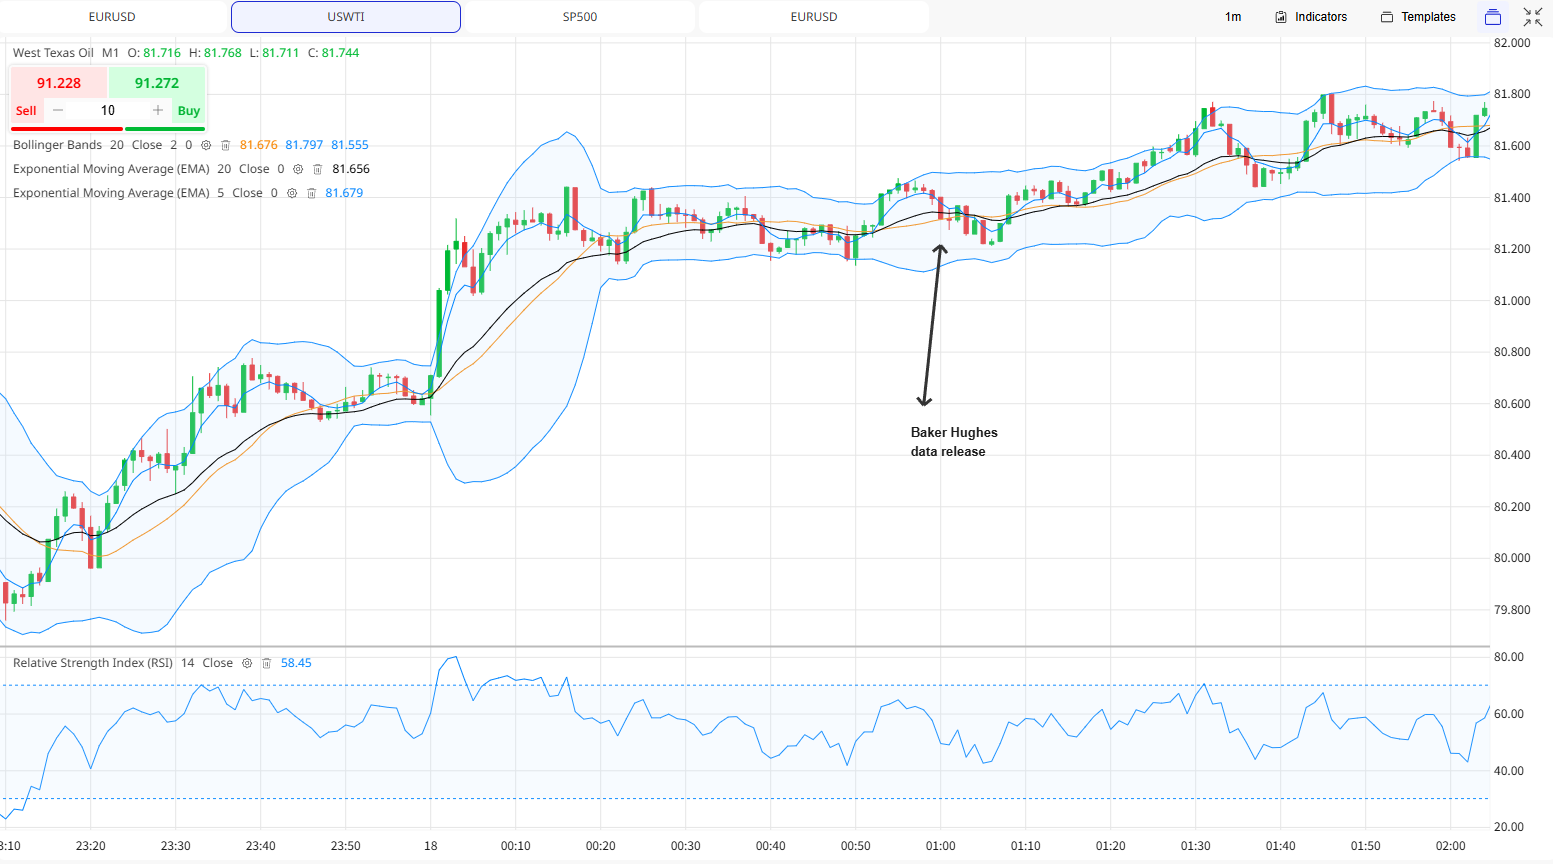
Example below 1-minute chart of West Texas Intermediate or WTI during the release of the Baker Hughes data in July 18 2026.
Source: ACY
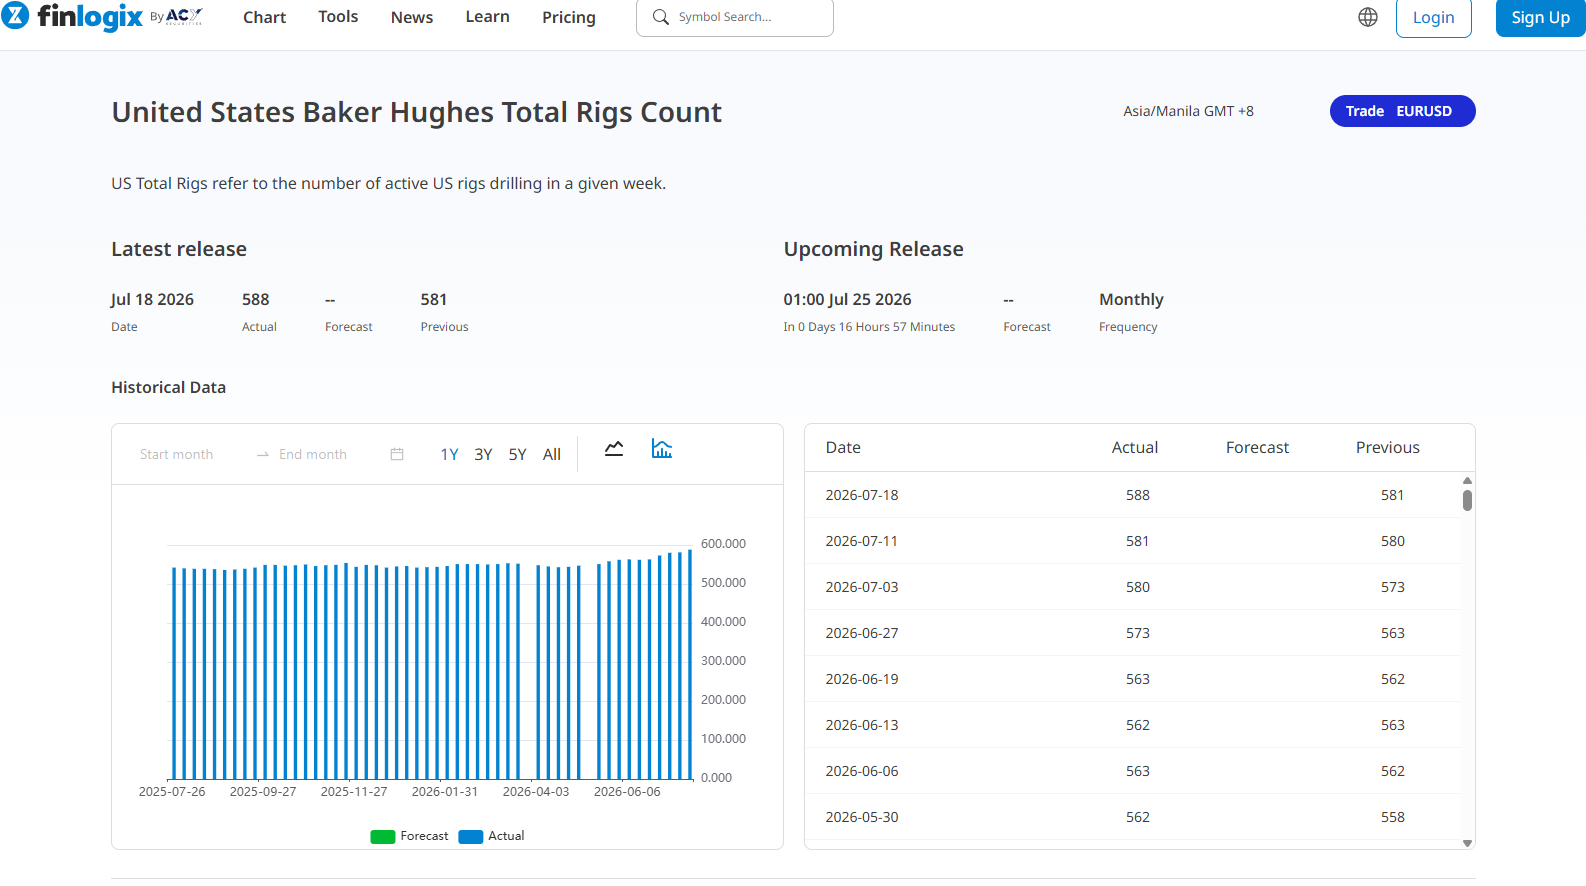
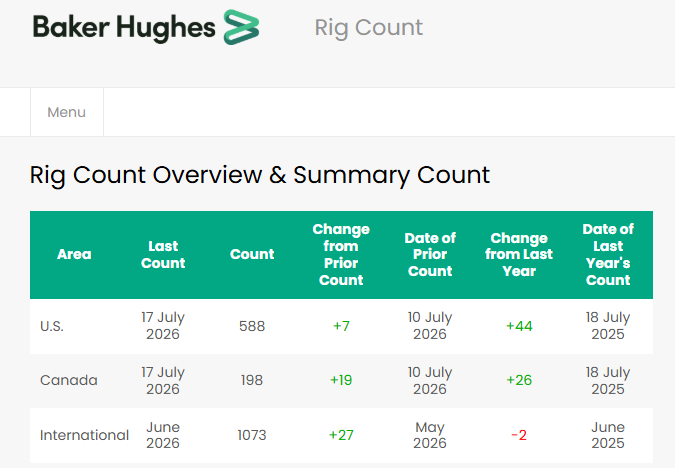
Dropping every Friday at noon Central Time (1:00 PM Eastern), this data monitors active drilling rigs across the United States and Canada and by tracking active drilling units instead of stored barrels, traders gain a massive edge, offering a clear window into capital allocation months before physical oil ever reaches Cushing, Oklahoma.
Source: Finlogix
Source: Baker Hughes
Since 1944, this comprehensive census has monitored active energy drilling rigs throughout North America. To be officially tallied, a rotary rig must meet strict criteria:
Active Engagement: It must be on location and actively drilling from the moment the well is spudded (breaks ground) until it reaches total depth.
Exclusions: The count completely excludes machinery used strictly for non-drilling tasks like workovers, completion testing, or production. Rigs just moving into position do not count.
Baker Hughes categorizes these working machines into specific operational breakdowns to give analysts a granular view of the market:

Source: Wall Stree Journal
While standard inventory reports show supplies sitting in current storage, the rig count acts as a crucial bridge between macro energy economics and financial markets. An active site takes weeks or months to bring a well from spudding to first production, making the rig count a powerful leading indicator for future production levels and upstream capital expenditures.
EIA / API Reports or the Lagging Reality with backward-looking metrics counting crude oil or natural gas currently sitting in storage tanks.
Baker Hughes Rig Count or the Leading Indicator as this reveals true future supply capacity long before the oil ever hits the surface, forecasting upcoming expansion or contraction.
Regional details matter immensely. Because WTI physical delivery happens at Cushing, the highly prolific Permian Basin is supreme.
A steep drop in dry natural gas rigs might dramatically lower the national total, but if Permian oil rigs hold steady, overall crude supply remains incredibly strong. Knowing the difference prevents costly trading mistakes based on headline numbers alone.
Historically, domestic shale producers exhibited high elasticity, rapidly accelerating drilling activity in response to rising crude oil prices. In the contemporary market landscape, capital allocation strategies have shifted toward financial discipline, prioritizing equity distributions and corporate consolidation over production volume expansion.
This creates a powerful response lag in the market. Even when oil breaks past key technical resistance levels, the rig count might stay completely flat. Producers want free cash flow over pure production growth, keeping supply tighter for longer.
Because the numbers drop right as North American trading sessions wrap up for the week, a surprise spike or drop frequently creates instant market chaos.
Algorithmic traders immediately scrutinize the data or the report to catch sudden momentum breakouts before the weekend liquidity gap, triggering last-minute position squaring and sudden risk adjustments.
Modern drillers use longer laterals and advanced completion efficiencies, meaning they often need fewer total rigs to pump massive volumes over time. You can integrate this fundamental data directly into your technical trading framework by following a few clear steps:
Confirm the Trend: A falling rig count signals tighter supply, supporting a bullish bias.
Find Entries: Target long positions on West Texas Intermediate (WTI) retracements near the 20 EMA.
Check Momentum: Ensure the RSI is cooling off from overbought levels rather than breaking down.
Manage Risk: Use the ATR to widen stops and lower leverage, especially when liquidity drops on Friday afternoons.
Explore my portfolio for further insights:
Will WTI Break $80? Key Levels and Market Drivers
Disclaimer: This content may have been written by a third party. ACY makes no representation or warranty and assumes no liability as to the accuracy or completeness of the information provided, nor any loss arising from any investment based on a recommendation, forecast or other information supplies by any third-party. This content is information only, and does not constitute financial, investment or other advice on which you can rely.
ACY Securities is one of Australia's fastest growing multi-asset online trading providers, offering ultra-low-cost trading, rock-solid execution, technologically superior account management and premium market analysis.

Select the categories and companies you wish to follow directly to your person rss feed.
Create Custom RSS FeedSign up and join over 5,000 professional members who receive personalized news alerts, curated professional connections, and more for free!
Bybit has launched Perp Options, described as the first options contracts built on TradFi perpetuals, giving traders round-the-clock access to US equity options. SpaceX and Nvidia are the first underlying assets, with USDT settlement and integration into Bybit's Unified Trading Account.
Use this trading preparation checklist to plan your session, define entry rules, manage risk, and build a disciplined trading routine in seven steps.
Your Bourse expands its crypto liquidity ecosystem with Caladan, giving brokers access to broader market coverage, institutional execution capacity and streamlined settlement.
Scope Markets, the retail brokerage part of Rostro Group, has appointed Ibrahim Hossny as Head of Research and Marketing for the Middle East and North Africa.
Hantec Prime, the institutional division of Hantec Markets, has reported trading volume up more than 300% year-to-date, alongside the addition of 42 new institutional clients since December, capping one of its strongest years of growth to date.
Learn how to refine XAUUSD support and resistance on the daily chart using candle bodies, market structure and weekly gold levels for swing trading. A slug alone cannot guarantee a top Google ranking. Keep it focused rather than adding every supporting keyword.
The week in Dubai will be focused on connecting directly with the industry and discussing how technology can help modern brokerages simplify operations, automate workflows, strengthen operational control, and scale efficiently.
Devexperts has launched a turnkey solution giving brokers in South Korea access to US equity markets, combining its DXtrade trading platform, dxFeed market data, and execution services. The offering targets South Korea's growing retail demand for US stocks, worth several billion USD monthly.
Assess why WTI crude oil surged past $105 per barrel amid Saudi pipeline disruptions, record tanker charter rates, and escalating geopolitical tensions.
Bitcoin price forecast: BTC/USD retests $78,460–$80,215 resistance. Watch bearish confirmation toward $72,480 or a bullish breakout toward $86,150.