just now

Liquidity Finder Ltd is incorporated in England and Wales, company number 10610740, registered address 167-169 Great Portland Street, Fifth Floor, London W1W 5PF, United Kingdom.
Published: just now

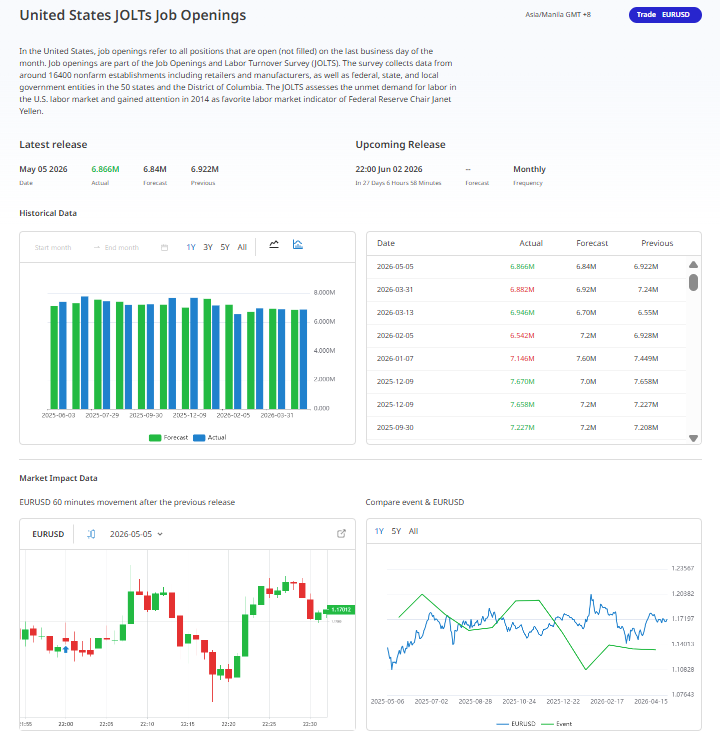
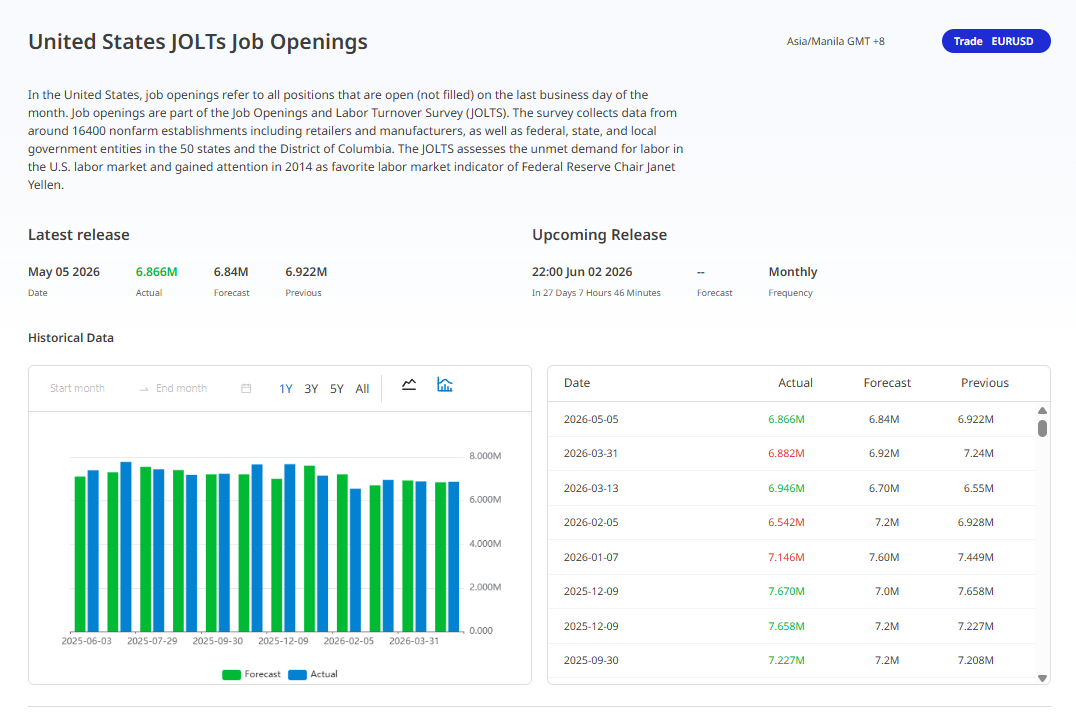
JOLTS or JOB OPENINGS AND LABOR TURNOVER SURVEY
This essential survey known as the Job Openings and Labor Turnover Survey, it acts as microscope for the whole economy. It helps us understand exactly what is happening with employment across the country.
Financial experts and everyday investors pay close attention to this high-impact economic indicator because it tells the underlying health of our modern workforce.
The main job of the JOLTS data report is to indicate the tightness of the U.S. labor market. A competitive market simply means there are plenty of open jobs, but there are not enough available workers to fill them. When businesses struggle to find help, they usually must pay their employees more money to get them through the door.
Why Does the Federal Reserve Care About Interest Rate Expectations?
The Federal Reserve uses this exact data to make huge choices about our money. Because they want to stop inflation from getting out of hand, they monitor the job openings closely. If the job market stays hot, they step in.
Ultimately, this data directly shifts our interest rate expectations for the near future. If job openings are soaring rapidly, the Fed might hike interest rates to quickly slow down consumer spending. Lower job numbers tell a different story entirely, often leading to interest rate cuts. The market reacts instantly.
JOLTS Job Openings Data: How It Moves Markets
When the numbers are stronger than expected, we see a tight labor market where demand wildly outpaces supply. This shortage drive companies to pay higher wages as this extra cash supports inflation, forcing the Federal Reserve to keep interest rates high or raise them even further.
On the flip side, weaker-than-expected figures paint a very different picture for our economy. They signal a cooling trend. With lower inflationary pressure, the market starts betting heavily on the likelihood of future rate cuts. Rates might finally drop.
What is the best way to trade JOLTS job openings data for currencies and bonds?
Let's look at how foreign exchange pairs react to this release. A strong report typically fuels the U.S. Dollar. Because rate hike expectations rise, the mighty dollar becomes much more attractive to yield-seeking investors looking for safe returns. Demand shoots straight up
This dollar strength causes unique ripples across major global currency pairs. Watch the charts closely. Understanding how specific pairs usually move requires careful attention to the data:
Dollar Strength: How It Moves Major Currency Pairs
Example below how the EURUSD reacted in the 60-minutes chart
USD strength: Why Forex Pairs Climb and Drop
How Does USD Strength Affect Base Currency Pairs?
In pairs like USD/JPY and USD/CHF, the US Dollar acts as the base currency. It is the first money listed. When positive economic reports beat expectations, the dollar immediately gets much stronger compared to the Yen or Franc. Prices push upward.
You might wonder why this upward climb happens so incredibly fast. Because the American money is gaining power, it requires a larger amount of the foreign money to buy just one single dollar. The chart climbs.
Why Do Quote Currency Pairs Drop During US Dollar Strength?
Things work completely backwards for pairs like EUR/USD and GBP/USD. When looking at these major pairs, you will quickly notice that the dollar acts as the quote currency. This simply means it sits in the second position. When the greenback flexes its muscle, relative dollar dominance takes total control of the action. Because the US Dollar is getting so much stronger, it takes far fewer dollars to purchase one Euro or Pound. Prices drop rapidly.
Efficient method to track these relative price shifts
Tracking the exact relationship between the data and the currency pair is important for your long-term success. You must remember that relative strength dictates the trend. If the dollar powers forward, the base pairs rise while the quote pairs sink.
In the fixed-income world, strong openings numbers usually trigger a massive sell-off in U.S. Treasuries. Bonds lose their appeal. Consequently, treasury yields for the 2-year and 10-year notes spike dramatically as markets price in a higher-for-longer interest rate environment. Yields simply take off.
Why do stocks and commodities drop when the labor market is strong?
You might think good job numbers would help the stock market. That is false. Major stock indices like the S&P 500 and Nasdaq 100 react negatively to robust labor statistics in our current climate. High costs crush them.
High job openings mean steeper labor costs, which quickly squeeze corporate profit margins. Tech stocks suffer the most. Because the tech sector acts as a long-duration asset, these growth stocks are incredibly sensitive to the rising yields that strong data triggers. Their future earnings shrink.
Finally, we must examine how raw materials handle these sudden market shifts. Gold (XAU/USD) usually falls. Because a booming labor market boosts the dollar and treasury yields, non-yielding gold becomes significantly less attractive to eager investors. Prices inevitably break down.
Crude Oil (WTI) acts as a total wildcard during these major economic events. It is highly unpredictable. A strong labor market points to high energy demand, but a surging dollar places heavy downward pressure on oil prices since oil is priced in dollars. Traders must stay alert.
JOLTS Hidden Metrics: What Analysts Really Watch
The main headline is rarely enough. Analysts dig deep. To understand our true economy, you must carefully study the JOLTS hidden metrics. Numbers tell stories.
Markets look far beyond the basic job openings headline. They track the quits rate instead. This vital metric acts as a brilliant measure of overall worker confidence right. Workers feel bold.
If this specific rate is high, it means people feel incredibly safe. They are leaving their positions for jobs that pay much better. Experts view this exact behavior as a powerful leading indicator for future wage inflation. Paychecks go up.
Why Do We Monitor the Openings-to-Unemployed Ratio?
Another number is the openings-to-unemployed ratio. This metric happens to be a massive favorite of the Federal Reserve. When this ratio goes significantly above 1.0, it clearly highlights a dangerous economic imbalance. The Federal Reserve notices.
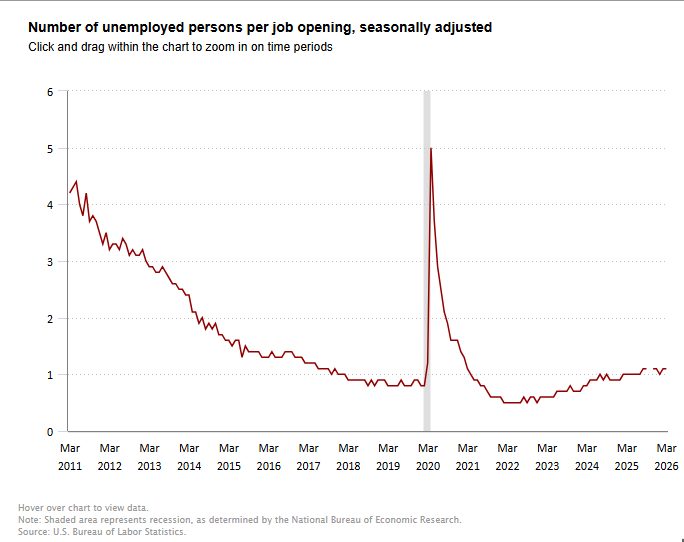
An imbalanced market forces the central bank to step in. They might try to cool the overheated economy down through a much tighter monetary. Market sensitivity to these details grows as investors actively look for financial safety. Money moves fast.
JOLTS Trading: How to Trade the Job Openings Report
the headline Job Openings number, which acts as a clear, direct signal of labor market heat. When this specific report goes live, it instantly guides your next market move. It shows exactly what the market expects next.
You do not need to overcomplicate your strategy when reading the employment release. Your main goal is figuring out the primary trend quickly. By focusing only on the main headline, you gain an advantage over distracted traders. Trade the primary trend.
How Does JOLTS Trading Work With Federal Reserve Hawkishness?
People constantly get distracted by minor details in the report.
Treating the data as a simple Yes/No gauge for Federal Reserve hawkishness, you can filter out the extra noise quickly. Watch the trend closely.
If the actual data reported is significantly higher than the forecast, things shift fast.
his specific outcome heavily boosts the US Dollar. At the same time, it puts massive pressure on Gold and Equities across the board. Do not fight this momentum.
What Happens When the Job Openings Number is Low?
Sometimes, the data comes in much lower than anyone expected. A lower number suggests a cooling economy, opening the door for possible rate cuts. This lower reading often triggers a massive relief rally in stocks and a dip in the Dollar. Prepare for sudden moves.
Which Assets Are Best for JOLTS Trading?
You need to pick the right markets to trade the primary trend effectively. Avoid over-analyzing every single sub-metric inside the release. Instead, prioritize the USD/JPY or the S&P 500 because they provide the cleanest technical reactions immediately after the numbers hit. Pick your targets wisely.
JOLTS Data Market Impact: How the Report Moves Assets
The JOLTS data market impact is always a massive event. Investors hold their breath waiting for these numbers, knowing that a single release can flip the entire trading week completely upside down in an instant. It changes everything fast. Reaction is incredibly quick. Traders do not just sit around and wait for instructions. They buy and sell instantly, shifting billions of dollars across the globe the second those job opening numbers hit the news wires. They move fast.
How Does the JOLTS Data Market Impact U.S. Treasury yields?
Everything starts with bonds. The data first shows up as a sudden spike or a deep drop in U.S. Treasury yields. Think of these yields as the master switch for all other asset movements in the global economy. They control the flow.
Once the yields shift, that energy flows straight into the currency market. Because the dollar changes its price based on interest rate hopes, USD/JPY movements normally happen in a direct, vertical line. This sudden price change shocks the entire trading system. It moves so fast.
Why Strong Job Numbers Has Negative Impact on the Market?
At the exact same time, major stock indices like the S&P 500 react in the exact opposite way. Strong job numbers scare the stock market. This fear sets in fast.
Investors worry that great jobs data means sticky inflation, which leads to much higher borrowing costs for big companies. This intense fear causes stocks to quickly gap lower. They drop like rocks.
How Do Gold and Commodities React to the Master Switch?
Commodities also feel the heat. The numbers force these hard assets to completely break out or break down at major technical levels on the trading charts. For example, Gold will quickly lose ground if climbing yields make non-yielding assets look bad to eager buyers. The shiny metal fades.
What Determines the Market Regime Shift for the Week?
When the dust finally settles, the report completely changes the mood of the market. This creates a clear regime shift. The final closing prices of the day tell us exactly what investors plan to do next. They reveal everything.
Traders use this information to decide if they need to play defense, or if they should take a highly aggressive risk-on posture for the rest of the week. The JOLTS data market impact guides all these final choices. The close tells all.
Strong JOLTS data currently stimulate a market paradox where strong job openings fuel inflation fears, driving bond yields and the US Dollar higher while forcing stocks and gold to drop.
Disclaimer: This content may have been written by a third party. ACY makes no representation or warranty and assumes no liability as to the accuracy or completeness of the information provided, nor any loss arising from any investment based on a recommendation, forecast or other information supplies by any third-party. This content is information only, and does not constitute financial, investment or other advice on which you can rely.
ACY Securities is one of Australia's fastest growing multi-asset online trading providers, offering ultra-low-cost trading, rock-solid execution, technologically superior account management and premium market analysis.
Select the categories and companies you wish to follow directly to your person rss feed.
Create Custom RSS Feed
just now
Sign up and join over 5,000 professional members who receive personalized news alerts, curated professional connections, and more for free!
Gold Price Action Forecast: Will XAU/USD Drop to $3930? Meta Description: Read our Gold price action forecast to see if XAU/USD will drop to $3930.
BitDelta Securities Financial Services LLC (“BitDelta Securities”) today announced that it has received full regulatory approval from the Capital Market Authority (“CMA”) of the United Arab Emirates under the Category 5 — Arrangement and Advice license framework (License No. 20200000439). The approval follows the firm's receipt of In-Principal Approval earlier this year and represents the successful conclusion of the CMA's full licensing process, including the satisfaction of capital requirements, governance appointments, and operational setup.
Crypto.com has received a $400 million strategic investment from Citadel Securities, valuing the firm at $20 billion. It marks the first institutional funding round in the company's history, aimed at accelerating its expansion into tokenised securities, derivatives and other asset classes.
WTI’s pullback into $79–82 is the first major test of the bullish Elliott Wave count, with buyers targeting a renewed break above $85.

BitDelta Securities has secured a full CMA Category 5 licence in the UAE and opened a regulated office in Business Bay, Dubai. The firm operates as an introducing broker, connecting investors with licensed international brokers across multiple asset classes, with CEO Dr. Demetrios Zamboglou commenting on the milestone.
Index volatility is asleep while single stocks fight it out underneath, credit refuses to confirm the equity rally, and a bare macro calendar hands next week to oil.
Digital assets and FX brokerage GC Exchange FZE (GCEX) has appointed Mohammed A. Mulla as a Board Member of its Dubai-based entity, part of the wider GCEX Group.
Learn what Blockchain-as-a-Service is, how it works, and why businesses are using BaaS to build blockchain applications without managing infrastructure.
CFDs vs stocks compared on leverage, ownership, costs, dividends, taxes, and risk. Learn the differences between stocks and CFDs and discover which suits your investing or trading goals.
Want to master the markets? A winning trading mindset beats a perfect strategy. Learn how emotional discipline helps you conquer fear and avoid heavy losses.