just now

Liquidity Finder Ltd is incorporated in England and Wales, company number 10610740, registered address 167-169 Great Portland Street, Fifth Floor, London W1W 5PF, United Kingdom.
Published: just now

The Industrial Production as defined.
For authoritative data on the United States Industrial Production and Capacity Utilization index, we refer to the Federal Reserve’s G.17 report below as a main source.
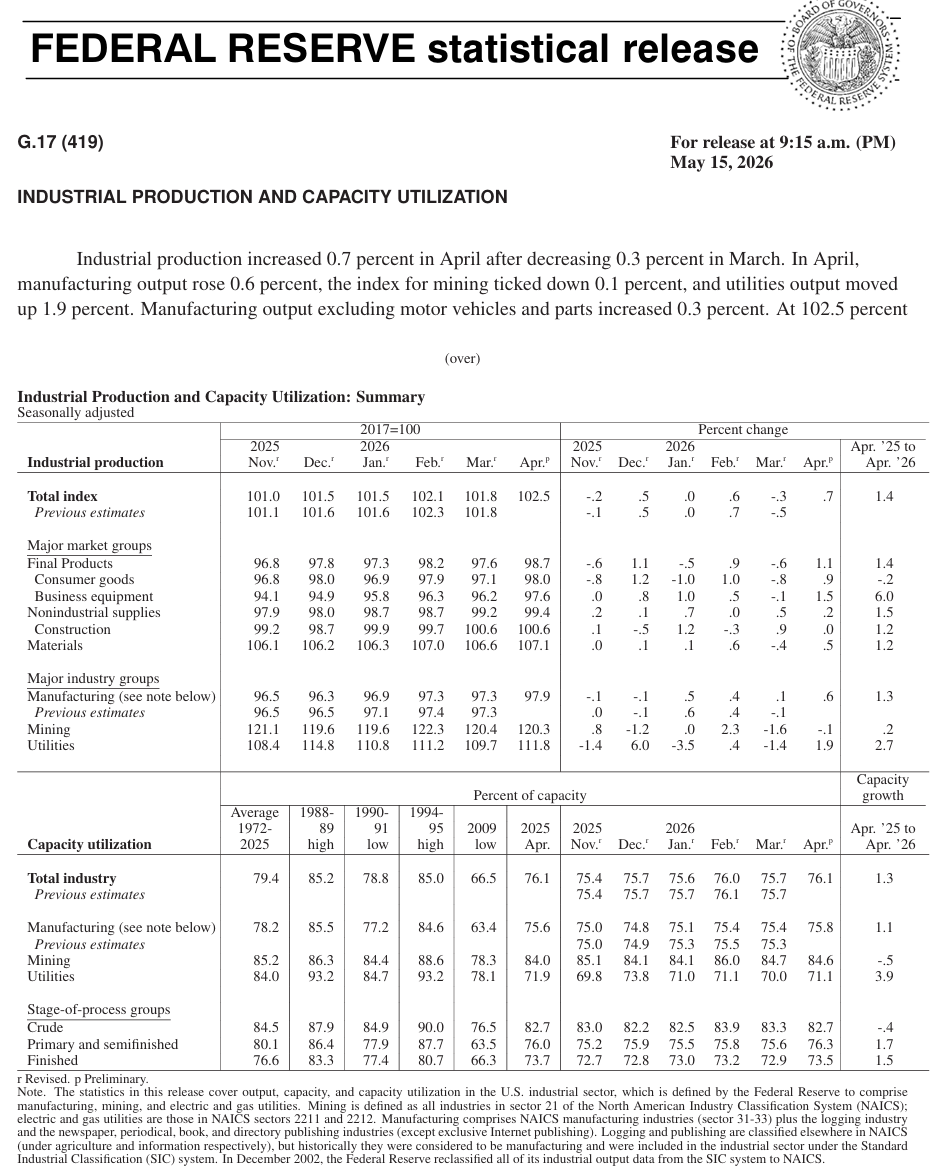
Source: Federal Reserve Bank of St. Louis
What makes this the gold standard for economists?
This distinct indicator monitors the factual output from real-world businesses across the country. Professionals use it to evaluate the total status of the U.S. economy.
Published by the Federal Reserve, this important index gives us a clear picture of what is being made right now.
Tracking these numbers helps us understand where the market might be heading today. It removes the guesswork.
What exactly does the Industrial Production Index measure?
When economists look at this report, they focus on three specific areas of output. I noticed that it ignores other parts of the market to purely track raw industrial production. It measures the core physical goods produced in the United States.
With the U.S. Manufacturing Sector as this monitor the output of goods made in factories.
With Mining Sector as this tracks the volume of commodities and raw materials sourced through extraction or natural resources.
With the Utility Sector as this covers the power and water we use every day.
Economists rely on this precise data to easily gauge our overall economic health on a regular basis. Investors use the final report to make smarter choices. Numbers do not lie.
How can a key economic indicator support the investors assessment on the economy?
Knowing the output of these sectors tells us if the economy is growing. A rising index means that our factories and mines are very busy producing goods. A falling report tells us things are slowing down. This signals trouble fast.
Production Output: How to Measure Industry Capacity
By using the Fisher-ideal index to combine different types of data such as steel output, energy use, and labor hours into one clear production score. It is called ideal because it uses a specific mathematical method to cancel out errors that often appear in simpler formulas.
What is the Fisher-ideal formula index?
The index removes the skewing effects of absolute dollar values by benchmarking performance against the 2017 standard.
Fisher-Ideal Formula Index: How It Works?
When looking at economic numbers, it helps to understand exactly how the information is formed. Concentrating on the core mechanics makes the entire process much easier to grasp or digest. This method uses a Fisher-ideal formula index. It changes how we view trends. By shifting away from absolute dollar amounts, we get a clearer picture of real market movement over time. We actually take a peek at things relevant to a set starting point and that makes a huge difference. You will find out why this specific analytic tool is so incredibly useful for understanding business.
How does aggregating industry data work?
The system accumulates such detailed information across various business areas to create a comprehensive picture. It monitors from the heavy commodities like steel to everyday consumer items like paper products. By aggregating this diverse data, the index blends these varying sectors into a single, cohesive metric.
Combining information from steel to carpet and rugs requires special math. The process demands accuracy, to ensure the results are reliable, the system creates the Fisher-ideal index to balance the numbers.
The Industrial Production Index vs. Gross Domestic Product- Unlike Gross Domestic Product (GDP), which measures the final price paid by consumers (including retail value), the IPI’s focal is solely on the industrial output.
This index provides an evaluation of an economy incorporating the capacity utilization rate is an important signal for decision-making.
For the Low-capacity utilization, this tells there’s a weak in demand and overcapacity, which may indicate an impending economic downturn or prompt policymakers to introduce fiscal or monetary stimulus.
Despite the industrial sector’s smaller share of total GDP compared to services, the index remains a key cyclical indicator, its volatility often precedes broader macroeconomic trends, providing essential intelligence for forecasting inflation and economic turning points.
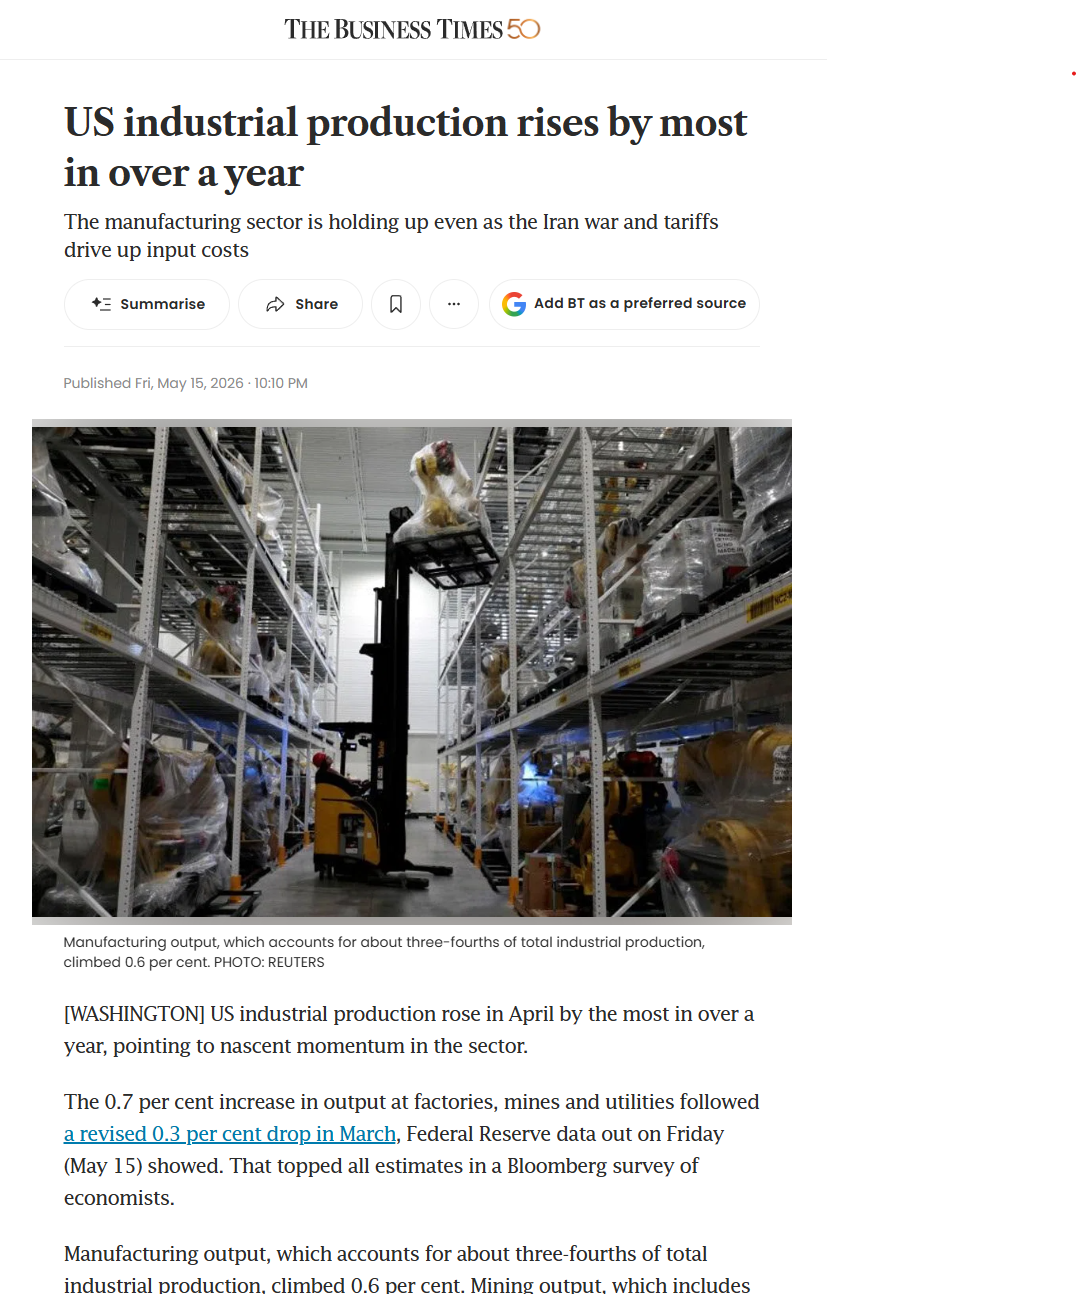
Source: The Business Times
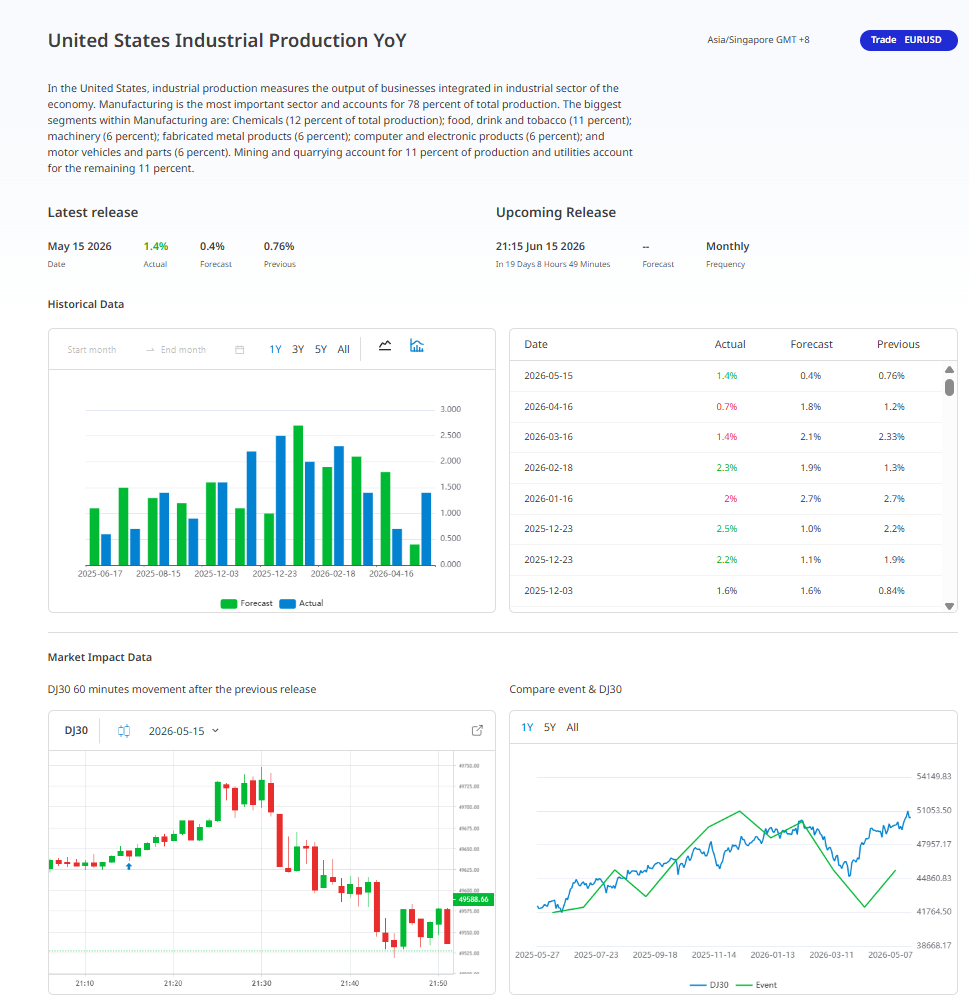
This illustration tells the U.S. Industrial Production Index (IPI) the pulse of American factories, mines, and utilities and how it influences the stock market specifically the Dow Jones Industrial Average, or DJ30.
Blue Bars as the Actual. The real economic output released by the Federal Reserve.
Green Bars as the Forecast. The prediction made by analysts beforehand.
When the Blue bar is higher than the Green bar, this tells that the economy is performing better than expected. On May 15, 2026, the Actual at 1.4% beat the Forecast at 0.4% by a significant margin. This beat is usually a positive signal for the economy.
The charts as candlesticks with red and green colors, each represents the price movement of the DJ30 or Dow Jones index.
Even though the IPI data was better than expected, still the DJ30 declined within that hour.
This tells that markets do not always react in a straight line. There are instances that even positive economic news can also trigger a sell-the-news reaction if investors were already expecting strong numbers or if they are in doubts that a strong industrial growth might result that the Federal Reserve may keep interest rates higher for longer.
With Blue Line-the steady, generally upward climb of the stock market.
With Green Line-the ups and downs of industrial production output.
The stock market is forward-looking (it bets on the future), whereas the IPI is a coincident indicator (it tells us what is happening right now). This chart helps investors see if the stock market’s growth is being supported by actual physical production or if the two are drifting apart.
And because the Industrial Product Index monitors tangible output rather than estimates or surveys, it is considered a gold-standard hard data indicator. Data is filtered through sentiment, not just statistics. The candlestick charts prove that investors weigh production numbers against existing market trends rather than responding to the raw data alone.
The Influence of Strait of Hormuz Disruptions on U.S. Industrial Activity

Source: United Nations
When we look at the latest G.17 report, the impact of the Strait of Hormuz closure isn't immediate, but it is systemic. It's rippling through our domestic industrial base in six key ways.
The G.17 report serves as a core barometer for U.S. industrial resilience as it measures our domestic ability to maintain output in the face of persistent, global supply-side constraints caused by the closure of the Strait of Hormuz.
Disclaimer: This content may have been written by a third party. ACY makes no representation or warranty and assumes no liability as to the accuracy or completeness of the information provided, nor any loss arising from any investment based on a recommendation, forecast or other information supplies by any third-party. This content is information only, and does not constitute financial, investment or other advice on which you can rely.
ACY Securities is one of Australia's fastest growing multi-asset online trading providers, offering ultra-low-cost trading, rock-solid execution, technologically superior account management and premium market analysis.
Select the categories and companies you wish to follow directly to your person rss feed.
Create Custom RSS FeedSign up and join over 5,000 professional members who receive personalized news alerts, curated professional connections, and more for free!
Gold Price Action Forecast: Will XAU/USD Drop to $3930? Meta Description: Read our Gold price action forecast to see if XAU/USD will drop to $3930.
BitDelta Securities Financial Services LLC (“BitDelta Securities”) today announced that it has received full regulatory approval from the Capital Market Authority (“CMA”) of the United Arab Emirates under the Category 5 — Arrangement and Advice license framework (License No. 20200000439). The approval follows the firm's receipt of In-Principal Approval earlier this year and represents the successful conclusion of the CMA's full licensing process, including the satisfaction of capital requirements, governance appointments, and operational setup.
Crypto.com has received a $400 million strategic investment from Citadel Securities, valuing the firm at $20 billion. It marks the first institutional funding round in the company's history, aimed at accelerating its expansion into tokenised securities, derivatives and other asset classes.
WTI’s pullback into $79–82 is the first major test of the bullish Elliott Wave count, with buyers targeting a renewed break above $85.

BitDelta Securities has secured a full CMA Category 5 licence in the UAE and opened a regulated office in Business Bay, Dubai. The firm operates as an introducing broker, connecting investors with licensed international brokers across multiple asset classes, with CEO Dr. Demetrios Zamboglou commenting on the milestone.
Index volatility is asleep while single stocks fight it out underneath, credit refuses to confirm the equity rally, and a bare macro calendar hands next week to oil.
Digital assets and FX brokerage GC Exchange FZE (GCEX) has appointed Mohammed A. Mulla as a Board Member of its Dubai-based entity, part of the wider GCEX Group.
Learn what Blockchain-as-a-Service is, how it works, and why businesses are using BaaS to build blockchain applications without managing infrastructure.
CFDs vs stocks compared on leverage, ownership, costs, dividends, taxes, and risk. Learn the differences between stocks and CFDs and discover which suits your investing or trading goals.
Want to master the markets? A winning trading mindset beats a perfect strategy. Learn how emotional discipline helps you conquer fear and avoid heavy losses.


