just now

Liquidity Finder Ltd is incorporated in England and Wales, company number 10610740, registered address 167-169 Great Portland Street, Fifth Floor, London W1W 5PF, United Kingdom.
Published: just now
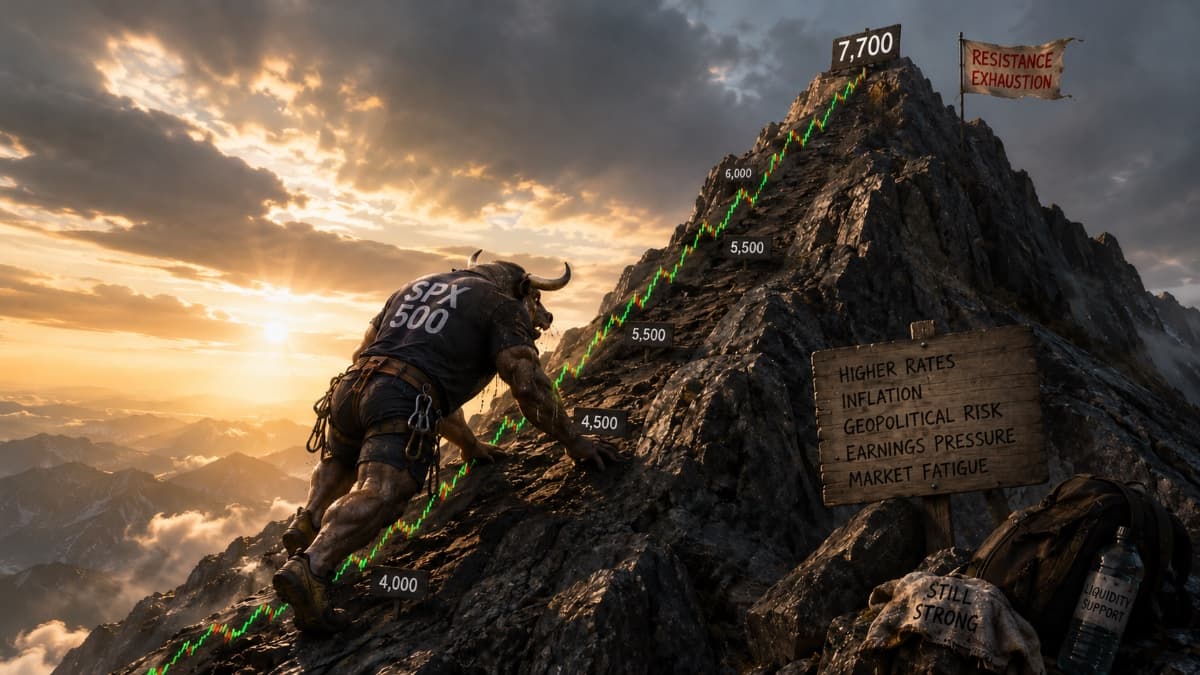
Wall Street has rolled into June the way it left May — at record highs and refusing to flinch. The S&P 500 trades around 7,580 this morning, the Nasdaq just notched its best month of the year (up more than 8% in May), and the mood is unmistakably risk-on. The 60-day US–Iran ceasefire memorandum took the geopolitical knife off the table, oil cratered nearly 17% on the month, and the path of least resistance has been straight up.
But the chart suggests there may still be road left before the index gets there.
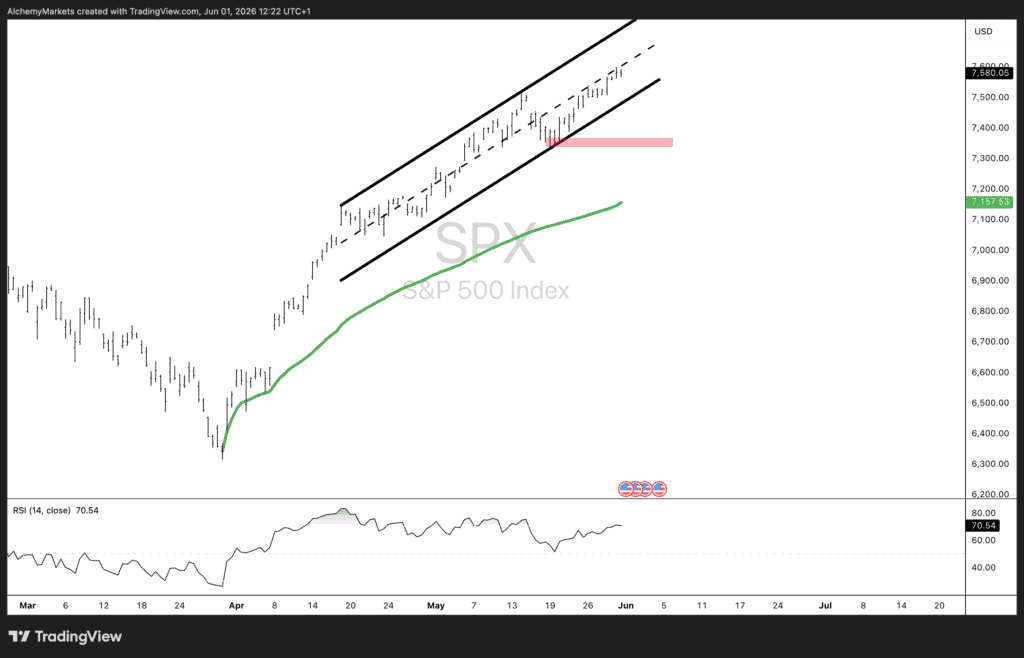
The S&P has spent the entire rally from the early-April lows climbing inside a clean ascending channel, and right now price is tracking the midline — sitting at 7,580, neither overextended at the top nor testing the floor. That's a constructive spot: with price in the middle of the channel, there's room to run toward the upper boundary (channel resistance) before the trend meets its natural ceiling. As long as the channel holds, the path of least resistance still points higher.
Underneath, though, momentum is starting to flag. RSI sits at 70.54 and is rolling over — flattening out after the strong May push rather than driving to fresh highs alongside price. It's not a hard breakdown, but it's a sign the move is running out of steam and may need a breather or fresh fuel to push that next leg.
On the downside, the structure offers two clear cushions. The rising anchored VWAP off the April low has tracked beneath price the entire advance and is the first dynamic support to watch. Below that, horizontal support around 7,350lines up as the next defensive level — a zone that capped and then supported price through mid-May. As long as those hold, dips look like pauses within an uptrend, not the start of something nastier.
So the picture is a market mid-channel with room above, momentum cooling, and well-defined support beneath — walking into the busiest data week of the month.
This is where it gets interesting. The week front-loads everything that matters: ADP private payrolls and ISM Services on Wednesday, jobless claims Thursday, and the headline act — US Non-Farm Payrolls on Friday. With the Fed still in a higher-for-longer crouch and the oil-driven inflation scare only just easing, Friday's print is the swing factor. A hot number revives the dollar and guts any lingering rate-cut hope; a soft one feeds the goldilocks narrative that's underwritten this entire grind higher.
There's also a fresh equity story worth watching: Berkshire Hathaway's surprise $6.8bn all-cash bid for homebuilder Taylor Morrison — Greg Abel's first major swing as CEO — is a loud vote of confidence in the US housing cycle turning. It lit up homebuilders pre-market and adds a constructive, rate-sensitive thread beneath the index.
Trend intact, room to the upside, momentum cooling, catalysts incoming. This isn't a setup to fight the tape — it's one to respect it while watching the levels. With price mid-channel, there's scope for a push toward channel resistance if the data cooperates and momentum re-engages. On the flip side, the rising anchored VWAP and horizontal support at 7,350 are the lines bulls want to defend on any pullback. Lose those and the constructive read gets a rethink. Either way, NFP will likely cast the deciding vote.
Stay nimble. The trend is your friend right up until the data tells it otherwise.
Alchemy Markets is a multi-asset brokerage providing retail traders with the same elite trading conditions, tools, and transparency typically reserved for institutions.
Select the categories and companies you wish to follow directly to your person rss feed.
Create Custom RSS FeedSign up and join over 5,000 professional members who receive personalized news alerts, curated professional connections, and more for free!
US stocks closed higher on Wednesday, with the Nasdaq gaining 1%, the S&P 500 rising 0.6%, and the Dow advancing 0.7%, as renewed enthusiasm for AI-related stocks lifted market sentiment.
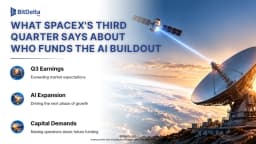
SpaceX went public in June as a rocket company. On October 20 it reported as something else entirely: an AI infrastructure business, financed by a satellite broadband network, with a launch division attached. Rockets generated 12% of third quarter revenue and lost money. The AI segment generated 52% of revenue and consumed 84% of capital expenditure. Starlink generated 85% of operating profit.
Standard Chartered has signed definitive agreements to acquire 100% of Zodia Custody UK Limited, folding its regulated digital asset custody business into Securities Services. Zodia Solutions will be set up under SC Ventures with bank investors including Northern Trust, NAB Ventures, Emirates NBD and Investcorp.
Bybit Fintech FZE has secured a Virtual Asset Service Provider licence from Dubai’s Virtual Assets Regulatory Authority for Exchange Services, covering spot trading. Bybit’s Peter Loo said the firm hopes to add derivatives, subject to regulatory approvals. Its international Dubai headquarters opened in 2022.
ATFX Connect has released its Q4 2026 Institutional Edge, examining the geopolitical, monetary policy and fiscal pressures shaping global financial markets in the final quarter of the year.
The Nasdaq 100 is trading at 29,382. After reaching a recent high of 29,957, the index reversed sharply and has been recording a series of lower highs and lower lows.
FM Summit London returns to Old Billingsgate on 24 November 2026 for its 15th edition, with a curated one-day format aimed at senior executives. LMAX Group, Plus500, oneZero and MetaQuotes are among confirmed exhibitors, with Business Connect meetings, roundtables and an opening event at The Folly on 23 November.
GCEX has launched European-style, fiat-settled options on Bitcoin and Ethereum with monthly expiries for eligible professional and institutional clients. The service runs through the GCEX OTC desk, with pricing from Tier 1 liquidity providers and reporting on XplorPortal. GC Exchange Limited is authorised by the UK FCA
Wall Street closed mostly higher on Tuesday, led by a nearly 1% gain in the Dow. In Asia, South Korea’s Kospi rebounded 2.7% and Japan’s Nikkei gained 0.8%.
Brent crude is trading at $111.70. The latest price action show the recovery continuing toward $111.70, suggesting that demand has returned after the sharp correction.