Explore Companies BySectors & Categories
Explore Companies ByUse Cases
Explore Companies ByProducts & Services
Explore Companies ByRankings & Reviews
Featured NewsCompaniesMarketsCryptoTechRegulatoryCommentaryUKUSWorldMore

    Latest Wires

      Daily Newsletter

      LF Daily News

      Daily industry focused newsletter giving you an overview for the financial & finTech industry.

      See All Newsletters
      By clicking "Sign Up" you are agreeing to our Terms of Service and Privacy Policy

      Bitcoin Extends Decline as Price Slides To Deep Discount – Is a Larger Breakdown Coming?

      Published: just now

      Build discipline, remove emotional mistakes, and trade with confidence using this step-by-step discipline framework—perfect for SMC and price action traders.
      • Bitcoin continues its controlled selloff, pressing deeper into the Weekly Fair Value Gap, where the market is attempting to stabilize after weeks of consistent lower-timeframe weakness.


      • Macro risk-off sentiment, cooling ETF flows, and a structurally bearish chart remain the main drivers behind Bitcoin’s decline.


      • BTC must hold the 86,500–92,000 Weekly FVG to produce a relief rally. A clean breakdown opens the path toward the Weekly Order Block at 83,000–78,000.


      Why Bitcoin Is Selling Off – The Real Drivers Behind the Drop

      Bitcoin’s decline is not caused by a single headline. It’s the result of a convergence of macro and technical pressures:


      1. A Global Risk-Off Phase Is Returning


      Markets have rotated back into defensive positioning:


      • Stronger USD environment
      • Mixed equity sentiment
      • Tightening liquidity conditions


      Crypto is the most sensitive risk asset. When liquidity dries up, Bitcoin typically reacts first — and hardest.


      2. Cooling ETF Demand


      Spot ETF inflows were the backbone of Bitcoin’s earlier rally. But over recent weeks:


      • Daily inflows have slowed
      • Net flows are flattening
      • Institutional activity is less aggressive


      This reduces consistent bid support and makes every downside move more pronounced.


      3. Thin Liquidity Amplifying Each Move


      Market depth is weakening:


      • Lower stablecoin inflow
      • Less capital entering futures markets
      • Funding rates turning mildly negative


      Combined with a bearish trend, this creates an environment where each sell impulse extends further than expected.


      4. Technical Breakdown Catalyzing Additional Selling


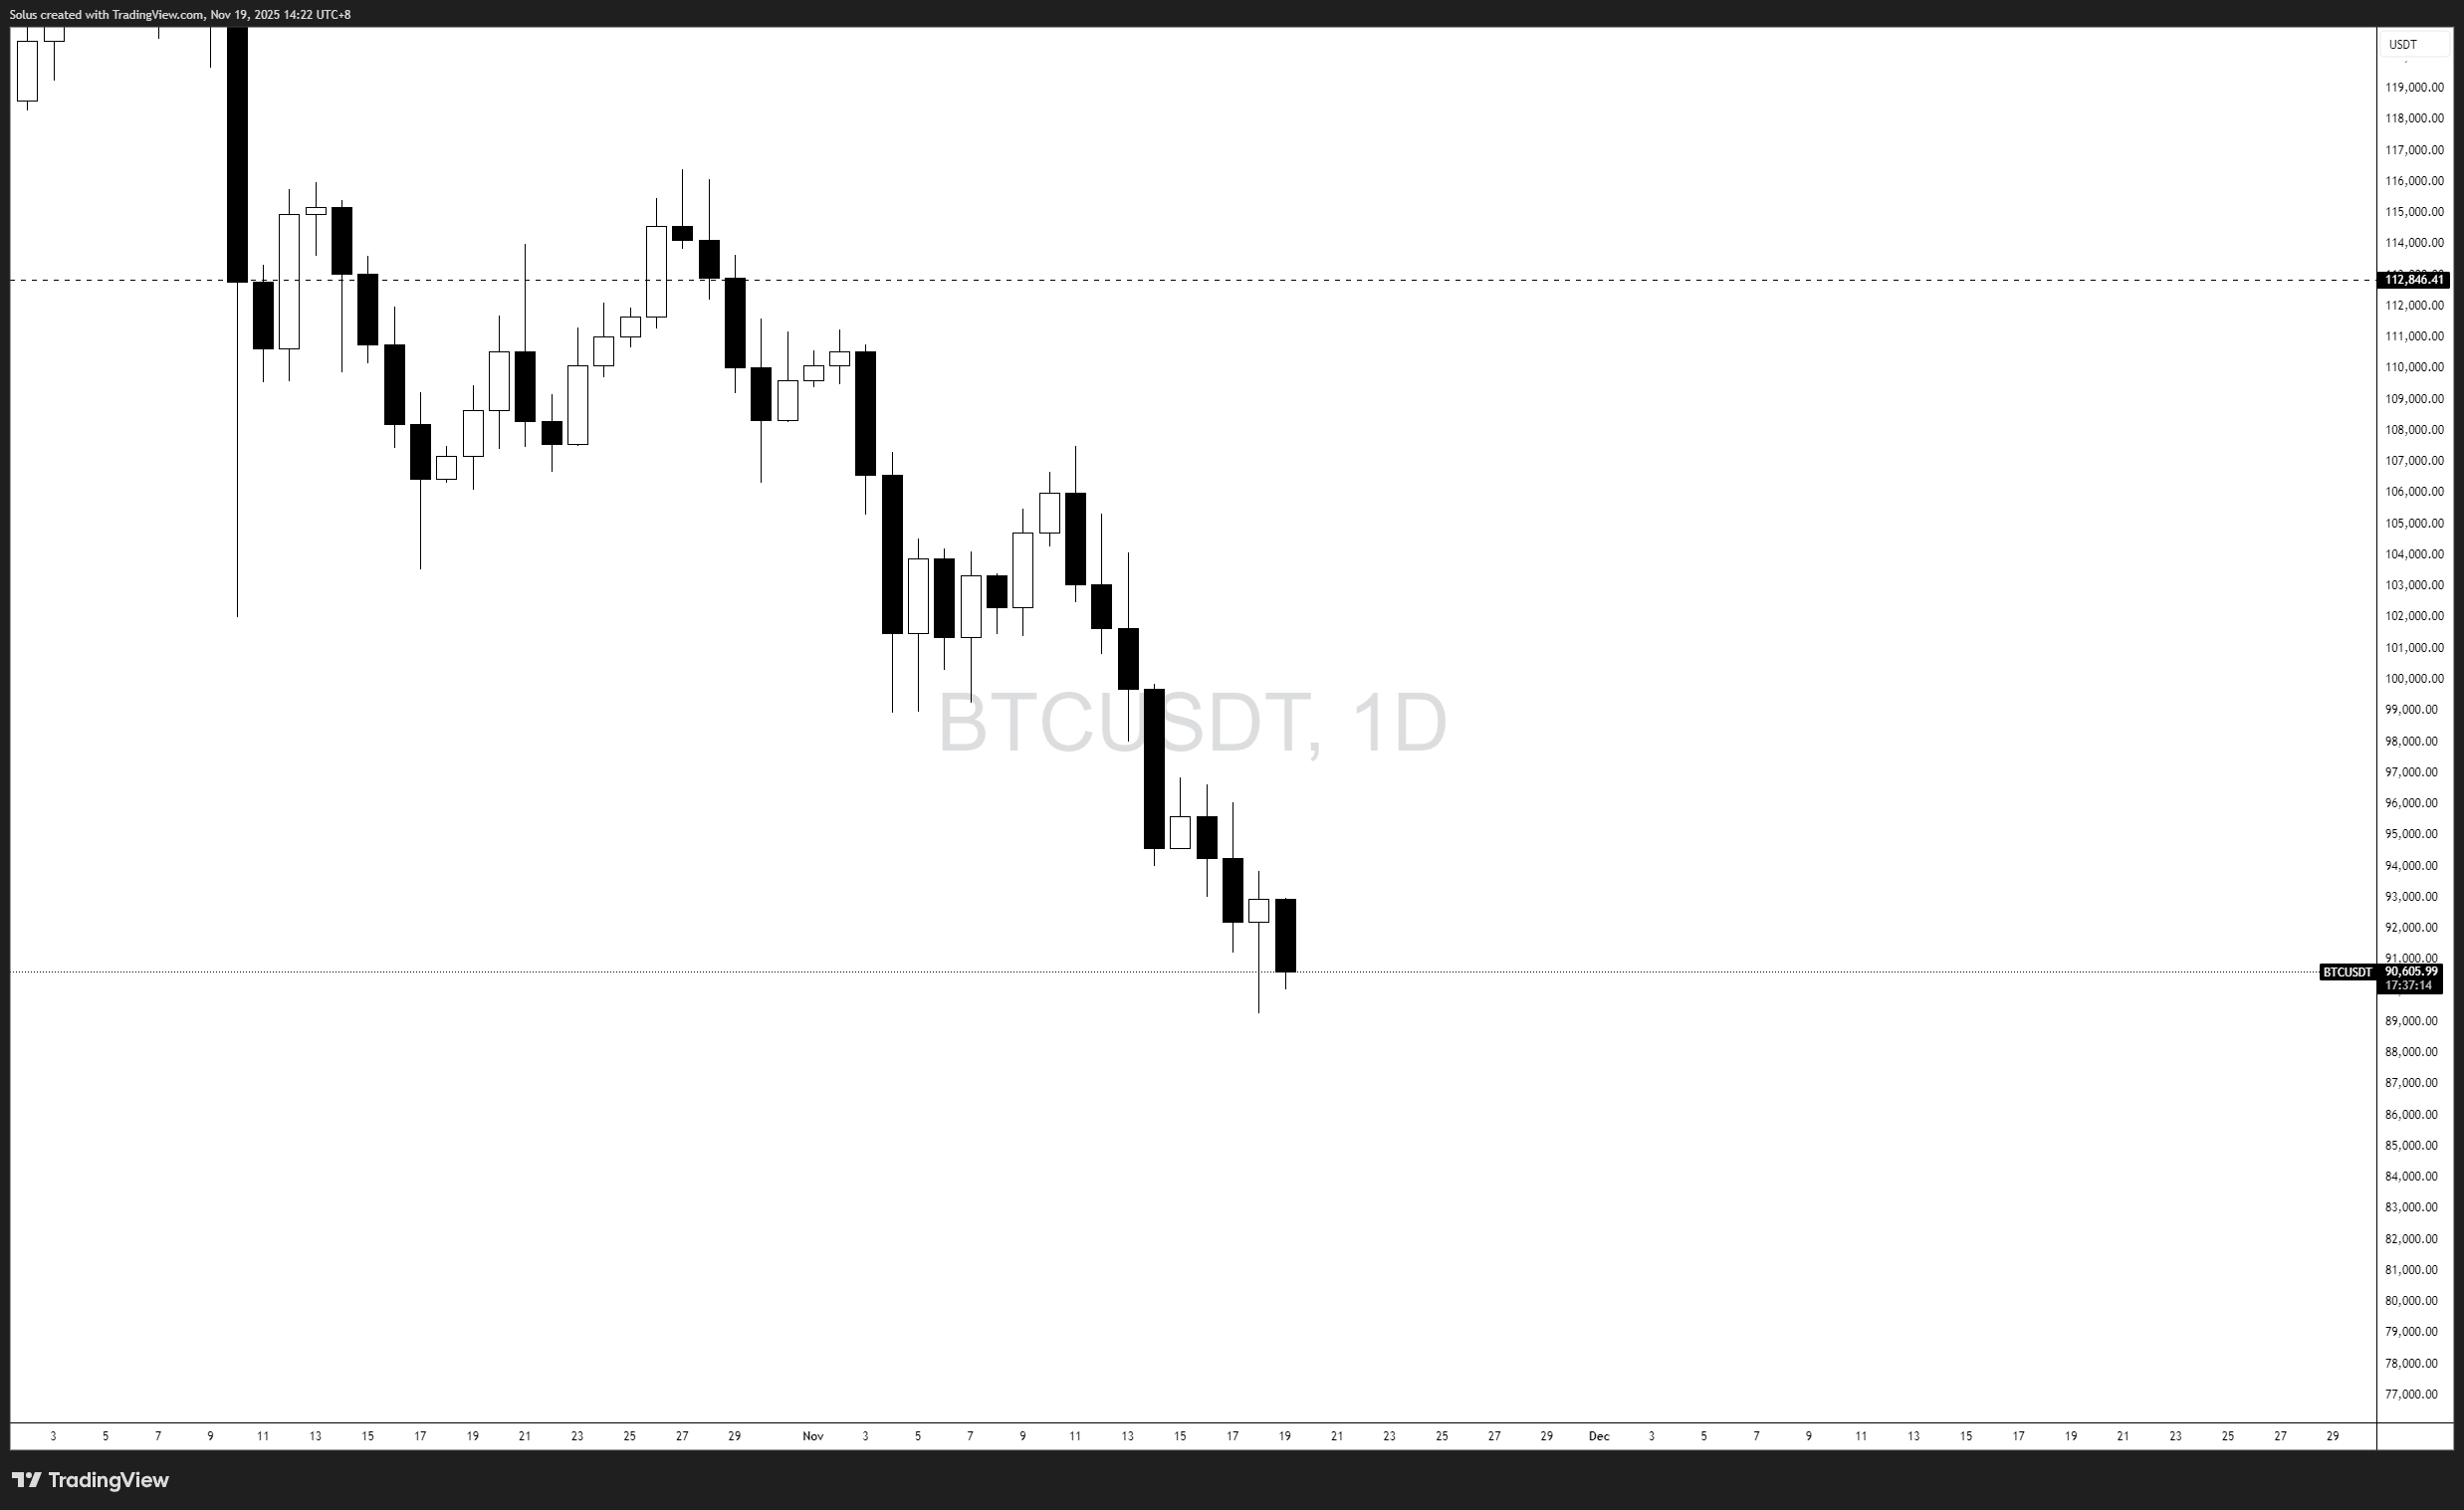
      Once Bitcoin broke below the 96,000–98,000 support, the trend flipped decisively.


      Since then:


      • Lower highs continue on every bounce
      • Candle bodies are large on sell days, tight on retracements
      • Weekly inefficiencies below are pulling price downward


      This is one of the cleanest bearish structures Bitcoin has shown in months — and until something shifts, the bias remains lower.


      Overall Narrative: BTC’s Trend Is Bearish, But Now at a Decision Point

      Visual content


      Bitcoin is now trading inside a large Weekly Fair Value Gap between 92,000 and 86,500 — an area where the market should attempt to react if buyers want to stop the bleeding.


      The zone acts as:


      • A magnet for price
      • A potential area for higher-timeframe reaccumulation


      • A dividing line between a corrective pullback and a deeper trend reversal
      •  
      Visual content


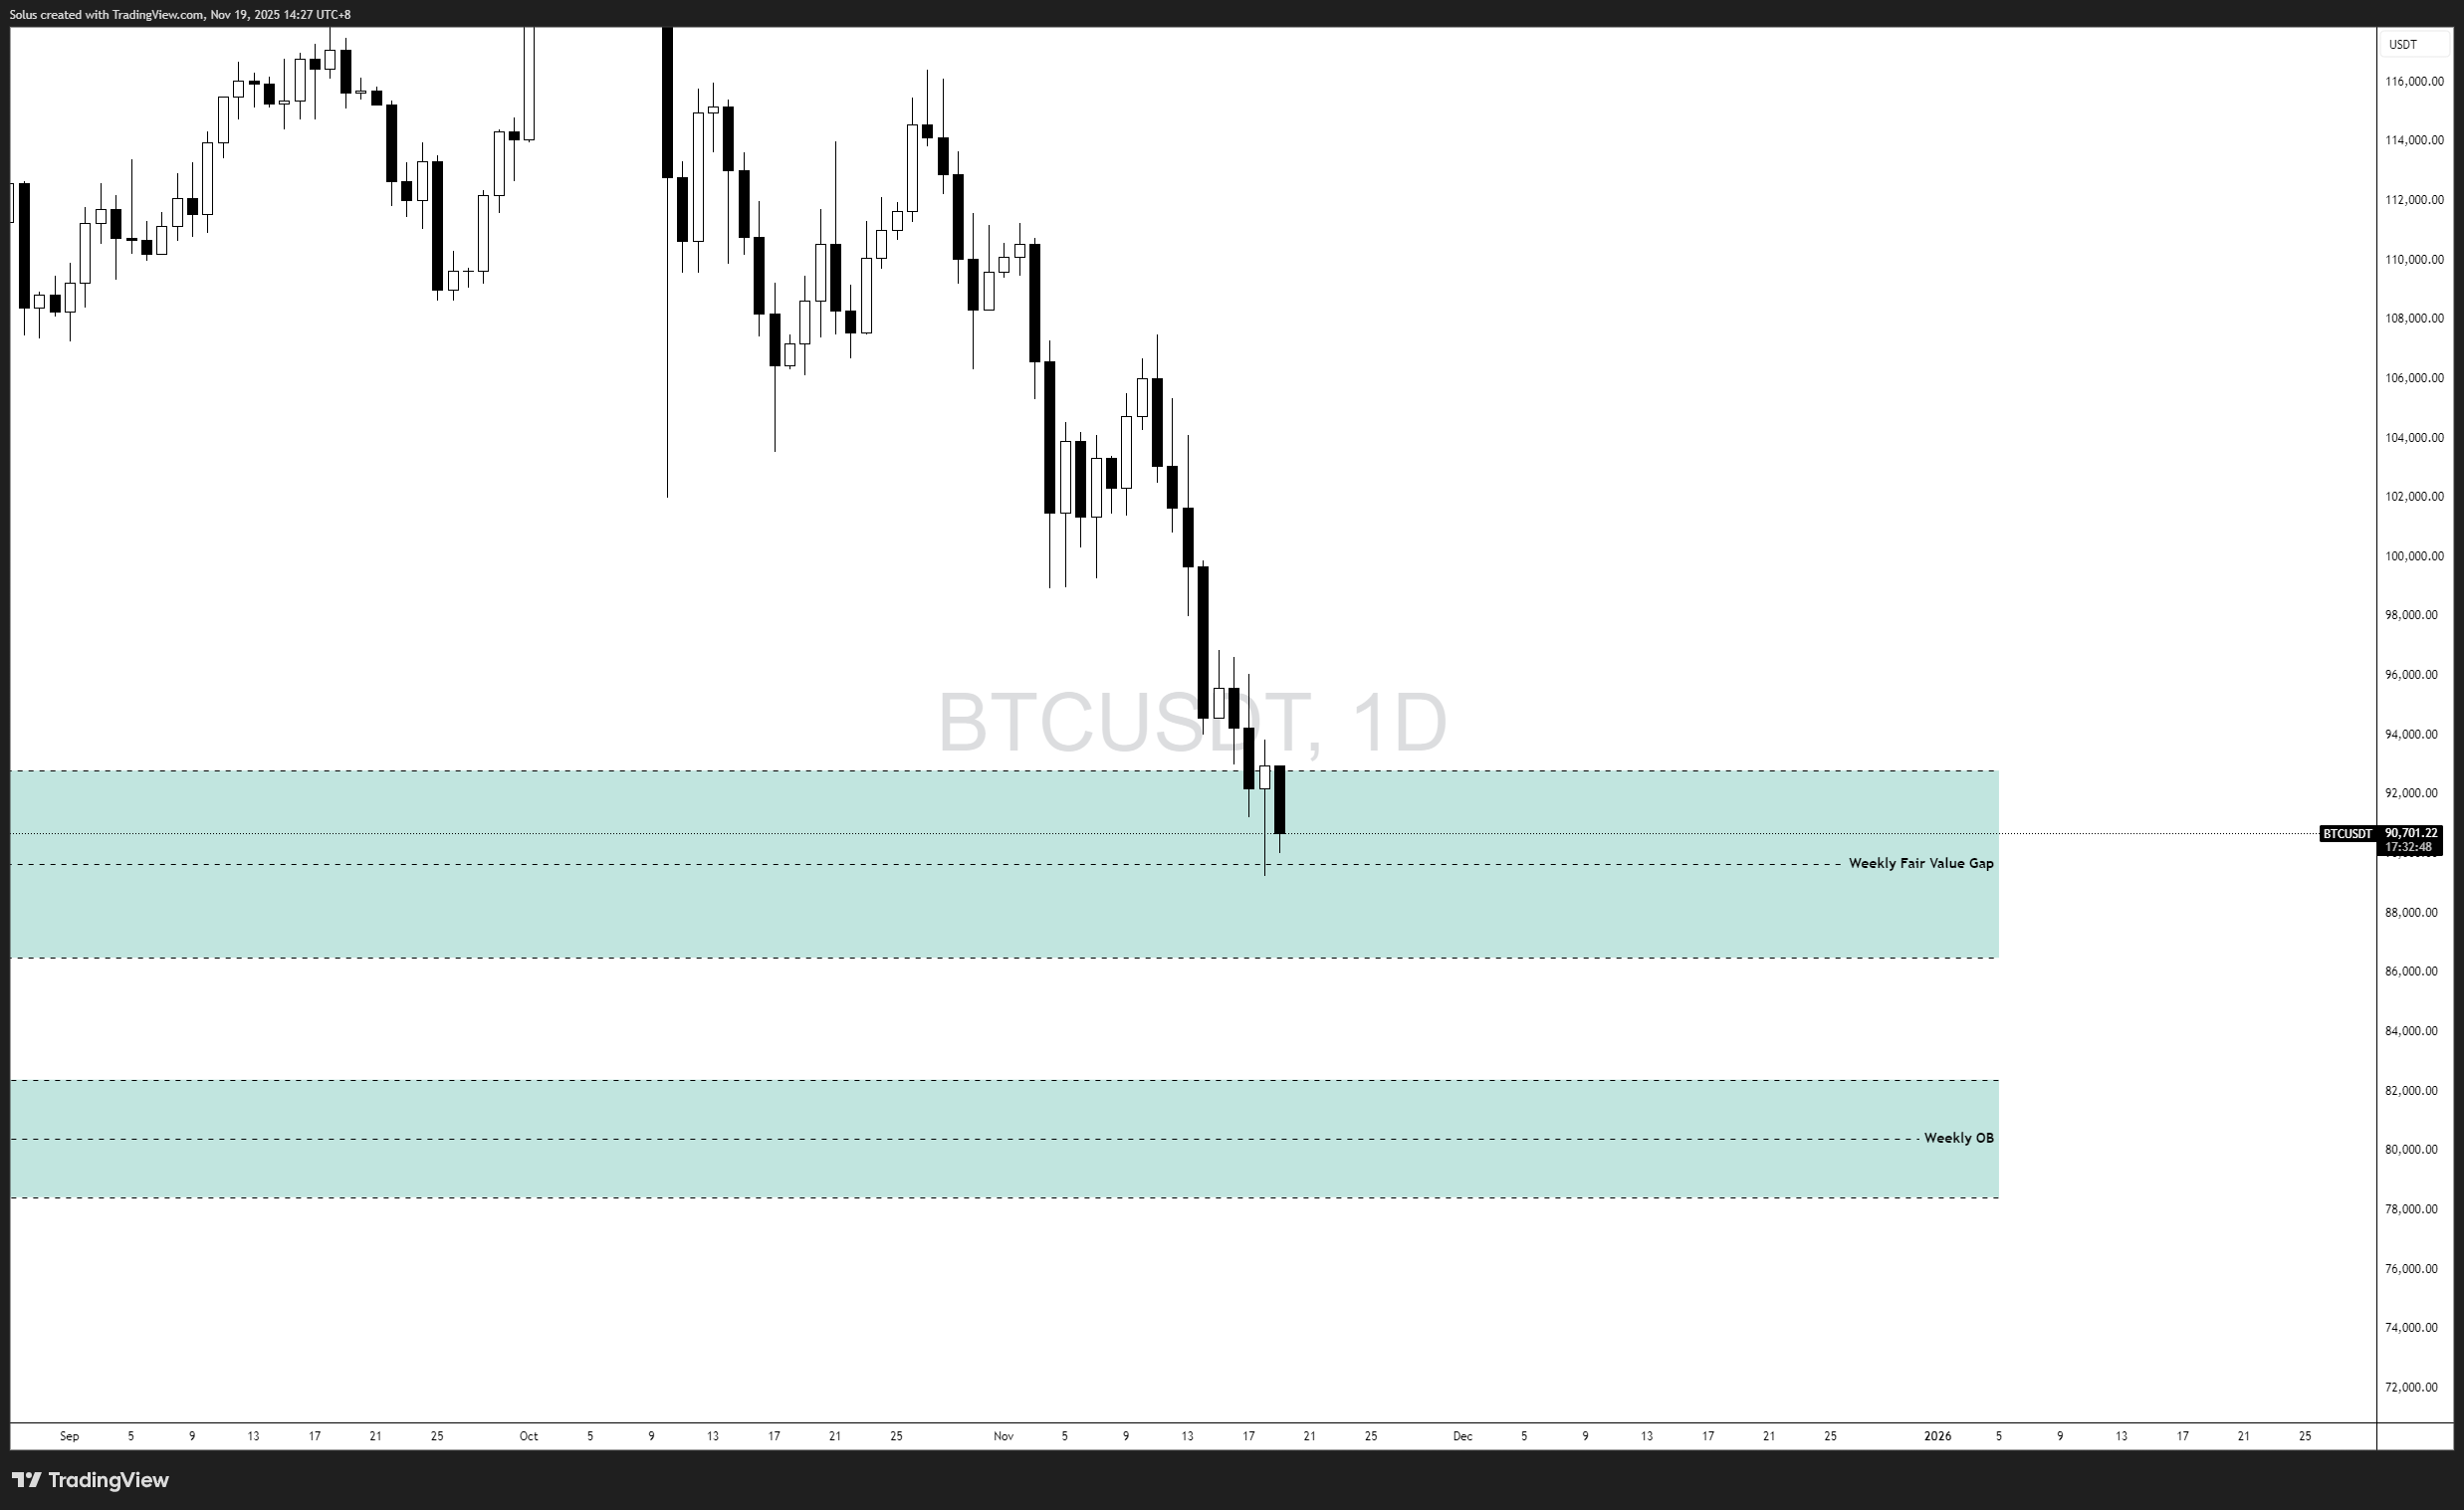
      However, if this FVG fails, BTC opens a much larger downside toward a Weekly Order Block at 83,000–78,000 — your next major higher-timeframe liquidity pocket.


      Technical Outlook


      Bitcoin remains in a well-defined downtrend across both the 1D and 4H charts:


      • Daily: Lower highs, lower lows, and bearish candle bodies dominating
      • 4H: Impulsive sell legs, shallow pullbacks, and FVG violations on every bounce
      • Market Structure: No bullish break of structure yet on any meaningful timeframe


      BTC is now sitting at the mid-section of the Weekly FVG. The next daily candles will determine if this becomes:


      • A bullish reaction zone, or
      • A bearish continuation platform


      Bullish Scenario – Weekly FVG Defends and BTC Attempts a Relief Rally

      Visual content


      This matches your second chart.


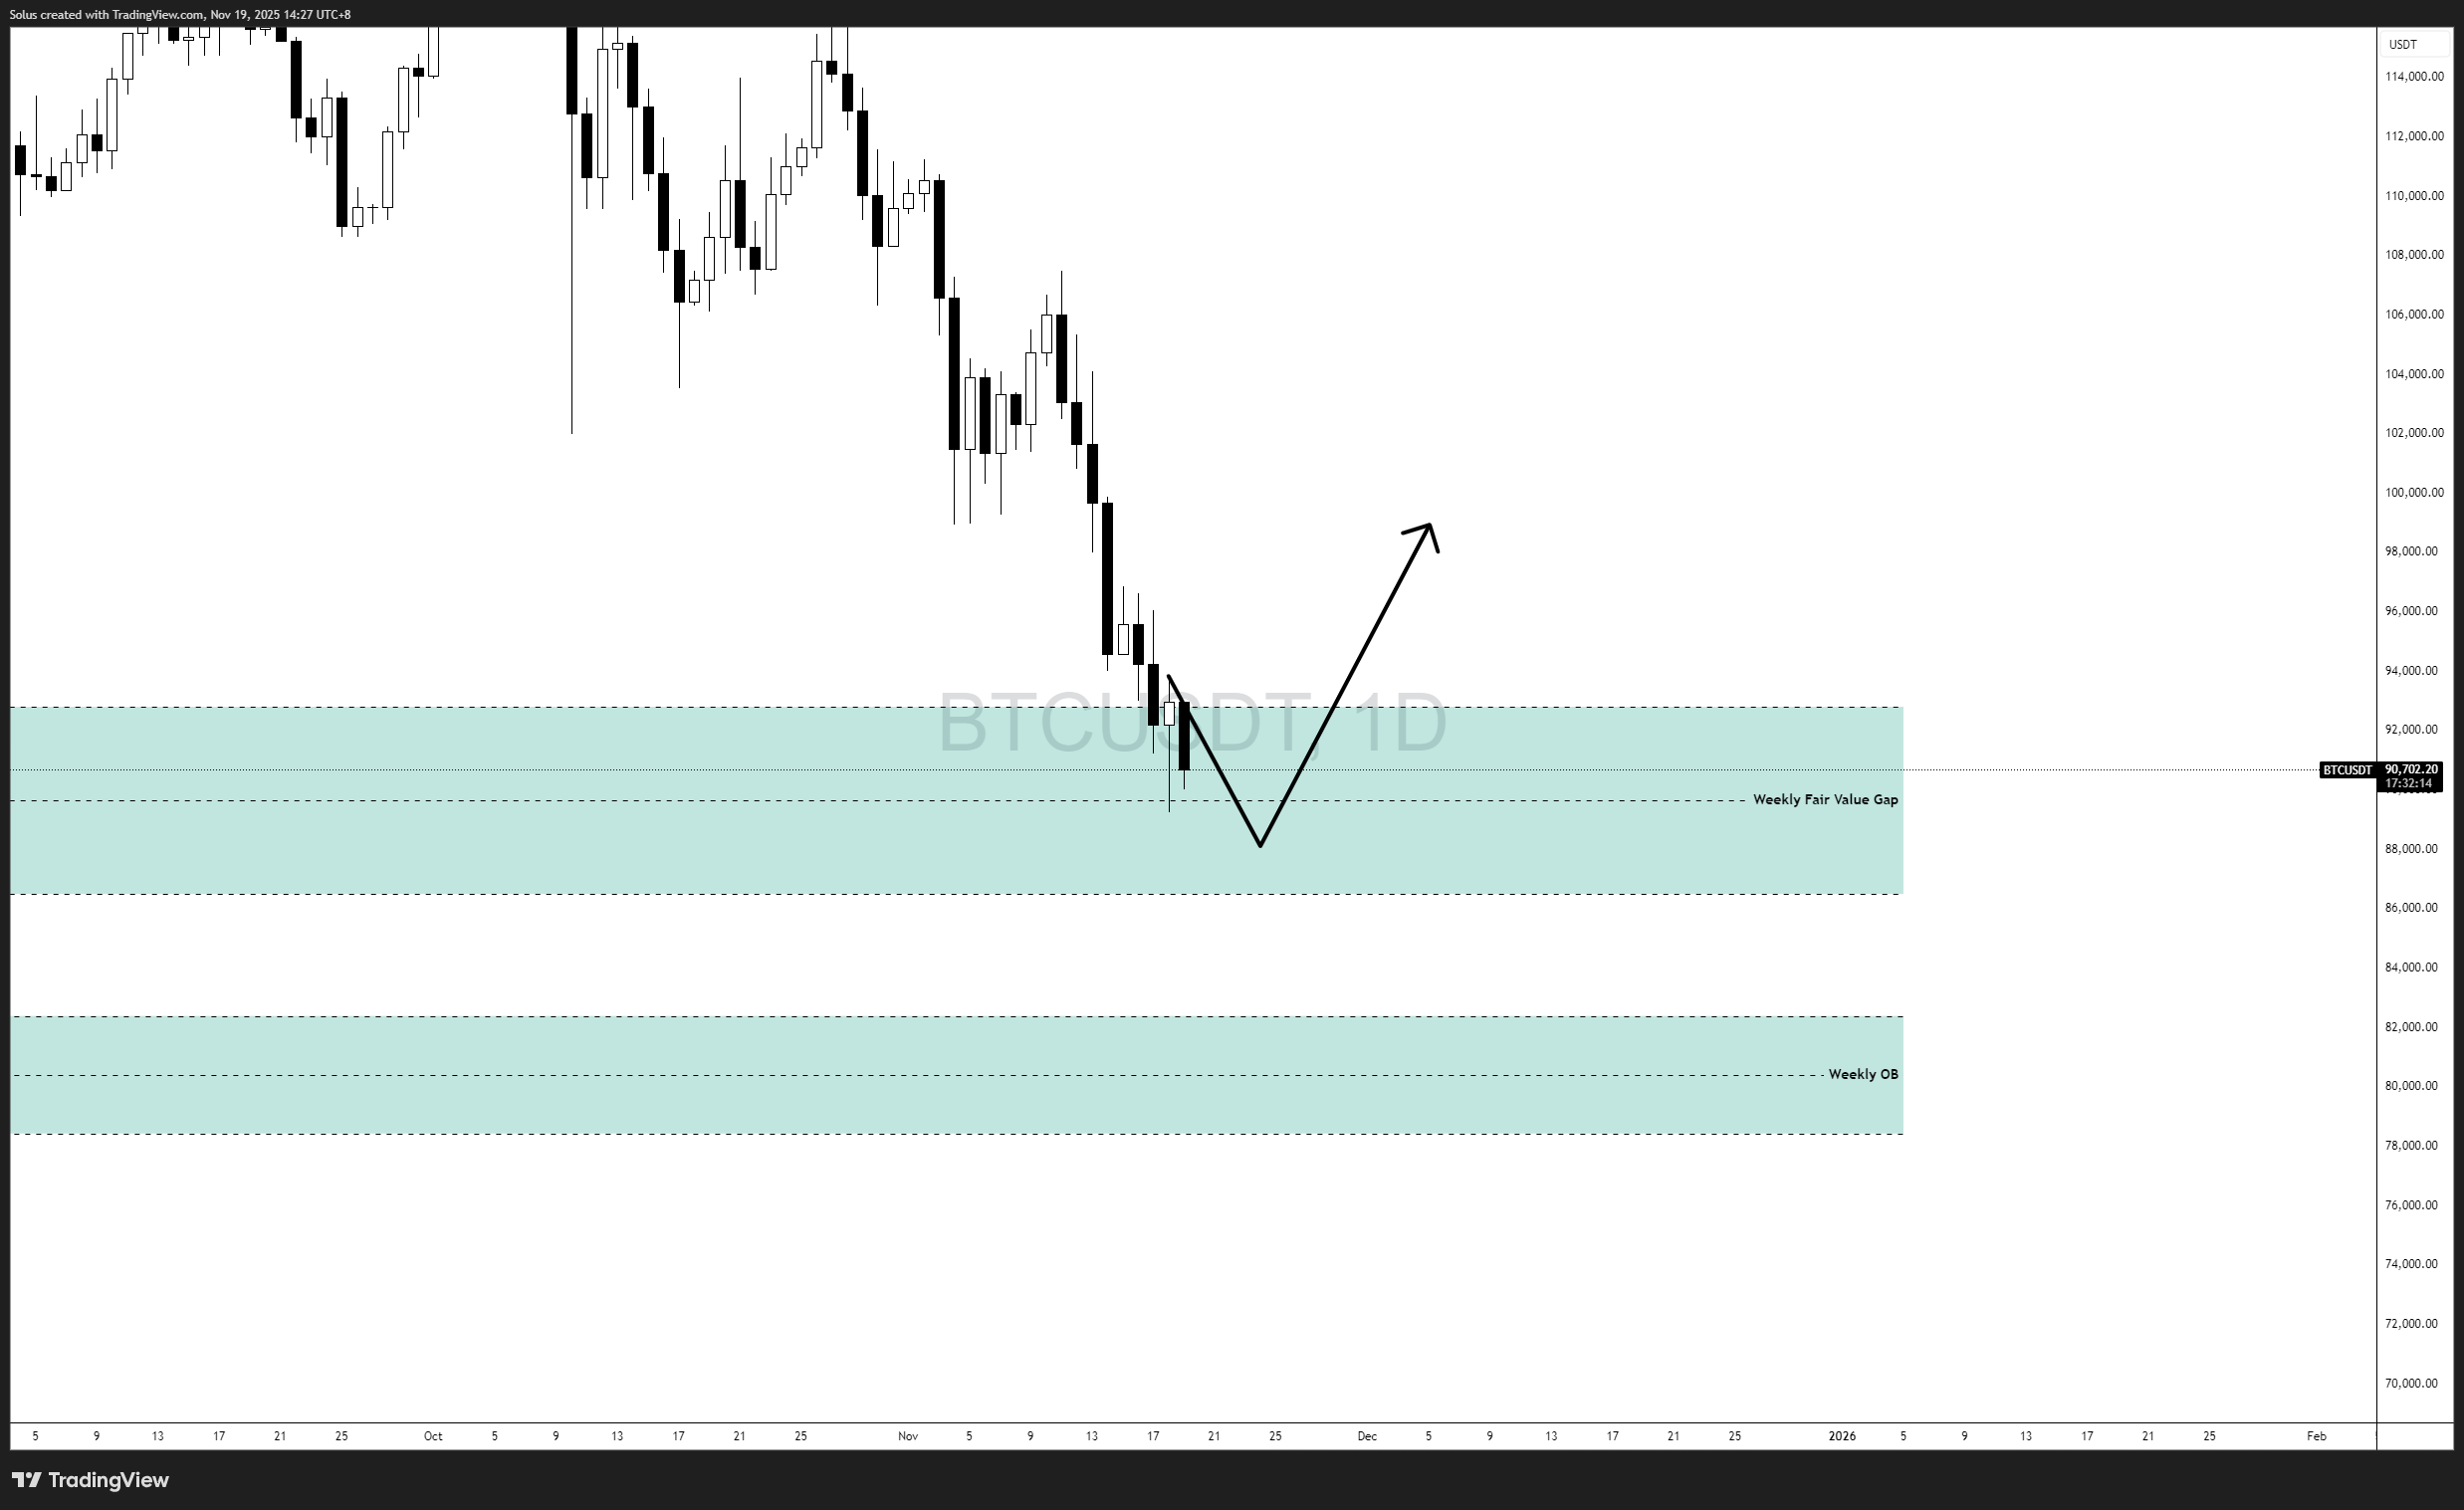
      For a bullish correction to emerge, Bitcoin must:


      1. Hold the Weekly FVG (92,000–86,500)

      This is the last major structure before weekly imbalance opens further downside.


      2. Produce a sweep-and-reclaim


      Ideal bullish reaction:


      • Price dips toward 87,000–86,500
      • Wicks below current lows
      • Reclaims back inside the FVG with strength


      This indicates absorption of sell pressure.


      3. Break above 93,000–94,000


      This level is essential:


      • It is the first 4H lower-high
      • It’s also the midpoint of the imbalance
      • A break here creates a market structure shift


      4. Upside targets


      If BTC confirms the shift:


      • 94,000–96,000: first corrective target
      • 98,000: prior broken support
      • 100,000–102,000: extended retracement and upside inefficiency


      This scenario does not signal a full bottom — only a structured corrective rally inside a broader downtrend.


      Bearish Scenario – BTC Rejects FVG and Drops Into Weekly OB

      Visual content


      This matches your first chart.


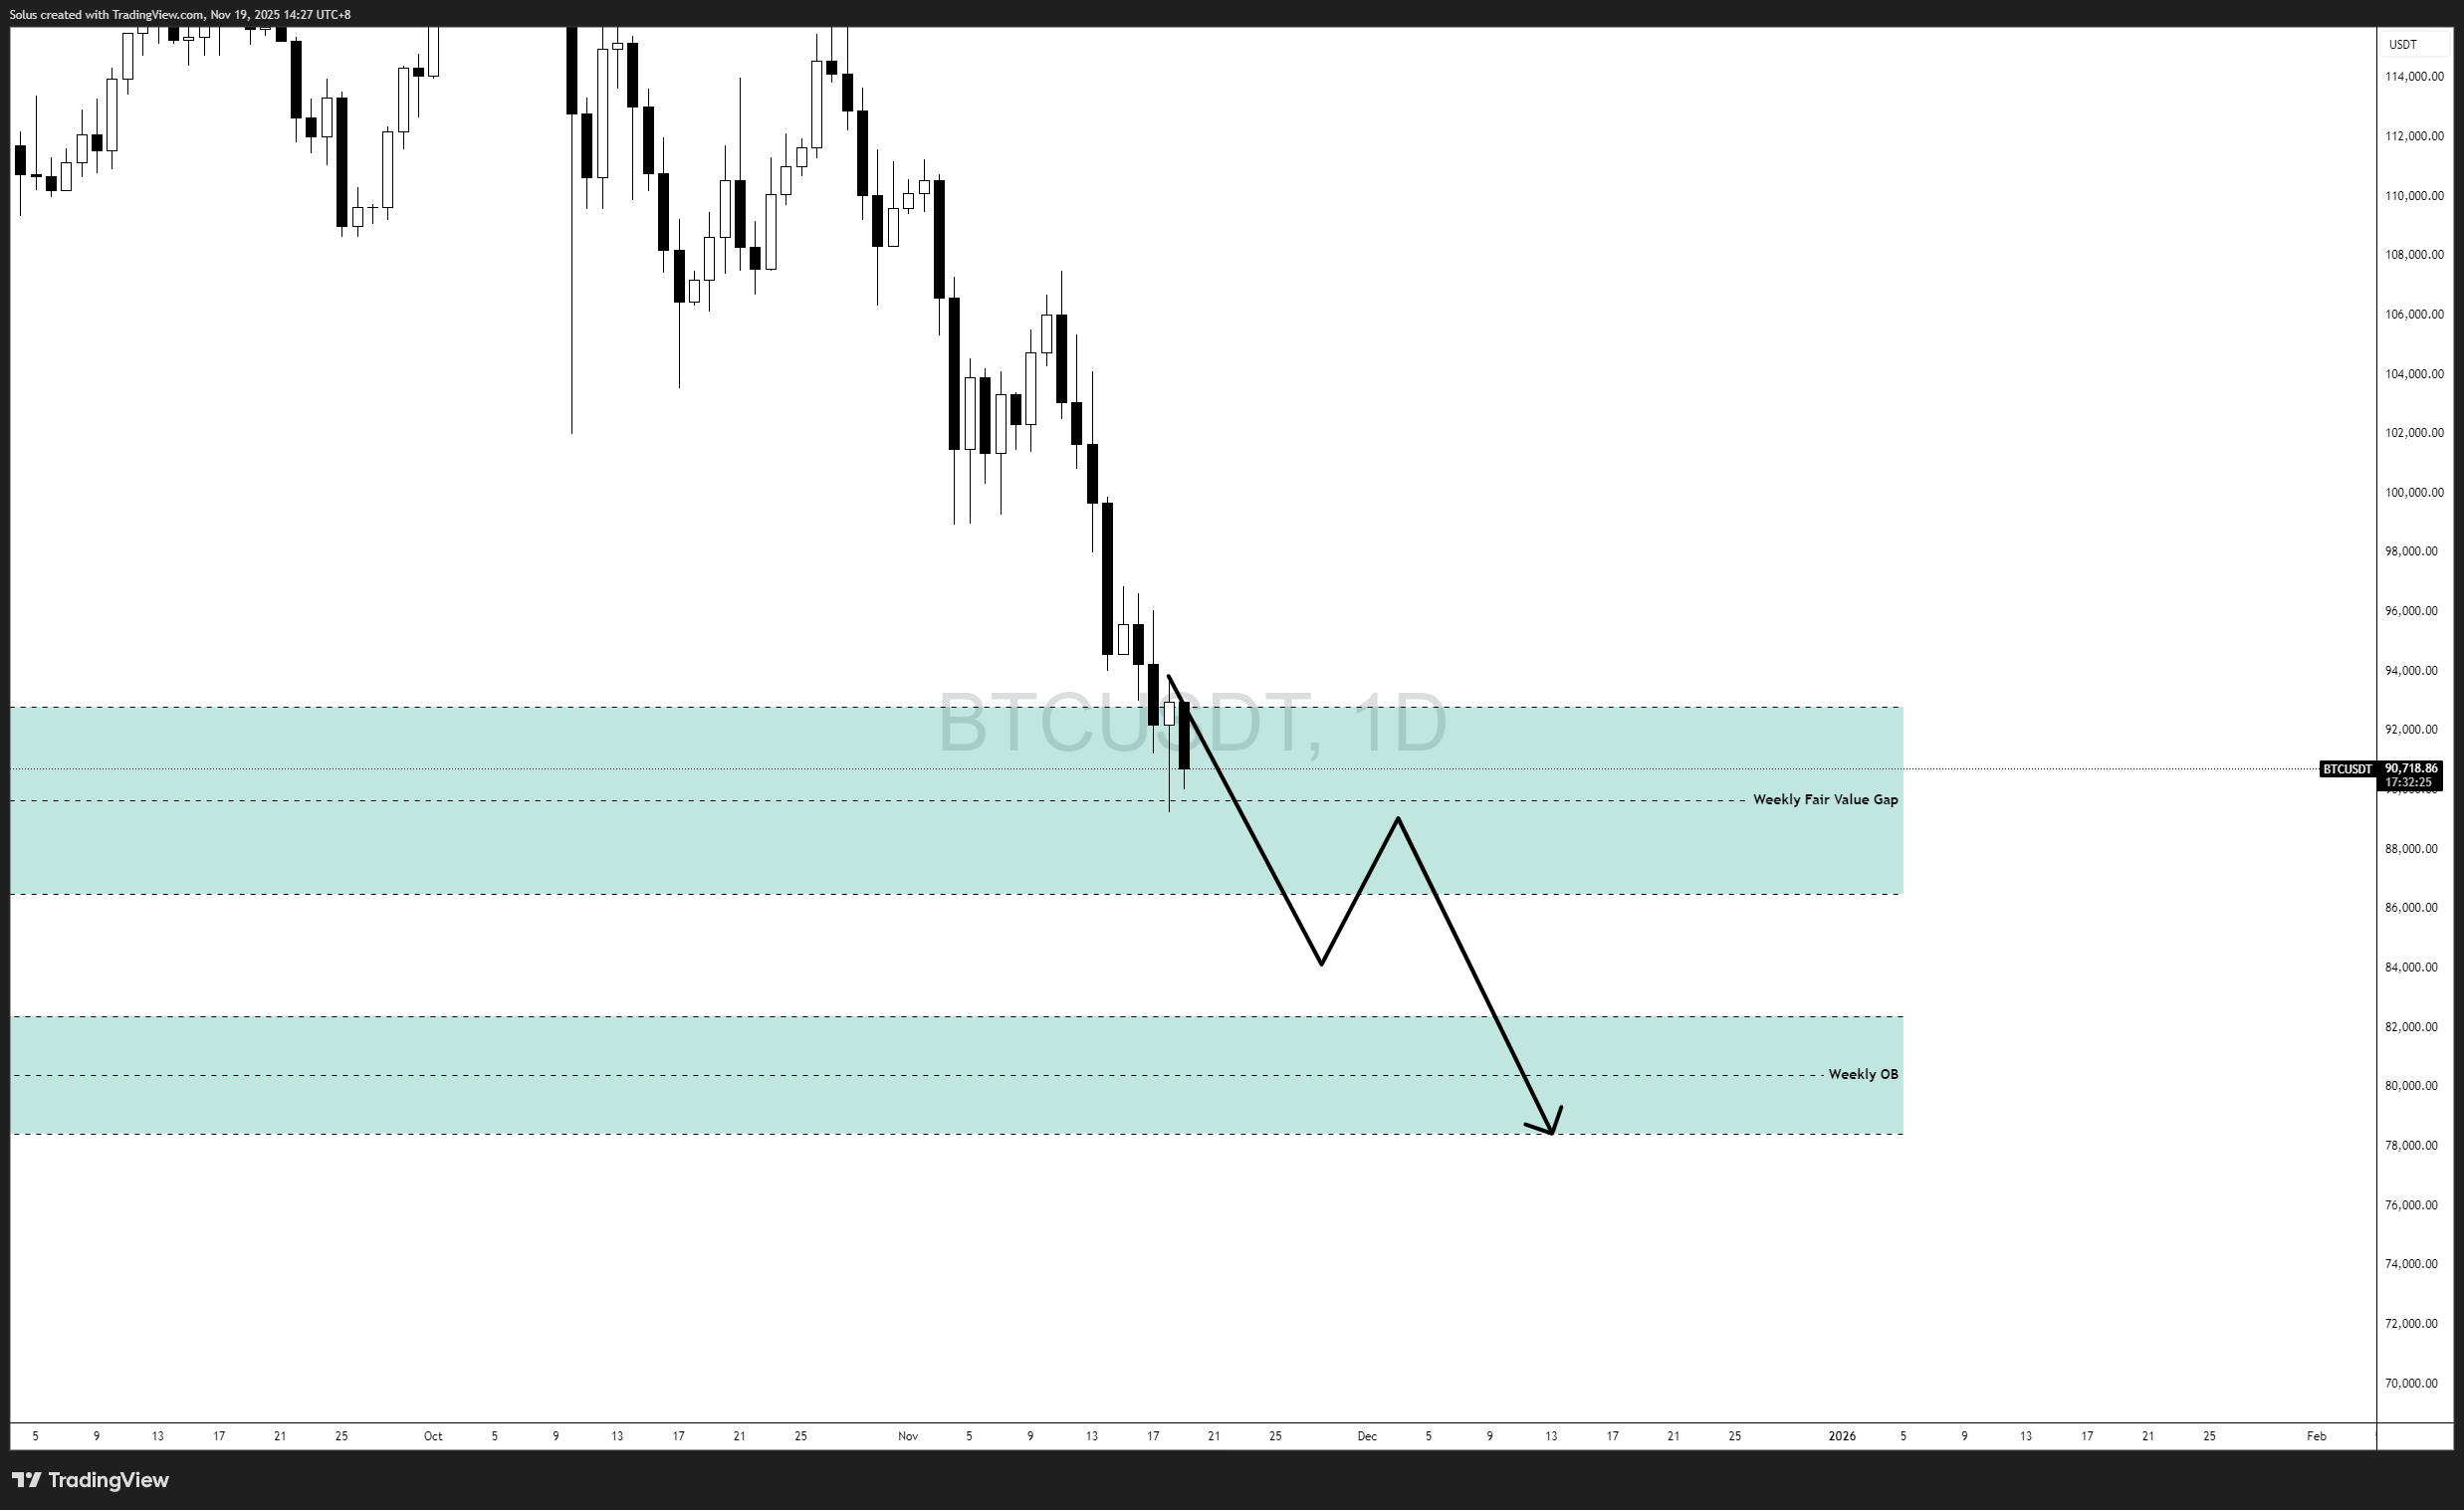
      If Bitcoin fails to regain control inside the Weekly FVG:


      1. Rejection below 92,000–89,000 confirms weakness

      Any reaction that stalls under the upper FVG boundary implies sellers remain dominant.


      2. Break below 86,500 is the trigger

      A clean daily close beneath this level activates the next leg.


      3. Minor pullback → lower high → continuation

      Structure likely follows the drawn path:

      • Pullback into 88,000–90,000
      • Failure to break higher
      • Continuation toward Weekly OB


      4. Downside targets

      • 83,000: top of Weekly OB
      • 80,000: midpoint of OB
      • 78,000: full sweep of the block

      This is currently the higher-probability scenario until proven otherwise.


      Final Thoughts


      Bitcoin is now testing a critical higher-timeframe zone.


      The trend is still bearish, but the location signals that the market is nearing an inflection point.

      Two simple rules define the next major move:


      • Hold 86,500 → relief rally possible
      • Lose 86,500 → 83,000–78,000 becomes inevitable


      Until BTC reclaims 93,000–94,000, any upside remains corrective — not a trend reversal.


      Start Trading Live!

      • Trade forex, indices, gold, and more
      • Access ACY, MT4, MT5, & Copy Trading Platforms


      It’s time to go from theory to execution!

      Create an Account. Start Your Live Trading Now!


      Check Out My Contents:


      Strategies That You Can Use

      Looking for step-by-step approaches you can plug straight into the charts? Start here:


      Indicators / Tools for Trading

      Sharpen your edge with proven tools and frameworks:


      How To Trade News

      News moves markets fast. Learn how to keep pace with SMC-based playbooks:


      Learn How to Trade US Indices

      From NASDAQ opens to DAX trends, here’s how to approach indices like a pro:


      How to Start Trading Gold

      Gold remains one of the most traded assets - here’s how to approach it with confidence:


      How to Trade Japanese Candlesticks

      Candlesticks are the building blocks of price action. Master the most powerful ones:


      How to Start Day Trading

      Ready to go intraday? Here’s how to build consistency step by step:


      Swing Trading 101


      Learn how to navigate yourself in times of turmoil

      Markets swing between calm and chaos. Learn to read risk-on vs risk-off like a pro:


      Want to learn how to trade like the Smart Money?

      Step inside the playbook of institutional traders with SMC concepts explained:


      Master the World’s Most Popular Forex Pairs

      Forex pairs aren’t created equal - some are stable, some are volatile, others tied to commodities or sessions.


      Metals Trading


      Stop Hunting 101

      If you’ve ever been stopped out right before the market reverses - this is why:


      Trading Psychology

      Mindset is the deciding factor between growth and blowups. Explore these essentials:


      Market Drivers


      Risk Management

      The real edge in trading isn’t strategy - it’s how you protect your capital:


      Suggested Learning Path

      If you’re not sure where to start, follow this roadmap:


      1. 1. Start with Trading Psychology → Build the mindset first.
      2. 2. Move into Risk Management → Learn how to protect capital.
      3. 3. Explore Strategies & Tools → Candlesticks, Fibonacci, MAs, Indicators.
      4. 4. Apply to Assets → Gold, Indices, Forex sessions.
      5. 5. Advance to Smart Money Concepts (SMC) → Learn how institutions trade.
      6. 6. Specialize → Stop Hunts, News Trading, Turmoil Navigation.


      This way, you’ll grow from foundation → application → mastery, instead of jumping around randomly.


      Follow me for more daily market insights!

      Jasper Osita - LinkedIn - FXStreet - YouTube


      This content may have been written by a third party. ACY makes no representation or warranty and assumes no liability as to the accuracy or completeness of the information provided, nor any loss arising from any investment based on a recommendation, forecast or other information supplies by any third-party. This content is information only, and does not constitute financial, investment or other advice on which you can rely.

      ACY Securities is one of Australia's fastest growing multi-asset online trading providers, offering ultra-low-cost trading, rock-solid execution, technologically superior account management and premium market analysis.

      This content may have been written by a third party. LiquidityFinder makes no representation or warranty and assumes no liability as to the accuracy or completeness of the information provided, nor any loss arising from any investment based on a recommendation, forecast or other information supplies by any third-party. This content is information only, and does not constitute financial, investment or other advice on which you can rely.
      Comments
      Most Recent
      Written By
      Daily Newsletter

      LF Daily News

      Daily industry focused newsletter giving you an overview for the financial & finTech industry.

      See All Newsletters
      By clicking "Sign Up" you are agreeing to our Terms of Service and Privacy Policy
      RSS Feeds

      Create a custom RSS Feed

      Select the categories and companies you wish to follow directly to your person rss feed.

      Create Custom RSS Feed

      Related Categories:

      Related Tags:

      #BitcoinPrice#WeeklyFairValueGap#ETFFlows#TechnicalAnalysis#CryptoMarkets#RiskOff#MarketLiquidity

      Related Articles:

      Find The Right Partners for
      Your Trading Business

      Sign up and join over 5,000 professional members who receive personalized news alerts, curated professional connections, and more for free!

      Sign Up with LinkedIn
      Create Your FREE Account
      Get access to latest news, updates, real-time data, brokerage and trading firm insights and customized information feeds.

      As the brokerage industry becomes increasingly complex, conversations are shifting from growth alone to operational control, risk visibility, and resilience. IFX Expo International 2026 in Limassol provides a valuable opportunity for industry professionals to exchange ideas and explore the challenges shaping the next phase of brokerage operations.

      just now

      XS.com has appointed Omar Alaa as MENA Marketing Director. Alaa brings experience in digital acquisition, paid media, and regional brand development, and will oversee campaign execution and audience engagement across the Middle East and North Africa.

      just now

      MEXC has launched Combo, a new prediction markets feature enabling users to combine up to 20 event predictions across sports and crypto into a single order. The exchange says it is the first centralised platform to offer multi-event combination trading globally.

      just now

      Swap rates are one of the most frequently mismanaged aspects of MetaTrader platform operations. Set them incorrectly and you expose your brokerage to unnecessary costs, client complaints and compliance risk. This guide explains how swaps are calculated on MT4 and MT5, the most common mistakes brokers make when updating rates, best practices for staying aligned with interbank rates, and how automated swap management tools eliminate the manual workload entirely.

      just now

      Discover the latest AUD/JPY price action analysis. Are we looking at a massive AUD/JPY sell setup? Read my technical breakdown to find out!

      just now

      Will the index can maintain this level before the SpaceX IPO

      just now

      Master your trading psychology to boost profits. Learn why avoiding overtrading and waiting for high-quality setups is the secret to long-term success.

      just now

      Fed hike bets hit 70%+ as May CPI drops this morning — and EUR/USD is sitting on channel support ahead of Thursday's ECB decision.

      just now

      Devexperts has added a Risk Reward drawing tool to its DXcharts financial charting library. The tool displays potential profit and loss for long and short positions, enabling traders to visualise trade outcomes and place orders directly from the chart.

      just now

      Sky Links Capital has launched a Gold AM/PM Fixing service alongside expanded gold options and perpetual weekend trading, giving clients access to LBMA benchmark pricing and a broader suite of instruments to manage gold exposure and execute hedging strategies.

      just now
      Feed