just now

Liquidity Finder Ltd is incorporated in England and Wales, company number 10610740, registered address 167-169 Great Portland Street, Fifth Floor, London W1W 5PF, United Kingdom.
Published: just now

Markets head into today’s US CPI release with inflation nerves creeping back into the picture, largely driven by the recent rebound in oil and gasoline prices following renewed Middle East tensions. After several months where inflation appeared to be gradually cooling, traders are now questioning whether today’s report could mark the beginning of another short-term inflation reacceleration.
Still, the broader macro backdrop looks very different from the inflation shock seen during 2021 and 2022. Wage growth has slowed, consumer demand is softer beneath the surface, and several parts of the economy continue to show signs of cooling. That’s important because it suggests today’s inflation risk may be more about energy and shelter distortions rather than a full-blown structural inflation spiral.
In other words, markets are trying to determine whether today’s CPI print represents a temporary inflation scare — or something more persistent that could force the Federal Reserve back into a more aggressive stance.
The key focus today isn’t just the headline CPI number itself, but how broad inflation pressures appear underneath the surface.
A headline beat driven mainly by gasoline and energy may be viewed differently from a report showing accelerating services and core inflation across the economy.
If CPI comes broadly in line with expectations, markets may interpret the data as manageable rather than alarming. In that scenario, the Fed would likely maintain its current cautious approach instead of turning meaningfully more hawkish. Treasury yields could stabilise, the US dollar may struggle to extend gains aggressively, and equities — particularly AI and growth-related names — may continue leaning on earnings momentum rather than macro fears.
A hotter-than-expected print, however, would likely force markets to further push back Fed rate-cut expectations. That could trigger a sharp move higher in Treasury yields, especially on the front end of the curve, while strengthening the US dollar as traders reprice a more hawkish Fed path. Gold and other rate-sensitive assets could come under pressure, while higher yields may weigh on growth stocks in the short term.
On the flip side, a softer CPI report could reopen the door to a more dovish Fed outlook. Treasury yields would likely move lower, the dollar could weaken, and risk appetite may improve across equities as markets revive hopes for future rate cuts.
For now, markets still appear to be treating this as a temporary inflation scare rather than the beginning of another major inflation cycle.
That distinction matters.
While energy prices can create short-term volatility in headline inflation, investors will want to see whether pricing pressure is becoming more embedded across the broader economy. If core inflation remains relatively contained beneath the energy noise, markets may remain comfortable with the idea that the Fed can eventually ease policy later this year.
Today’s report could therefore become less about whether inflation ticks slightly higher — and more about whether inflation breadth begins expanding again.
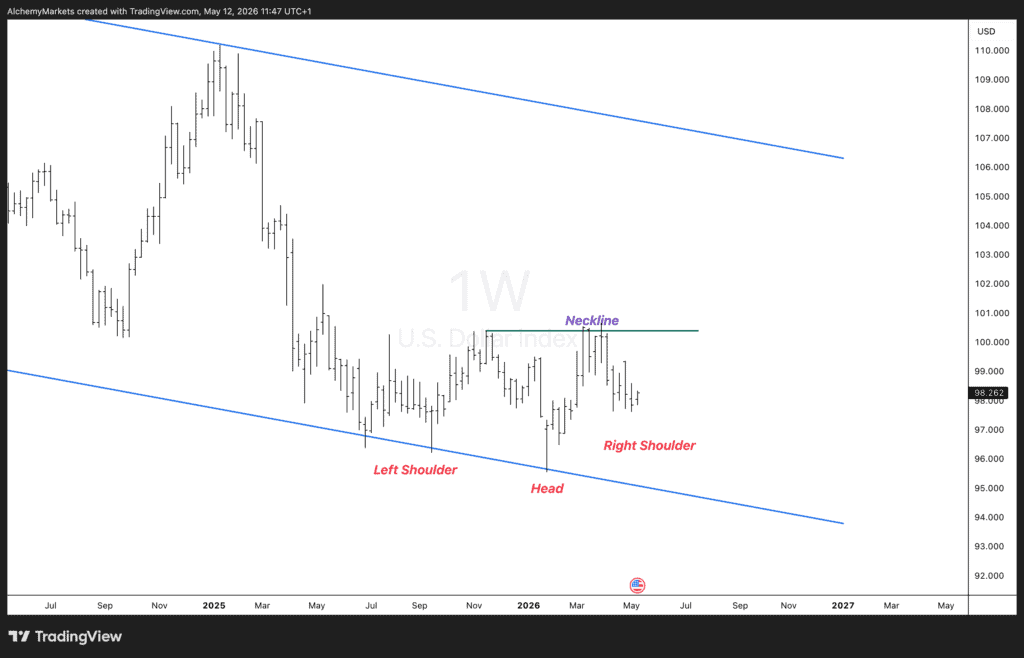
From a technical perspective, the US Dollar Index is sitting at an important inflection point.
The weekly chart continues to show a potential inverse head and shoulders formation developing within the broader descending channel. The neckline sits near the 100.50–101.00 region, which remains the key breakout area traders are watching closely.
If today’s CPI data comes in hotter than expected, that could provide the catalyst for a bullish breakout in the dollar. A stronger inflation print would likely drive Treasury yields higher and reinforce expectations that the Fed keeps rates elevated for longer — a combination that could trigger the inverse head and shoulders pattern and open the door toward a larger recovery move in the DXY.
However, if CPI lands broadly in line with expectations, the dollar may struggle to generate enough momentum for a breakout. In that case, the market may continue trading sideways as investors wait for clearer direction on inflation and Fed policy over the coming months.
For now, today’s CPI report looks set to determine whether the dollar finally breaks higher — or remains stuck consolidating within its broader range.
Alchemy Markets is a multi-asset brokerage providing retail traders with the same elite trading conditions, tools, and transparency typically reserved for institutions.
Select the categories and companies you wish to follow directly to your person rss feed.
Create Custom RSS FeedSign up and join over 5,000 professional members who receive personalized news alerts, curated professional connections, and more for free!
Retail futures trading leader NinjaTrader Group has appointed Mark Omens as Senior Vice President, Commercial Strategy, bringing a 25-year veteran of derivatives marketplace CME Group into a newly created role focused on exchange partnerships and enterprise growth.
Gold Price Action Forecast: Will XAU/USD Drop to $3930? Meta Description: Read our Gold price action forecast to see if XAU/USD will drop to $3930.
BitDelta Securities Financial Services LLC (“BitDelta Securities”) today announced that it has received full regulatory approval from the Capital Market Authority (“CMA”) of the United Arab Emirates under the Category 5 — Arrangement and Advice license framework (License No. 20200000439). The approval follows the firm's receipt of In-Principal Approval earlier this year and represents the successful conclusion of the CMA's full licensing process, including the satisfaction of capital requirements, governance appointments, and operational setup.
Crypto.com has received a $400 million strategic investment from Citadel Securities, valuing the firm at $20 billion. It marks the first institutional funding round in the company's history, aimed at accelerating its expansion into tokenised securities, derivatives and other asset classes.
WTI’s pullback into $79–82 is the first major test of the bullish Elliott Wave count, with buyers targeting a renewed break above $85.

BitDelta Securities has secured a full CMA Category 5 licence in the UAE and opened a regulated office in Business Bay, Dubai. The firm operates as an introducing broker, connecting investors with licensed international brokers across multiple asset classes, with CEO Dr. Demetrios Zamboglou commenting on the milestone.
Index volatility is asleep while single stocks fight it out underneath, credit refuses to confirm the equity rally, and a bare macro calendar hands next week to oil.
Digital assets and FX brokerage GC Exchange FZE (GCEX) has appointed Mohammed A. Mulla as a Board Member of its Dubai-based entity, part of the wider GCEX Group.
Learn what Blockchain-as-a-Service is, how it works, and why businesses are using BaaS to build blockchain applications without managing infrastructure.
CFDs vs stocks compared on leverage, ownership, costs, dividends, taxes, and risk. Learn the differences between stocks and CFDs and discover which suits your investing or trading goals.