just now


Liquidity Finder Ltd is incorporated in England and Wales, company number 10610740, registered address 167-169 Great Portland Street, Fifth Floor, London W1W 5PF, United Kingdom.
Published: just now

At a Glance
The Bureau of Labor Statistics will release the Consumer Price Index for September 2026 on Wednesday, October 14 at 8:30am ET. The Cleveland Fed's inflation nowcast, updated October 7, projects headline CPI at 3.6% year-over-year (+0.53% month-over-month) and core CPI at 2.4% year-over-year (+0.20% month-over-month). If realised, headline would accelerate from August's 3.4% while core would hold steady at its slowest annual pace since 2021.
The divergence between headline and core, nowcast at approximately 120 basis points, is the widest since the energy shock of March-June 2026. This gap is almost entirely a function of energy prices: Brent crude is trading above $105 per barrel, retail gasoline averaged $4.35 per gallon in September, and gasoline alone accounted for more than a third of the headline monthly increase in August. Strip out energy and the inflation picture looks markedly different.
This distinction matters for the October 27-28 FOMC meeting. The September CPI print is the last major inflation data point before Chair Warsh and the Committee convene. Markets are pricing a coin flip: CME FedWatch shows approximately 51% probability of a second consecutive 25-basis-point hike. The composition of the September print, not just the headline, will likely determine the outcome.
Where We Stand: August Recap
The August CPI report, released September 11, showed headline inflation holding at 3.4% year-over-year with a 0.4% monthly increase. Core CPI came in at 2.4% year-over-year, down from 2.5% in July and the slowest annual core reading since 2021. The monthly core reading of +0.3%, however, was above the consensus expectation of +0.2%, which the market characterised as a modest upside surprise.
The hot core MoM print, combined with core PCE running at 3.0% (100 basis points above the Fed's 2% target), provided the final catalyst for the September rate hike. The Fed raised rates 25 basis points to 3.75-4.00% on September 16 in a unanimous 12-0 vote, its first hike since July 2023. Chair Warsh's statement noted that the action would "support a timelier return to the Committee's 2 percent goal" but provided little forward guidance on the October decision.
CPI Trajectory: 2026 Year-to-Date
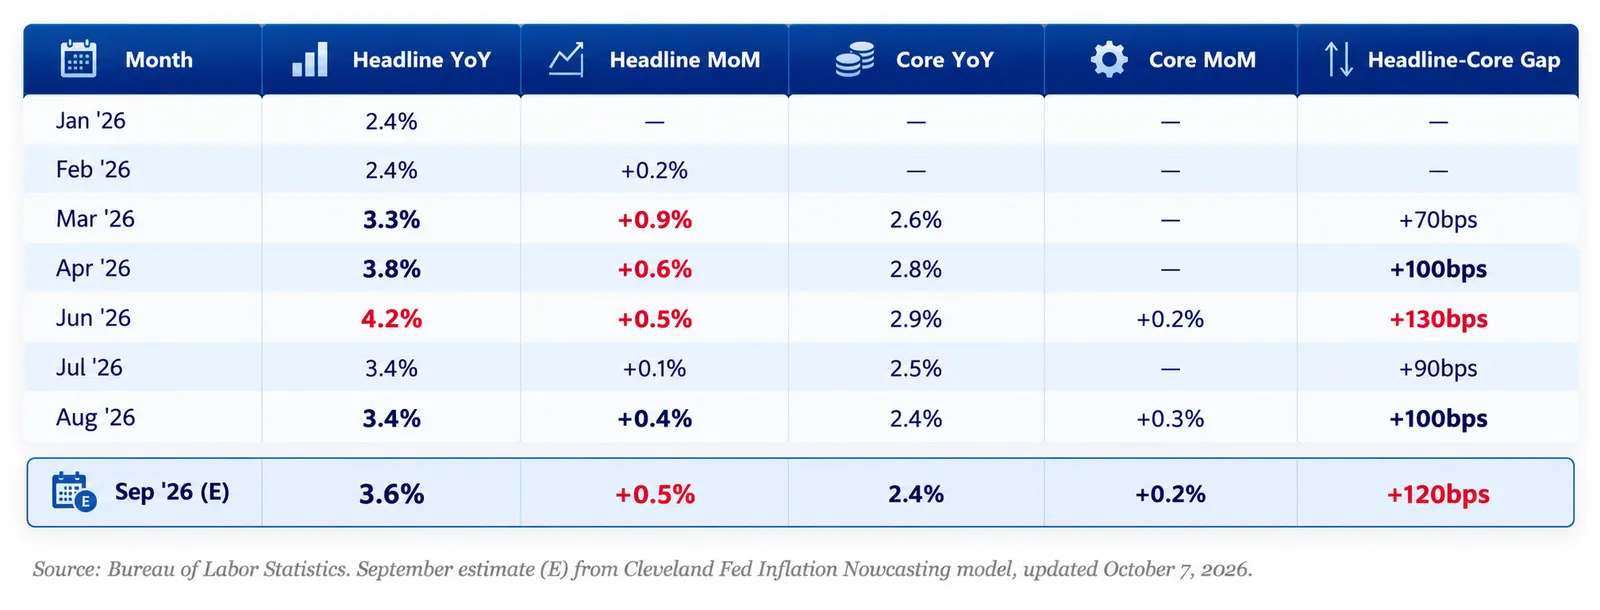
The trajectory tells a clear story. Headline CPI spiked from 2.4% in January to 4.2% in June as energy prices surged, then moderated to 3.4% in July-August as the month-over-month headline gains eased. The nowcast suggests September will re-accelerate to 3.6% on another hot monthly print (+0.53%). Core, by contrast, has been on a steady downward path: from 2.8% in April to 2.4% in August, and the nowcast expects it to hold at 2.4% with a benign +0.20% monthly gain.
The headline-core gap widened from effectively zero in early 2026 to 130 basis points at the June peak, compressed to 90-100 basis points in July-August, and is now expected to widen again to approximately 120 basis points. This volatility is almost exclusively driven by energy. Core goods inflation is running at just 0.7% year-over-year. Food inflation at 2.7% is moderate and stable. The price pressure in the economy is concentrated, not broad-based.
Component Breakdown: What's Driving What
Energy: The Headline Driver
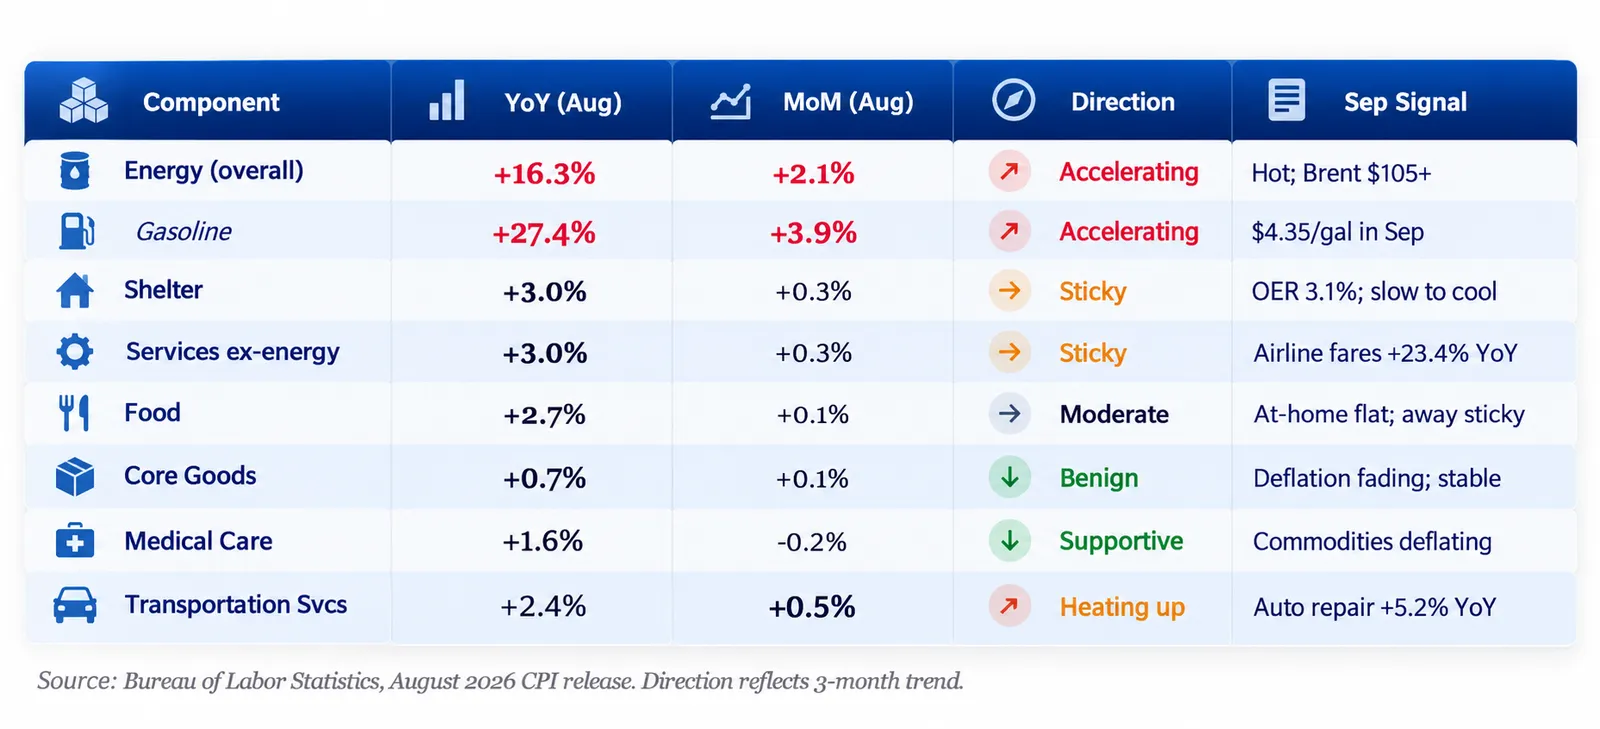
Energy is running at +16.3% year-over-year with gasoline at +27.4%, and September is unlikely to provide relief. Brent crude is trading above $105 per barrel, the EIA projects Q4 2026 Brent at $105, and retail gasoline averaged $4.35 per gallon in September, up from already elevated August levels. Diesel is averaging $5.19 per gallon for 2026, and East Coast distillate inventories are approximately 20% below the 2021-2025 average heading into winter. The energy component will continue to push headline CPI higher regardless of what happens in core.
The Middle East supply constraint is structural for now. The EIA expects oil flows to remain constrained through Q4, with convoys and alternative export routes only gradually raising output. Brent is not expected to decline meaningfully until 2027, when the EIA projects an average of $84 per barrel. For the purposes of the September CPI print and the October FOMC meeting, energy is a known headwind that is already priced into market expectations.
Shelter: Sticky but Directionally Lower
Shelter inflation at 3.0% year-over-year remains the largest single contributor to core CPI by weight (approximately one-third of the index). Owners' equivalent rent at 3.1% and rent of primary residence at 2.7% are both well below their 2023 peaks but remain above 2% and are declining slowly. The well-documented lag between market rents (which have been flat to negative in many metro areas for over a year) and the CPI shelter measure (which captures existing lease renewals) means the shelter component is likely to continue its gradual decline. But it will not fall fast enough to offset energy-driven headline pressure in the September print.
Services: The Sticky Middle
Services less energy at +3.0% year-over-year is the component the Fed watches most closely as a proxy for underlying inflation pressure. Within this category, the picture is mixed. Airline fares at +23.4% year-over-year reflect the pass-through of jet fuel costs. Motor vehicle maintenance and repair at +5.2% reflects labour and parts cost inflation in the services sector. Transportation services overall at +2.4% ran hot in August with a +0.5% monthly gain. Against this, motor vehicle insurance is deflating at -5.1% year-over-year, providing a meaningful offset. Communication services saw a record jump in wireless phone service prices in August (+2.3% MoM), which may or may not persist.
Goods and Food: The Stabilisers
Core goods at +0.7% year-over-year are the bright spot in the inflation picture. New vehicles at +0.6% and used cars at -2.3% reflect a normalised auto market. Medical care commodities are deflating at -2.7%. Food at home is flat month-over-month at +2.2% year-over-year, while food away from home at +3.4% reflects services-sector wage pass-through but is not accelerating. Neither goods nor food is a source of concern for the September print.
Fed Implications: The October Decision
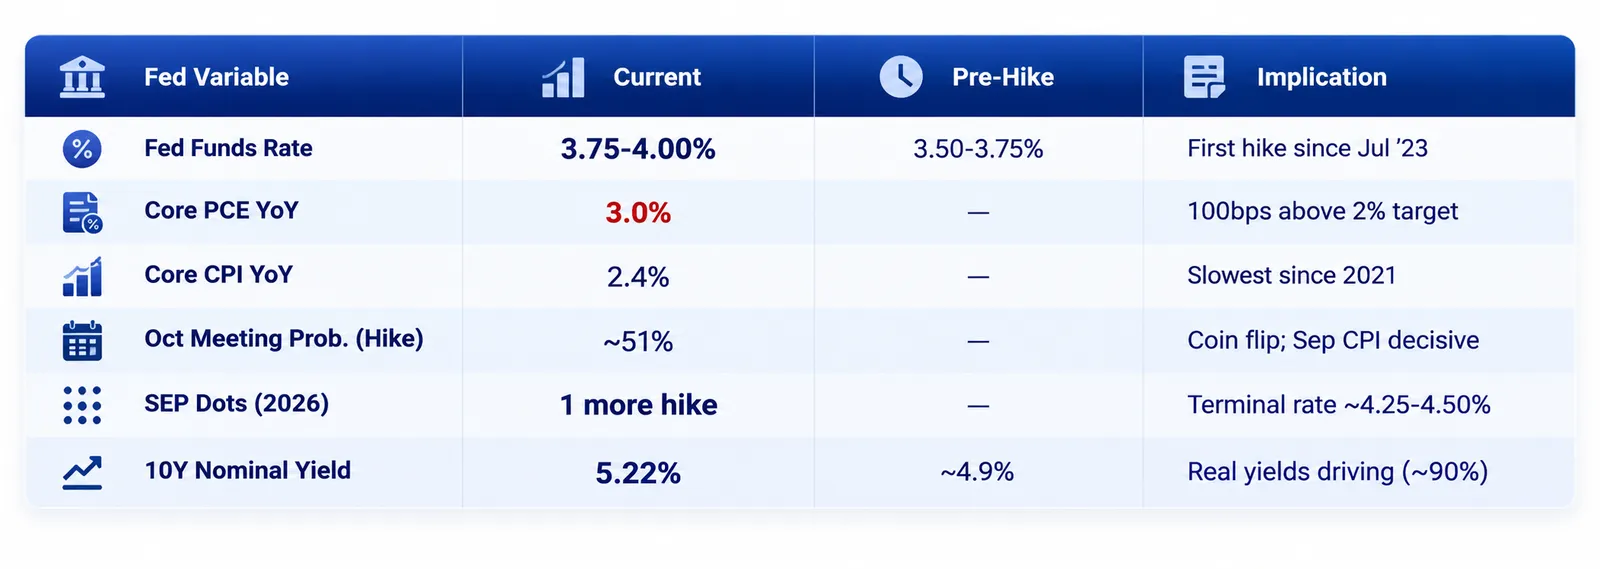
The September CPI release is the decisive data point for the October FOMC meeting. The Committee faces a genuine dilemma, and the composition of the print matters more than the headline number.
The case for a second hike: Headline CPI accelerating from 3.4% to 3.6% provides headline risk that the Committee cannot ignore, even if the move is energy-driven. Core PCE at 3.0% is 100 basis points above target and is the Fed's preferred inflation measure. The September Summary of Economic Projections pointed to one more hike in 2026. If the September CPI confirms the nowcast, Chair Warsh has a clear mandate to follow through on the dot plot guidance. Real average hourly earnings fell 0.3% year-over-year in August, meaning inflation is eroding real purchasing power, which the Committee may cite as justification for further tightening.
The case for a hold: Core CPI at 2.4% is at its slowest pace since 2021 and is within striking distance of the 2% target. The headline-core divergence of 120 basis points is almost entirely energy, which monetary policy cannot address. Raising rates does not lower the price of Brent crude. Shelter is cooling directionally. Core goods are benign. The economy has already absorbed 25 basis points of tightening and long-end yields have risen approximately 100 basis points since June, providing significant financial tightening through the market channel. Hiking into an energy shock risks over-tightening into a demand environment that is already softening in rate-sensitive sectors.
The bottom line: The September CPI print will determine whether the Committee sees the current inflation environment as a broad-based resurgence or a narrow energy-driven phenomenon that is already being addressed by financial conditions. If core comes in at or below the nowcast (+0.20% MoM), the hold case strengthens materially. If core surprises hot, as it did in August (+0.3% vs +0.2% expected), the hike becomes near-certain.
What to Watch in the September Print
1. Core CPI month-over-month. This is the single most important number. The nowcast expects +0.20%. Anything at or below that level supports the narrative that underlying inflation is cooling. A reading above +0.25% would be the third consecutive hot core MoM print and would significantly raise the probability of an October hike.
2. Shelter momentum. August's +0.3% MoM was a re-acceleration from July's +0.1%. Watch whether September continues the downward trend or whether August was the start of a shelter reflation. The market-rent-to-CPI lag argues for continued disinflation, but the August reading introduced uncertainty.
3. Services ex-shelter, ex-energy. This is the super-core measure that strips out the two noisiest components. It captures the underlying services inflation that is most responsive to monetary policy. If super-core is decelerating, the Fed can credibly argue that its tightening is working and that further hikes are unnecessary.
4. Gasoline contribution to headline. In August, gasoline accounted for more than a third of the headline monthly increase. The September number will reveal whether the energy pass-through is intensifying or stabilising at current levels. A gasoline MoM reading above +4% would signal further headline acceleration into Q4.
5. Real average hourly earnings. The BLS releases real earnings data alongside the CPI report. August showed -0.3% year-over-year decline in real hourly earnings. If real earnings continue to decline, the political pressure on the Fed intensifies: workers are losing purchasing power, and the Committee must weigh whether further rate increases help or hurt that dynamic.
BitDelta Pro Research
October 2026
This document is prepared by BitDelta Pro Research Team for informational purposes only and does not constitute investment advice, a solicitation, or a recommendation to buy or sell any financial instrument. The information herein is based on publicly available data from the Bureau of Labor Statistics, Cleveland Federal Reserve, U.S. Energy Information Administration, CME Group, and other third-party sources. Forward-looking estimates are subject to revision. Past performance is not indicative of future results.
BitDelta Securities Financial Services LLC, regulated by the Capital Market Authority under Category 5, acts solely as an introducer and does not provide trading, execution, dealing, advisory, portfolio management, or custody services. All trading, execution, and investment-related services are provided by BitDelta Limited, Mauritius, a licensed Investment Dealer excluding underwriting.
Readers should seek independent professional advice and conduct their own due diligence before making any decisions. Neither the publisher nor the contributors accept liability for any loss arising from reliance on this content.
Institutional multi-asset market access across MT5 Ultency, CQG, Iress Pro and BitDelta Terminal, with transparent execution standards and global market coverage.

Select the categories and companies you wish to follow directly to your person rss feed.
Create Custom RSS Feed
just now

just now
Sign up and join over 5,000 professional members who receive personalized news alerts, curated professional connections, and more for free!
September's US inflation report could be a defining moment for the Federal Reserve's next interest rate decision. With headline inflation expected to accelerate while core inflation remains steady, the growing divergence raises an important question: Is inflation pressure becoming more widespread, or is energy driving the narrative? Ahead of the October 14 CPI release, BitDelta Pro Research examines the forces shaping inflation expectations, the signals policymakers may prioritise, and what the data could mean for the Fed's next move.
BingX has launched US stock trading through an integration with Alpaca, giving eligible users access to more than 7,000 US stocks and ETFs. Trades can be funded with USDT and USDC, start from $5 and run 24 hours a day, five days a week. A $200,000 Stocks Mystery Box promotion runs from 9 to 23 October 2026.
Bybit has opened stocks trading to eligible users, offering access to more than 1,000 U.S.-listed stocks and ETFs funded in USDC. Orders are executed through Alpaca, with 24/5 trading, fractional shares and zero commission on eligible trades, plus support for dividends and stock splits. Users must complete KYC checks.
AUDCAD price forecast tracks a bullish retest of 0.99265–0.99450 toward 0.99940, with a weekly support breakdown putting 0.98740 in focus.
Visa has received approval of its Application to Prepare from the People's Bank of China, allowing it to begin formal preparations to establish a domestic bankcard clearing institution in China. The company will now work to complete the process under PBOC regulations before starting domestic clearing operations in the country.
Plus500 has conditionally agreed to acquire Hedge Capital Markets, an SEC-registered US broker-dealer, marking its entry into US securities. The cash-funded deal supports a planned US super-app in Q1 2027 combining futures, prediction markets, stocks, options and ETFs, plus a new hub in New York.
MAS Markets has appointed Simon Naish as Head of APAC to lead its plans across the Asia-Pacific region. Naish brings over 30 years of experience in institutional banking and FX, most recently as Country Head at ATFX Global and previously 33 years at National Australia Bank (NAB) across Asia-Pacific and global markets.
BTCUSD rejects $78,400–$82,175 support. Watch bullish follow-through toward $86,550 and a daily close below $80,268.75 for weakness.
Gold price forecast: Watch $4,175–$4,190 support for bullish confirmation toward $4,265, or a weekly support breakdown toward $3,935.
WTI crude oil price forecast: A confirmed breakout above $94.765 could open the way toward $100.305, while weekly support remains at $87.360–$90.830.