
just now


Liquidity Finder Ltd is incorporated in England and Wales, company number 10610740, registered address 167-169 Great Portland Street, Fifth Floor, London W1W 5PF, United Kingdom.
Published: just now

The week began with investors attempting to recover from the previous week’s selloff. US futures strengthened on Monday, and technology stocks rebounded on Wednesday as investors responded to strong AI-related revenue growth and a busy earnings calendar. By Wednesday’s close, the Nasdaq Composite had gained 1.05%, the S&P 500 had risen 0.58%, and the Dow had advanced 0.69%.
However, the recovery proved fragile. On Thursday, the Nasdaq fell 2.60%, its steepest one-day decline since early June, while the S&P 500 dropped 1.21%. The Dow was more resilient, edging up 0.02%. Semiconductor stocks were particularly weak, with the Philadelphia Semiconductor Index falling 6.7%.
Brent climbed above $110 per barrel on Thursday after fresh attacks raised concerns about regional escalation and potential disruptions to energy infrastructure and shipping. WTI crude also approached $99 per barrel.
The key risk is that higher oil prices feed into transportation, manufacturing, and consumer fuel costs, keeping inflation elevated and making it harder for central banks to ease policy. Oil-related inflation concerns also contributed to the pressure on gold and risk-sensitive technology stocks.
Outlook: Oil will remain highly sensitive to developments involving Iran, Saudi Arabia, the Houthis, and shipping through the Strait of Hormuz. Any escalation or sustained disruption could lift prices further. Credible de-escalation or improved supply availability could trigger a pullback.
Gold extended its decline and fell below $4,100, with price settling at $4,042 per ounce on Thursday. Rising energy prices increased inflation concerns and strengthened expectations that the Federal Reserve might need to keep interest rates higher for longer.
Gold’s reaction highlights an important market dynamic, although geopolitical risks usually support safe-haven demand, higher oil prices can also push yields and the dollar higher, making a non-yielding asset such as gold less attractive.
Outlook: The $4,000 area is an important psychological level to watch. Persistent inflation and hawkish Fed expectations could keep gold under pressure, while a retreat in yields, a weaker dollar, or a sharper geopolitical shock could help stabilize prices.
Next week could be pivotal for global markets, with the Fed’s interest-rate decision, US GDP and PCE inflation data, and the ECB meeting all arriving within three days.
US PCE inflation: The most important data release: The September Personal Consumption Expenditures (PCE) price index is scheduled for Thursday, 29 October. PCE is the Fed’s preferred inflation measure, and the core reading, excluding food and energy, will be especially important given the recent rise in oil prices.
How the PCE result could affect markets
Hotter-than-expected inflation
Higher yields and a stronger dollar become more likely, equities and gold could face renewed pressure as markets price in a more hawkish Fed.
Cooler-than-expected inflation
Yields and the dollar could ease, supporting equities and gold if investors become more confident that further tightening can be avoided.
The Fed meets on 27–28 October, with the policy decision scheduled for Wednesday. Markets have been leaning toward a pause at this meeting, while elevated inflation and energy costs have kept the possibility of another rate hike later in the year alive. The decision itself may be less important than the Fed’s explanation of how it views the balance between inflation and economic growth. If policymakers emphasize persistent price pressures, yields and the dollar could rise. If they signal patience, risk assets could recover.
The ECB’s meeting on Thursday will also matter for EUR/USD, particularly given the pressure on French bonds and the euro’s recent weakness
| Date | Metric | Country | Previous | Time [Dubai] |
| Tuesday, 27 October | Durable Goods Orders | USA | -0.1% | 4:30 PM |
| Tuesday, 27 October | CB Consumer Confidence | USA | 81.9 | 6:00 PM |
| Tuesday, 27 October | New Home Sales | USA | 684K | 6:00 PM |
| Wednesday, 28 October | Consumer Price Index y/y | Australia | 4.0% | 4:30 AM |
| Wednesday, 28 October | Interest Rate Decision | New Zealand | 2.75% | 5:00 AM |
| Wednesday, 28 October | Annual Budget Release | UK | 4:30 PM | |
| Wednesday, 28 October | Interest Rate Decision | Canada | 2.25% | 5:45 PM |
| Wednesday, 28 October | Interest Rate Decision | USA | 4.00% | 10:00 PM |
| Thursday, 29 October | Gross Domestic Product q/q | USA | 2.2% | 4:30 PM |
| Thursday, 29 October | Core PCE Price Index m/m | USA | 0.2% | 4:30 PM |
| Thursday, 29 October | Unemployment Claims | USA | 4:30 PM | |
| Thursday, 29 October | Interest Rate Decision | Euro | 2.65% | 5:15 PM |
| Friday, 30 October | Tokyo Core CPI y/y | Japan | 2.7% | 3:30 AM |
| Friday, 30 October | Interest Rate Decision | Japan | 1.25% | 7:00 AM |
EURUSD is trading at 1.1197, extending its broader decline after reaching a high of 1.1710 in August. The daily chart shows a clear sequence of lower highs and lower lows, with selling pressure accelerating from mid-September.
The moving averages confirm the bearish structure. The short-term averages are clustered together, reflecting consolidation after the recent decline, but the 20-day moving average remains above the shorter-term averages and is still trending downward.
Immediate support lies around 1.1190–1.1180, followed by 1.1150 and the recent low at 1.1112. A decisive break below 1.1112 would reinforce the bearish trend and expose further downside. On the upside, initial resistance is located around 1.1218–1.1233, followed by 1.1250–1.1280. A sustained move above 1.1280 would improve the recovery outlook, although a more convincing reversal would require the pair to break above subsequent lower highs. Overall, EURUSD remains bearish, with the current price action suggesting that rallies may continue to attract sellers unless the pair can reclaim the 1.1233–1.1280 resistance zone.
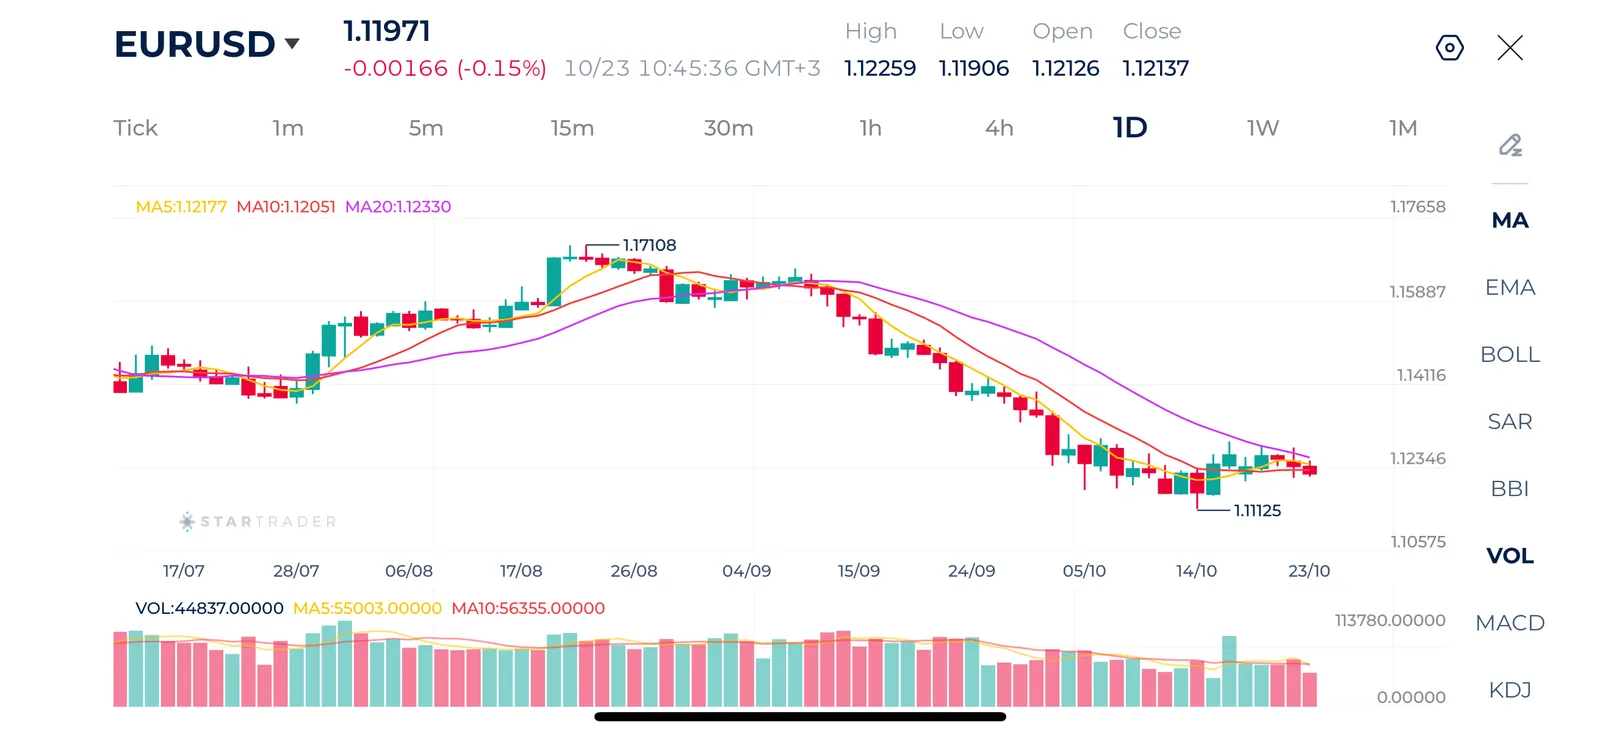
Source: STARTRADER app | EURUSD slightly rebounds from 1.1100 psychological level, but the overall trend remains bearish
| Resistance | 1.1250 - 1.1256 | 1.1285 - 1.1290 | 1.1346 - 1.1350 |
| Support | 1.1150 - 1.1154 | 1.1100 - 1.1112 | 1.1070 - 1.1073 |
Nasdaq 100 is trading at 29,014. The broader daily structure has weakened considerably. The index has fallen sharply from its October high, broken below the 30,000 psychological level, and moved toward the 29,000 area.
The moving averages point to continued downside pressure. The index is trading below all 5-day, 10-day, and 20-day moving averages, which are aligned bearishly.
Immediate support lies around 28,873, followed by the 28,500 area. A break below 28,873 could expose further downside toward 28,000. On the upside, initial resistance lies around 29,400–29,450, followed by 29,750 and 30,270. A recovery above 29,750 would indicate that selling pressure is easing, while a sustained move above 30,270 would provide stronger evidence of a broader recovery. Overall, the technical outlook remains bearish despite the modest intraday rebound, with the 29,400–29,750 zone representing an important test for buyers.
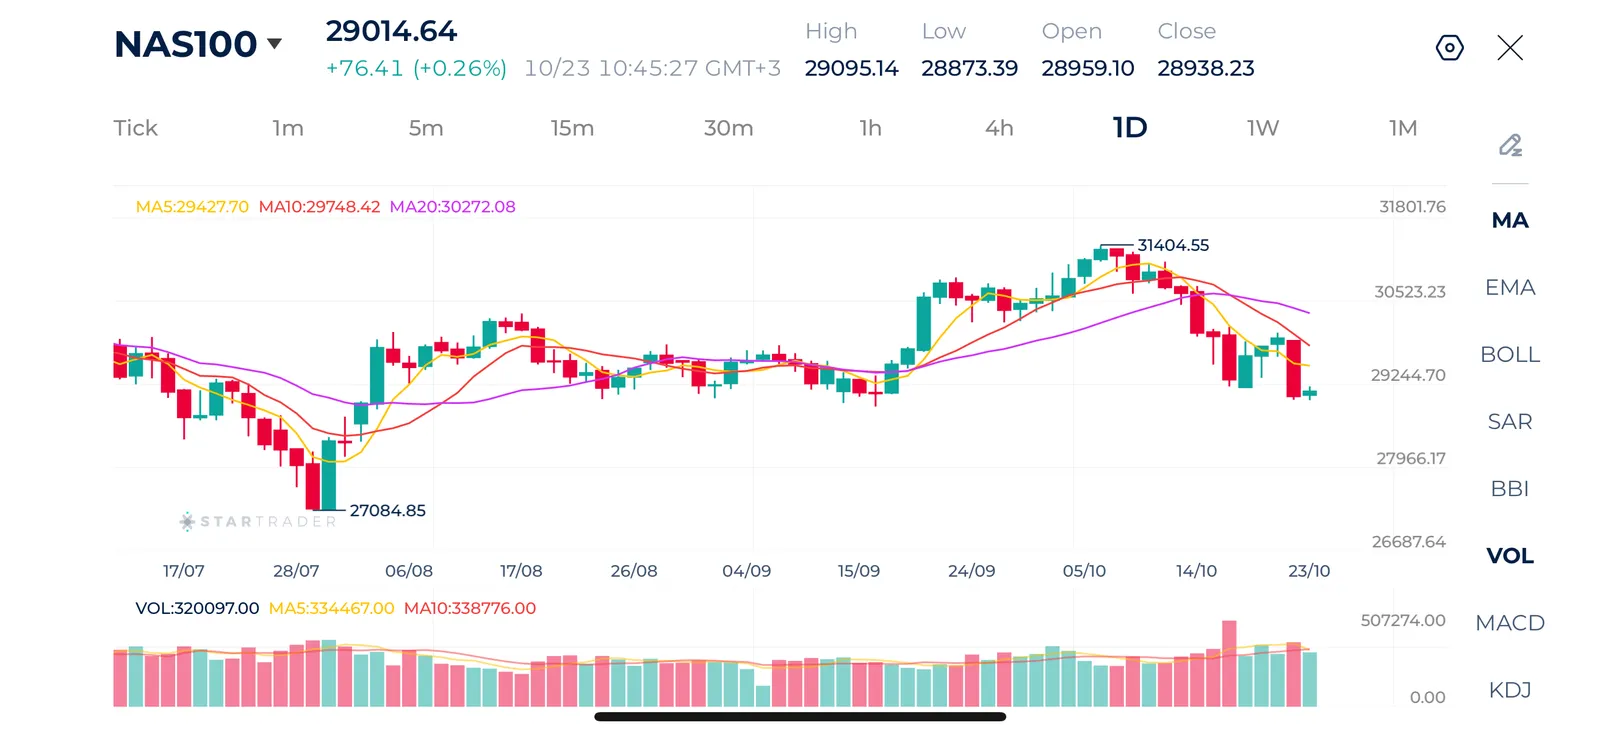
Source: STARTRADER app | AI stock sell-off brings the Nasdaq down to 29,000 levels
| Resistance | 29,750 - 29,800 | 30,570 - 30,595 | 31,400 - 31,422 |
| Support | 28,500- 28,512 | 27,967 - 28,000 | 27,084 - 27,100 |
Brent crude is trading at $114.84. Price is showing a clear upward movement on the daily chart, breaking above the previous trading range and approaching the latest high of $115.52.
The moving averages confirm the bullish trend. Price is trading comfortably above the 5-day, 10-day, and 20-day moving averages, which are aligned in bullish order. The latest price action also shows a renewed move toward the upper end of the recent range, supporting the possibility of further gains if resistance is broken.
Immediate resistance lies at $115.52, followed by the $117.00 area. A decisive break above $115.52 could open the way toward $117.00 and potentially $119.00. On the downside, initial support lies around $112.20, followed by $110.85 and the broader $108.25 area. A pullback toward the moving averages would not necessarily invalidate the bullish trend, provided buyers defend these levels. However, a sustained move below $108.25 would significantly weaken the current structure. Overall, Brent maintains the strongest bullish technical outlook among the four instruments, with a breakout above $115.52 representing the key confirmation for further upside.
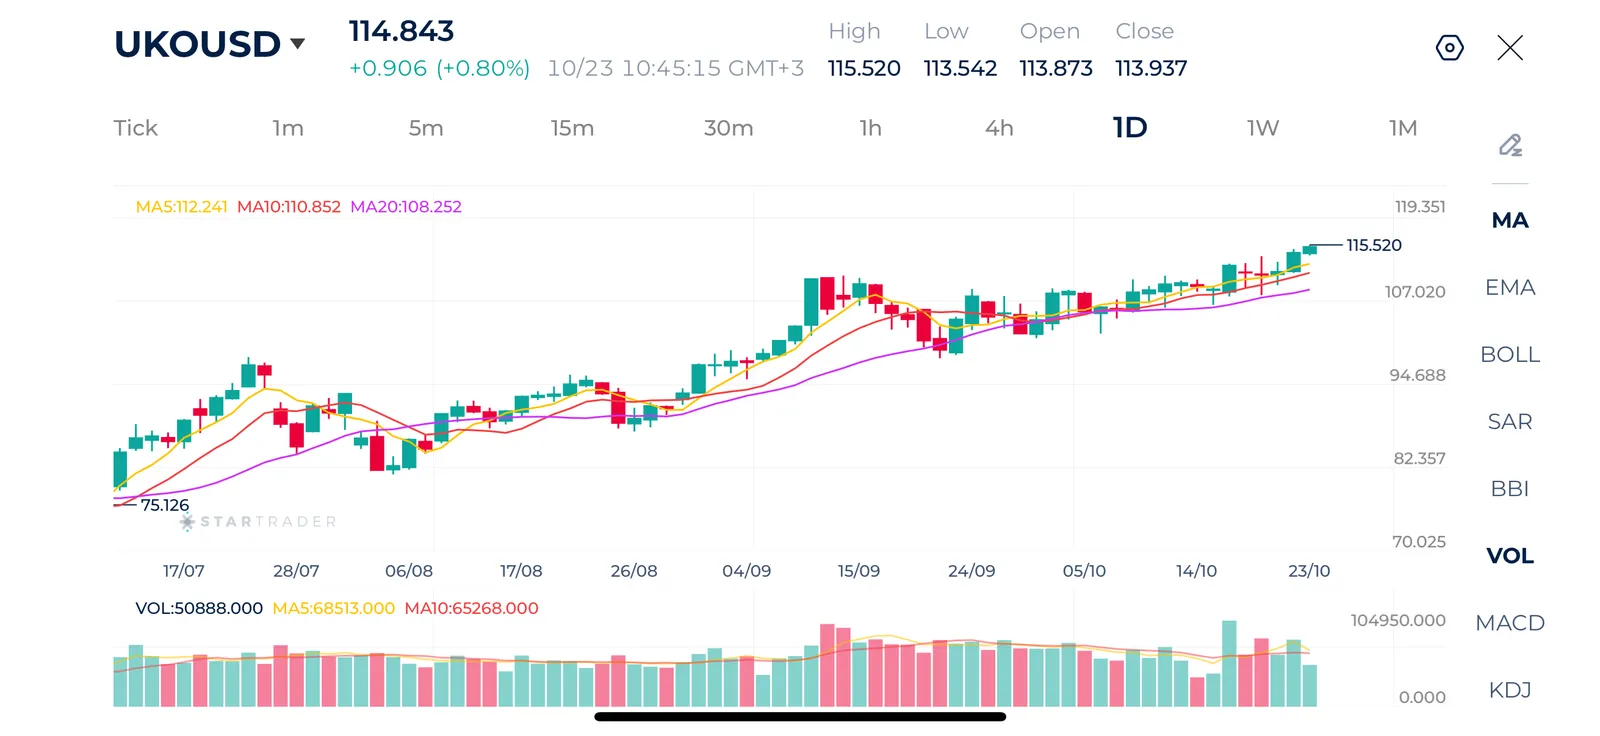
Source: STARTRADER app | Brend crude approaches the yearly high as concerns about renewed strikes ignite supply fears
| Resistance | $117.00 - $117.12 | $118.34 - $118.50 | $119.35 - $119.46 |
| Support | $112.00 -$112.20 | $110.64 - $110.85 | $108.25 - $108.44 |
Gold is trading at $4,018, extending its correction from the August peak of $4,696. The daily chart shows a sustained sequence of lower highs and lower lows. After consolidating around the $4,110–$4,150 area in recent sessions, gold has broken lower and is now approaching the psychologically important $4,000 level.
The moving averages reinforce the bearish outlook. Gold is trading below all 5-day, 10-day, and 20-day moving averages, which are aligned in bearish order. The latest decline has also coincided with elevated volume relative to several preceding sessions, suggesting that the break below the consolidation area has attracted additional selling activity.
Immediate support lies around $4,000, followed by $3,986, and the broader $3,950 area. A sustained break below $3,986 could accelerate selling toward $3,950. On the upside, initial resistance is located around $4,090–$4,100, followed by $4,122–$4,137. Gold would need to recover above these moving averages to signal that bearish momentum is easing. A sustained move above $4,137 would offer stronger evidence of stabilization, although a full reversal would require a break through additional resistance levels. Overall, gold remains bearish, with the $4,000 psychological level and the nearby session low representing the next important downside test.
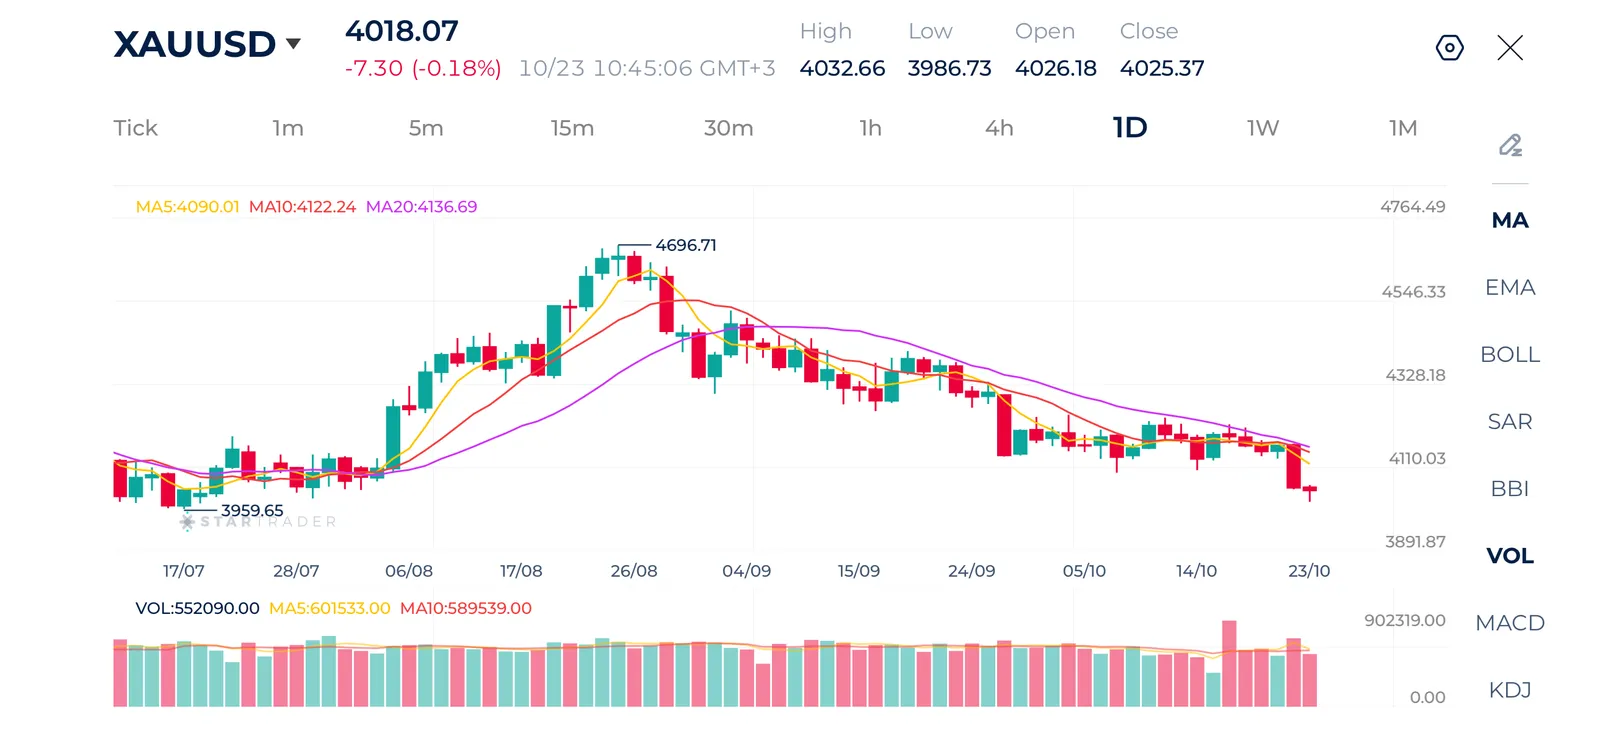
Source: STARTRADER app | Rising yields and rate hike expecations remain a negative force pressuring gold prices
| Resistance | $4,137 - $4,150 | $4,200 - $4,212 | $4,357 - $4,370 |
| Support | $3,970 - $3,986 | $3,944 - $3,959 | $3,877 - $3,890 |
Risk Disclaimer: This material is provided for informational purposes only and does not constitute a recommendation or investment advice. Trading financial instruments on margin involves substantial risk and may not be appropriate for all investors.
STARTRADER is a global multi-asset broker empowering retail and institutional partners to access global markets through a range of platforms, including MetaTrader, STAR-APP, and STAR-COPY.

Select the categories and companies you wish to follow directly to your person rss feed.
Create Custom RSS FeedSign up and join over 5,000 professional members who receive personalized news alerts, curated professional connections, and more for free!
Theorem has integrated Symbiotic’s Liquid Lane RFQ network, letting holders of tokenised real-world assets trade against on-chain pool liquidity and market-maker quotes. The integration is live on Ethereum, with Midas’s yield-bearing mHYPER fund as the first supported asset. Holders can trade for the USDC stablecoin.
US equities were volatile with technology selloff erasing much of the earlier rebound.
FM Summit London 2026 returns to Old Billingsgate on 24 November for its 15th edition, with LMAX Group, Plus500 and oneZero among confirmed exhibitors. The one-day event adds Business Connect meetings and roundtables, and opens with a networking evening at The Folly on 23 November.
Finance Magnates Summit London returns to Old Billingsgate on 24 November 2026 for its 15th edition. The one-day event brings together brokers, liquidity providers, institutional firms, trading technology vendors, payments businesses and digital asset firms.
iSAM Securities Apex has integrated with Match-Prime, giving brokers access to liquidity across more than 2,000 instruments, with tailored pricing and up to 10 levels of market depth.
propfunding.com's free-entry instant funding changes the order of prop funding. Start trading first. Its free-entry instant funding model offers two qualification attempts without an upfront activation fee.
US stocks closed higher on Wednesday, with the Nasdaq gaining 1%, the S&P 500 rising 0.6%, and the Dow advancing 0.7%, as renewed enthusiasm for AI-related stocks lifted market sentiment.
SpaceX went public in June as a rocket company. On October 20 it reported as something else entirely: an AI infrastructure business, financed by a satellite broadband network, with a launch division attached. Rockets generated 12% of third quarter revenue and lost money. The AI segment generated 52% of revenue and consumed 84% of capital expenditure. Starlink generated 85% of operating profit.
Standard Chartered has signed definitive agreements to acquire 100% of Zodia Custody UK Limited, folding its regulated digital asset custody business into Securities Services. Zodia Solutions will be set up under SC Ventures with bank investors including Northern Trust, NAB Ventures, Emirates NBD and Investcorp.
Bybit Fintech FZE has secured a Virtual Asset Service Provider licence from Dubai’s Virtual Assets Regulatory Authority for Exchange Services, covering spot trading. Bybit’s Peter Loo said the firm hopes to add derivatives, subject to regulatory approvals. Its international Dubai headquarters opened in 2022.