just now

Liquidity Finder Ltd is incorporated in England and Wales, company number 10610740, registered address 167-169 Great Portland Street, Fifth Floor, London W1W 5PF, United Kingdom.
Published: just now

The Consumer Price Index (CPI) is the benchmark inflationary gauge that dictates the trajectory of global financial markets. This is like a monthly price tag for the overall cost of living.
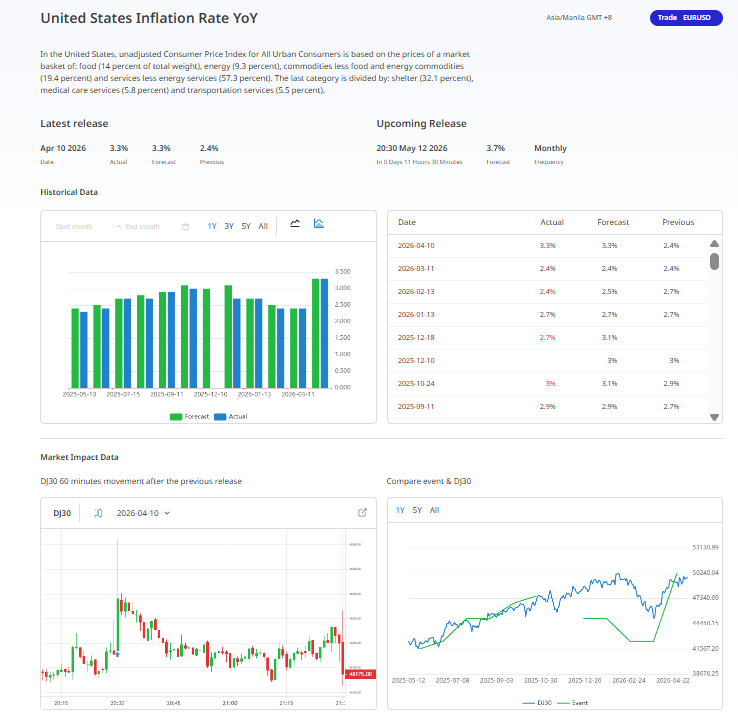
To determine the CPI data, government agencies such as the Bureau of Labor Statistics (BLS) monitor a massive market basket containing thousands of goods and services. This basket is divided into several key sectors:
This is differentiated between two primary versions of the index:
Why the CPI data Dictates Market Policy
Traders wait for news. Once the data comes out, the market reaction begins immediately. This response is the real trigger. The numbers just sit on a page until buyers make their move. Ultimately, human behavior is what truly shifts prices today. Crowds buy and sell. Prices move, in fact, on the basis of how these traders react to the information.
An increase or surge in price which means if the inflation (measured by CPI) gets out of hand, central banks will raise interest rates to try to reduce spending and slow the economy.
A declining in price levels which means that if the CPI data is too low, the banks may possibly lower the interest rates to make borrowing cheaper and boost economic activity.
In a typical Consumer Price Index report, two comparative numbers that are emphasized:
• The Year-over-Year data or YoY. Compares price changes today to the same period 12 months ago, example if prices are up 3.5% from last year.
• The Month-over-Month data or MoM. How much did something change from the previous month, example if prices rose 0.3% from last month.
An increasing CPI indicates that your currency's purchasing power is eroding. Conversely, a stable or declining CPI suggests that your money maintains its value over time.
Trading CPI data is ultimately about timing the Expectation Mismatch. Markets don't just react to the statistics; they react to how much the reality differs from what everyone thought would happen.
Before the news drops, check an economic calendar for these key figures:
Example below how the DJ30 reacted from the Inflation data.
The Breakout: Setting orders slightly above and below the price just before the announcement to catch a fast move in either direction.
The Second Chance (Recommended): Wait 10 minutes for the high market movements or volatility to end. Enter your trade only after the price settles and starts moving steadily in one direction.
The Core Filter: If the main number looks good but the Core CPI (which ignores food/gas) looks bad, trust the Core. Big banks and central banks pay more attention to the Core.
Selecting the ideal timeframe is a direct result of your chosen strategy. Because a CPI release triggers such rapid, high-intensity price action, standard slow charts like the Daily (D1) or 4-Hour (H4) will fail to show the immediate volatility you need to execute a trade.
•M1 For the Breakout, you may need the 1-Minute or M1 chart so you can see the exact second that the price explodes out of its pre-news range.
• Second chance the initial spike, take either the 5 minute or M5 or 15 minute or M15 chart. They are detailed to identify a pullback or retest, but without the noise of the 1-minute chart.
• M15 for retests. Core filter, priority on 15 Minute (M15) to 1 Hour (H1) charts.
To sum up, while the 4-hour chart conveys you the story of the week, The lower timeframes, like M1 through M15 are, like your binoculars. They help you see the moment when the data hits the market.
Explore my portfolio for further insights:
DAX(GER30): How the index will weather the twin shocks of wholesale inflation and shrinking output?
EURUSD: Trading EUR/USD Through High Oil an Rate Volatility
EURUSD Outlook: Interest Rate Pair to Energy Security Pair
GBPUSD: Inflation vs. Geopolitics: What Will Break the GBPUSD Consolidation?
USDJPY: Key Breakout or Imminent Bull Trap After Japan’s CPI?
NASDAQ100: Breakout or Breakdown for the Nasdaq?
Disclaimer: This content may have been written by a third party. ACY makes no representation or warranty and assumes no liability as to the accuracy or completeness of the information provided, nor any loss arising from any investment based on a recommendation, forecast or other information supplies by any third-party. This content is information only, and does not constitute financial, investment or other advice on which you can rely.
ACY Securities is one of Australia's fastest growing multi-asset online trading providers, offering ultra-low-cost trading, rock-solid execution, technologically superior account management and premium market analysis.
Select the categories and companies you wish to follow directly to your person rss feed.
Create Custom RSS FeedSign up and join over 5,000 professional members who receive personalized news alerts, curated professional connections, and more for free!
Gold Price Action Forecast: Will XAU/USD Drop to $3930? Meta Description: Read our Gold price action forecast to see if XAU/USD will drop to $3930.
BitDelta Securities Financial Services LLC (“BitDelta Securities”) today announced that it has received full regulatory approval from the Capital Market Authority (“CMA”) of the United Arab Emirates under the Category 5 — Arrangement and Advice license framework (License No. 20200000439). The approval follows the firm's receipt of In-Principal Approval earlier this year and represents the successful conclusion of the CMA's full licensing process, including the satisfaction of capital requirements, governance appointments, and operational setup.
Crypto.com has received a $400 million strategic investment from Citadel Securities, valuing the firm at $20 billion. It marks the first institutional funding round in the company's history, aimed at accelerating its expansion into tokenised securities, derivatives and other asset classes.
WTI’s pullback into $79–82 is the first major test of the bullish Elliott Wave count, with buyers targeting a renewed break above $85.

BitDelta Securities has secured a full CMA Category 5 licence in the UAE and opened a regulated office in Business Bay, Dubai. The firm operates as an introducing broker, connecting investors with licensed international brokers across multiple asset classes, with CEO Dr. Demetrios Zamboglou commenting on the milestone.
Index volatility is asleep while single stocks fight it out underneath, credit refuses to confirm the equity rally, and a bare macro calendar hands next week to oil.
Digital assets and FX brokerage GC Exchange FZE (GCEX) has appointed Mohammed A. Mulla as a Board Member of its Dubai-based entity, part of the wider GCEX Group.
Learn what Blockchain-as-a-Service is, how it works, and why businesses are using BaaS to build blockchain applications without managing infrastructure.
CFDs vs stocks compared on leverage, ownership, costs, dividends, taxes, and risk. Learn the differences between stocks and CFDs and discover which suits your investing or trading goals.
Want to master the markets? A winning trading mindset beats a perfect strategy. Learn how emotional discipline helps you conquer fear and avoid heavy losses.


