just now

Liquidity Finder Ltd is incorporated in England and Wales, company number 10610740, registered address 167-169 Great Portland Street, Fifth Floor, London W1W 5PF, United Kingdom.
Published: just now
By now, you’ve likely realized something important about MACD:
On its own, it’s informative - but incomplete.
This is where most traders either level up or spiral into confusion.
Some traders refuse confluence entirely, believing one indicator should be enough.
Others stack too many indicators, hoping quantity will replace clarity.
Professionals sit in the middle.
They don’t stack tools to increase signals.
They stack tools to eliminate weak ones.
MACD’s role in confluence is simple:
Confirm momentum where other tools already suggest opportunity.
Markets are probabilistic.
No indicator, pattern, or setup guarantees outcome.
What increases probability is alignment.
When:
…all point in the same direction, decision-making becomes calmer and more disciplined.
MACD helps answer one key question in confluence:
Is momentum actually supporting this idea?
Moving averages define structure and bias.
MACD confirms energy within that structure.
This signals a healthy trend, not exhaustion.
When MACD contradicts EMA direction, professionals pause - not force trades.
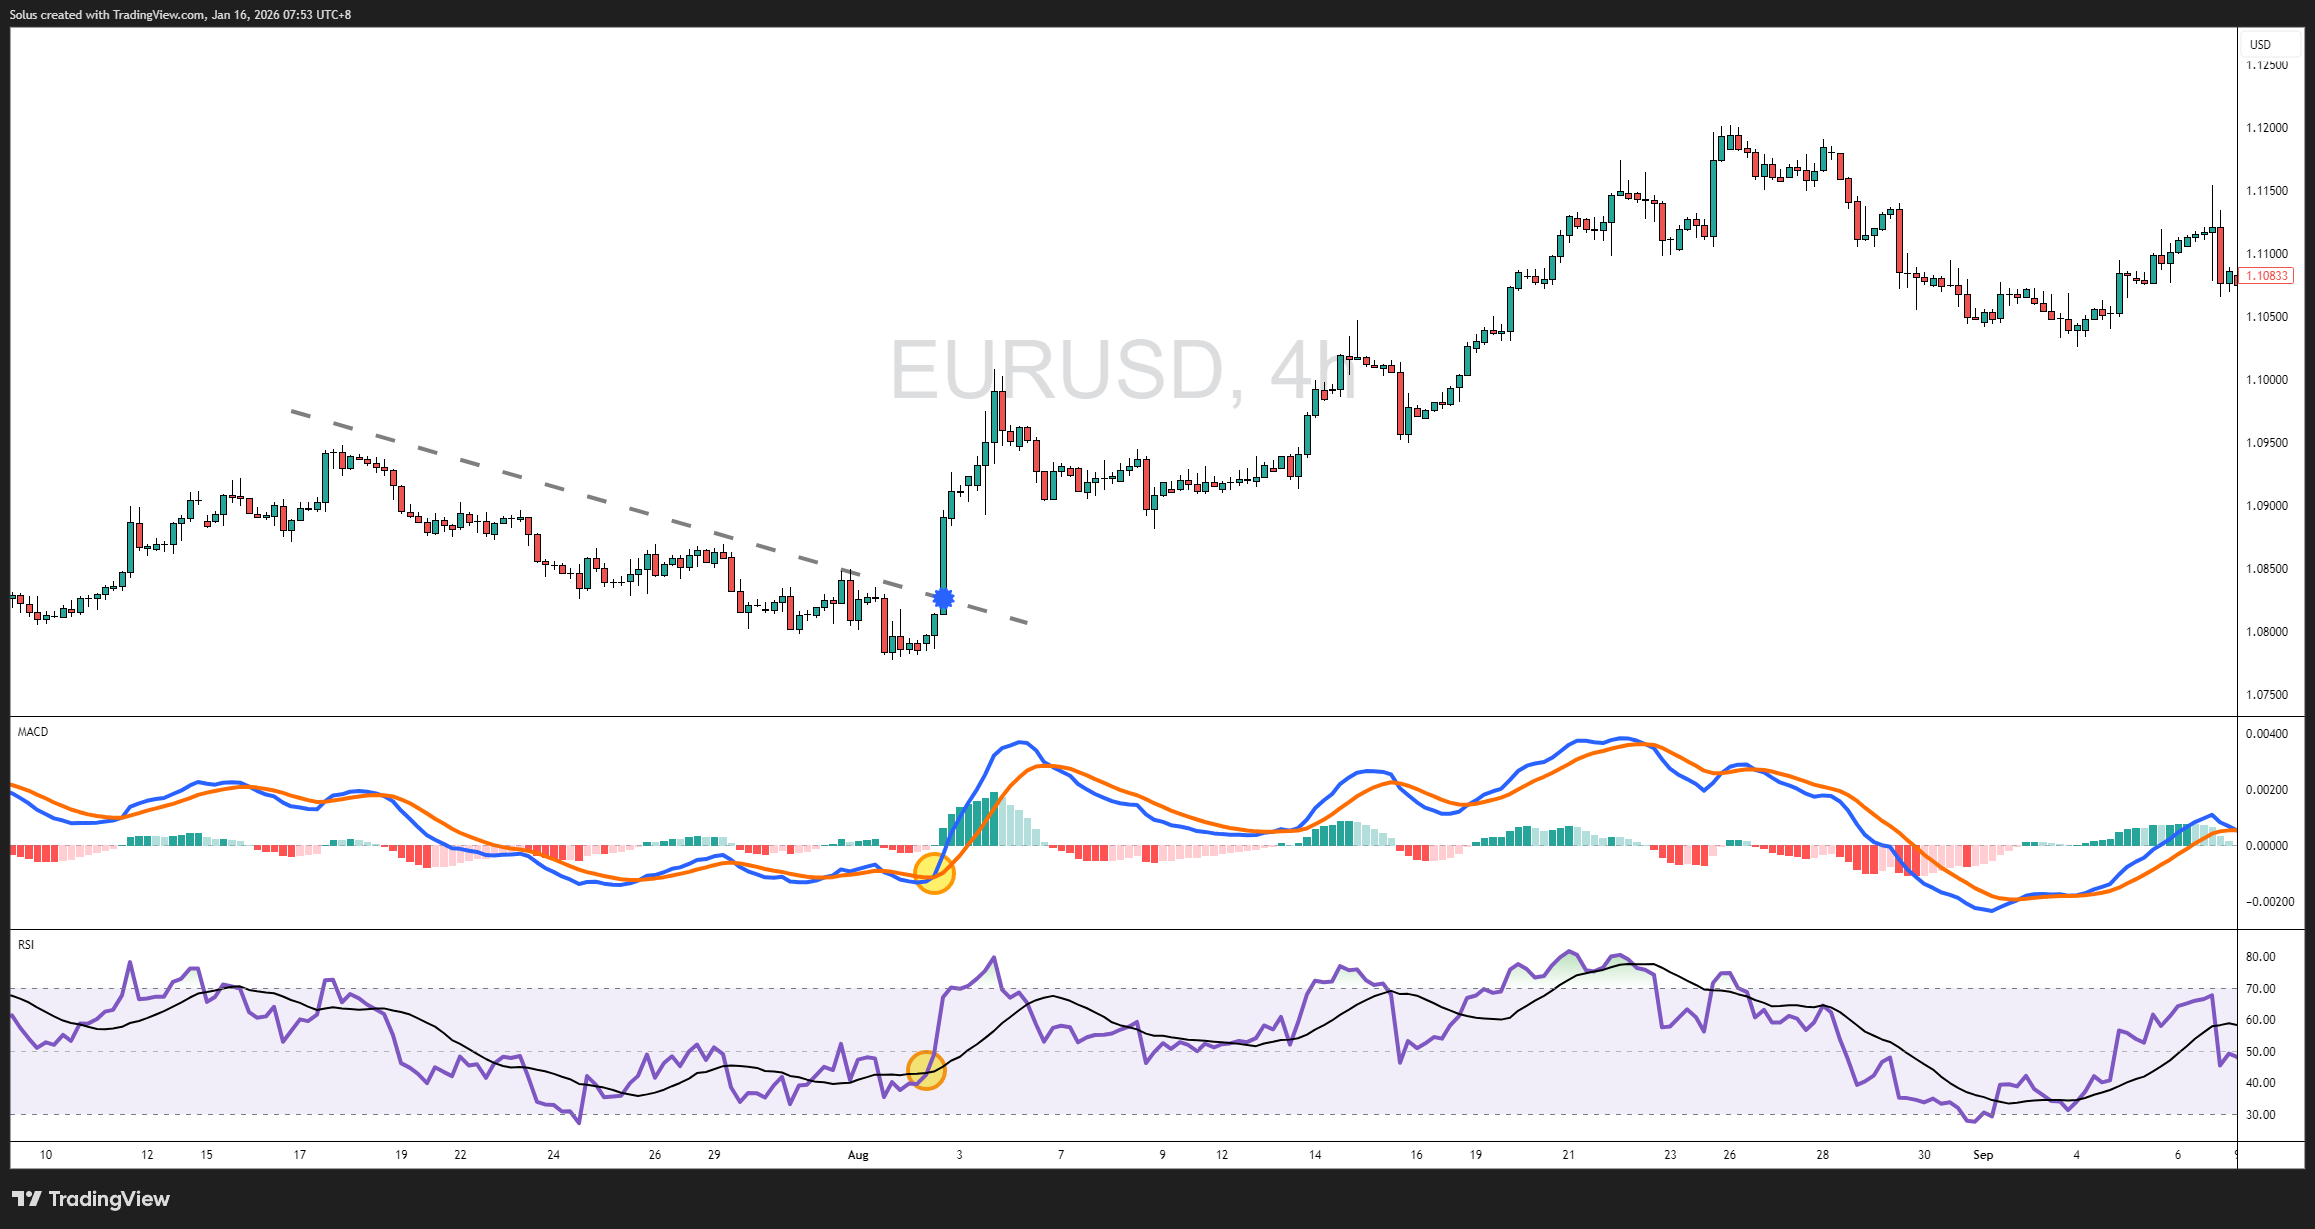
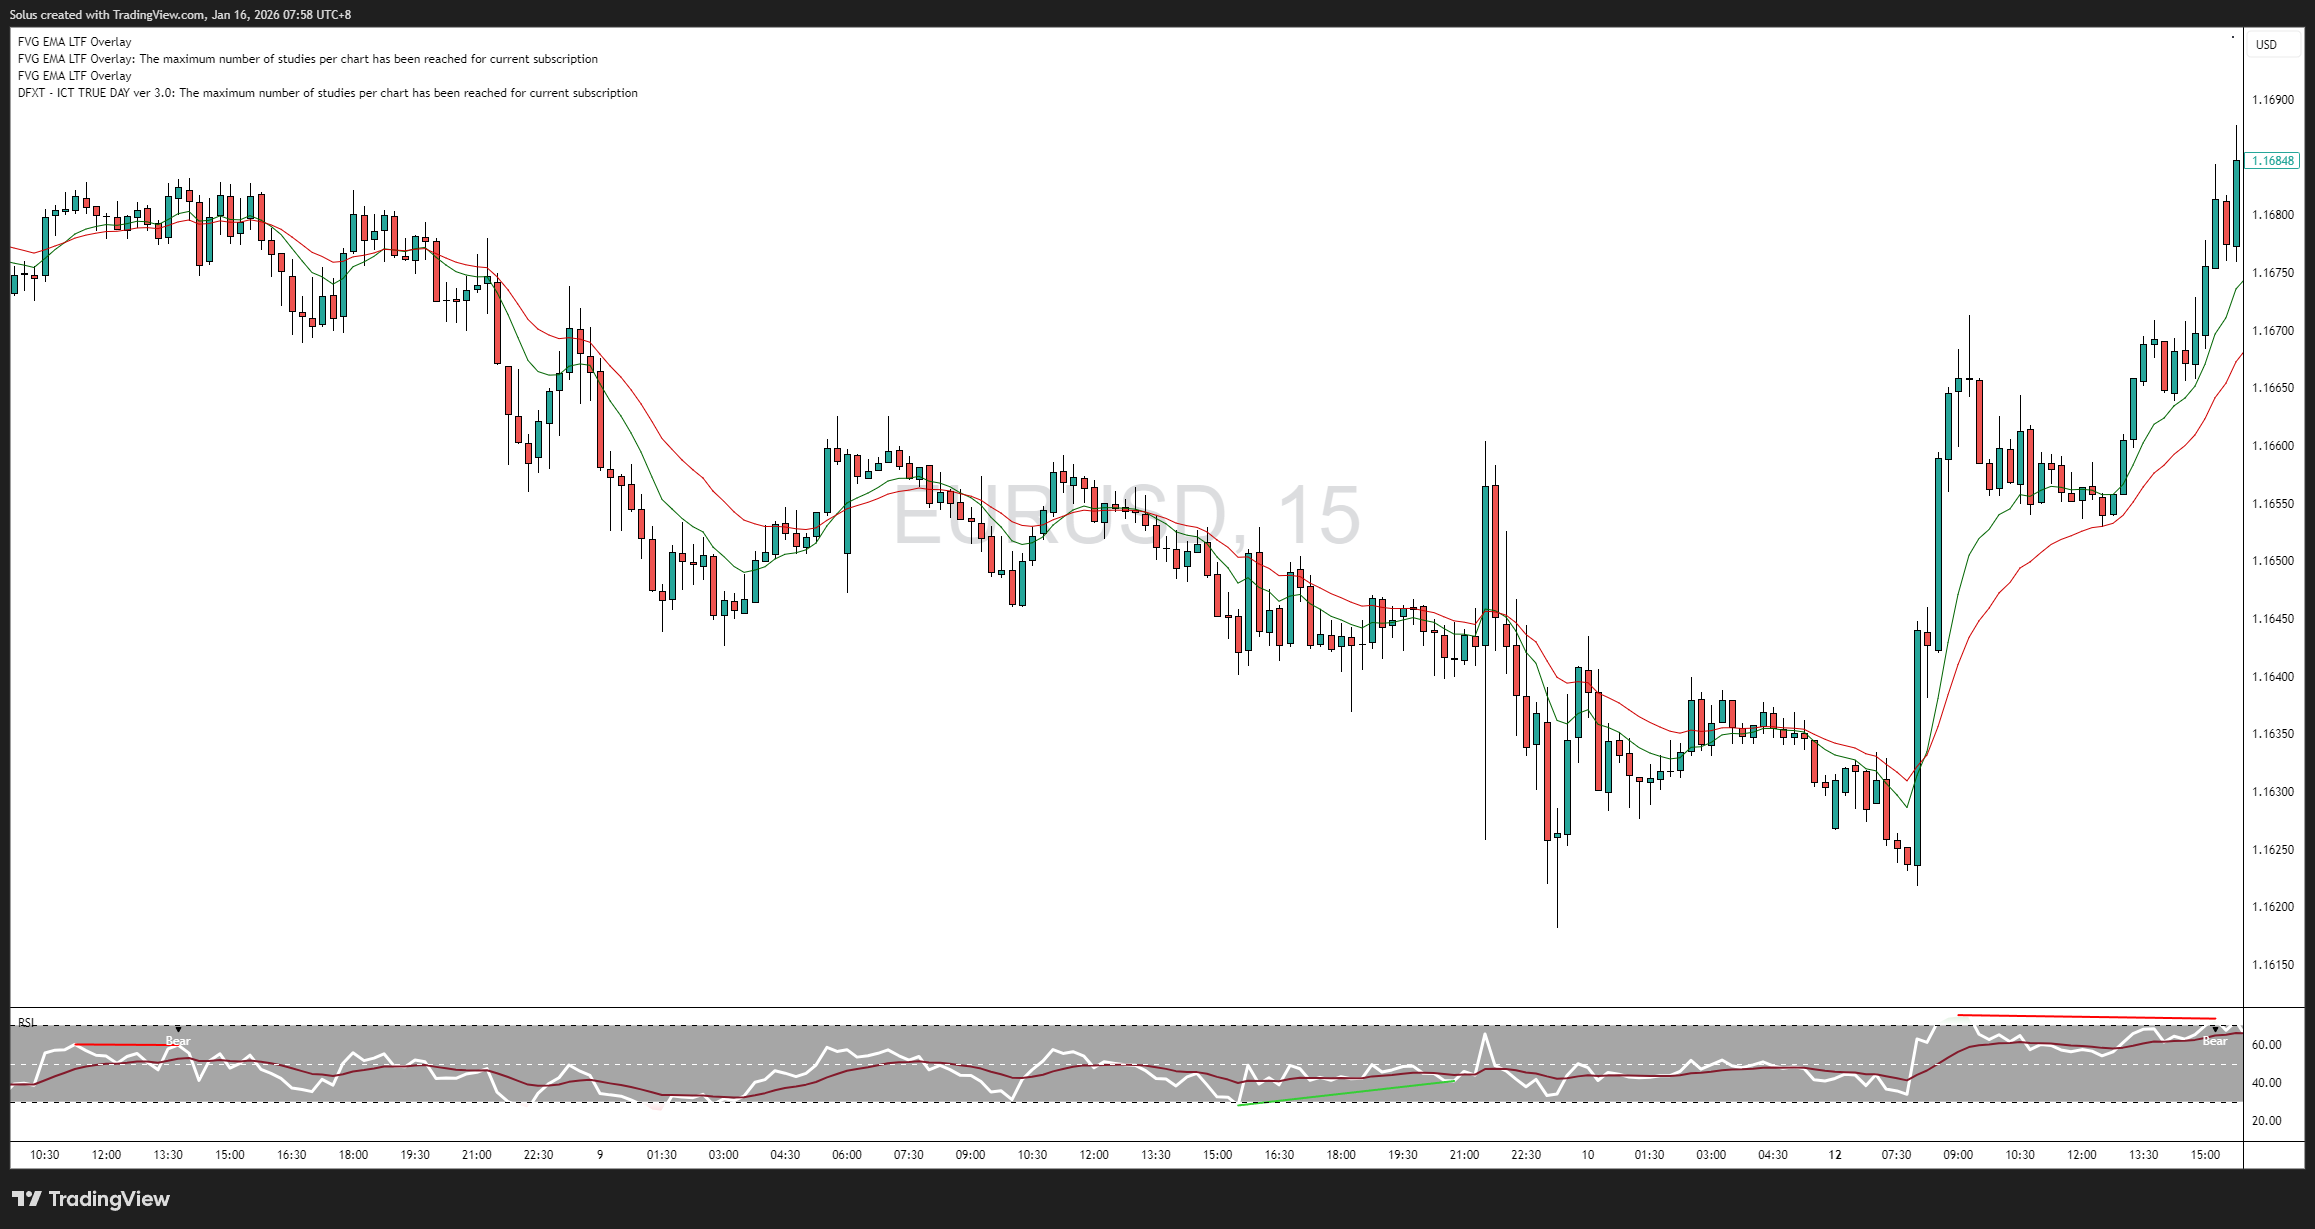
RSI and MACD measure momentum differently.
Used together, they expose false confidence.
This combination is especially useful in:
RSI keeps MACD honest.
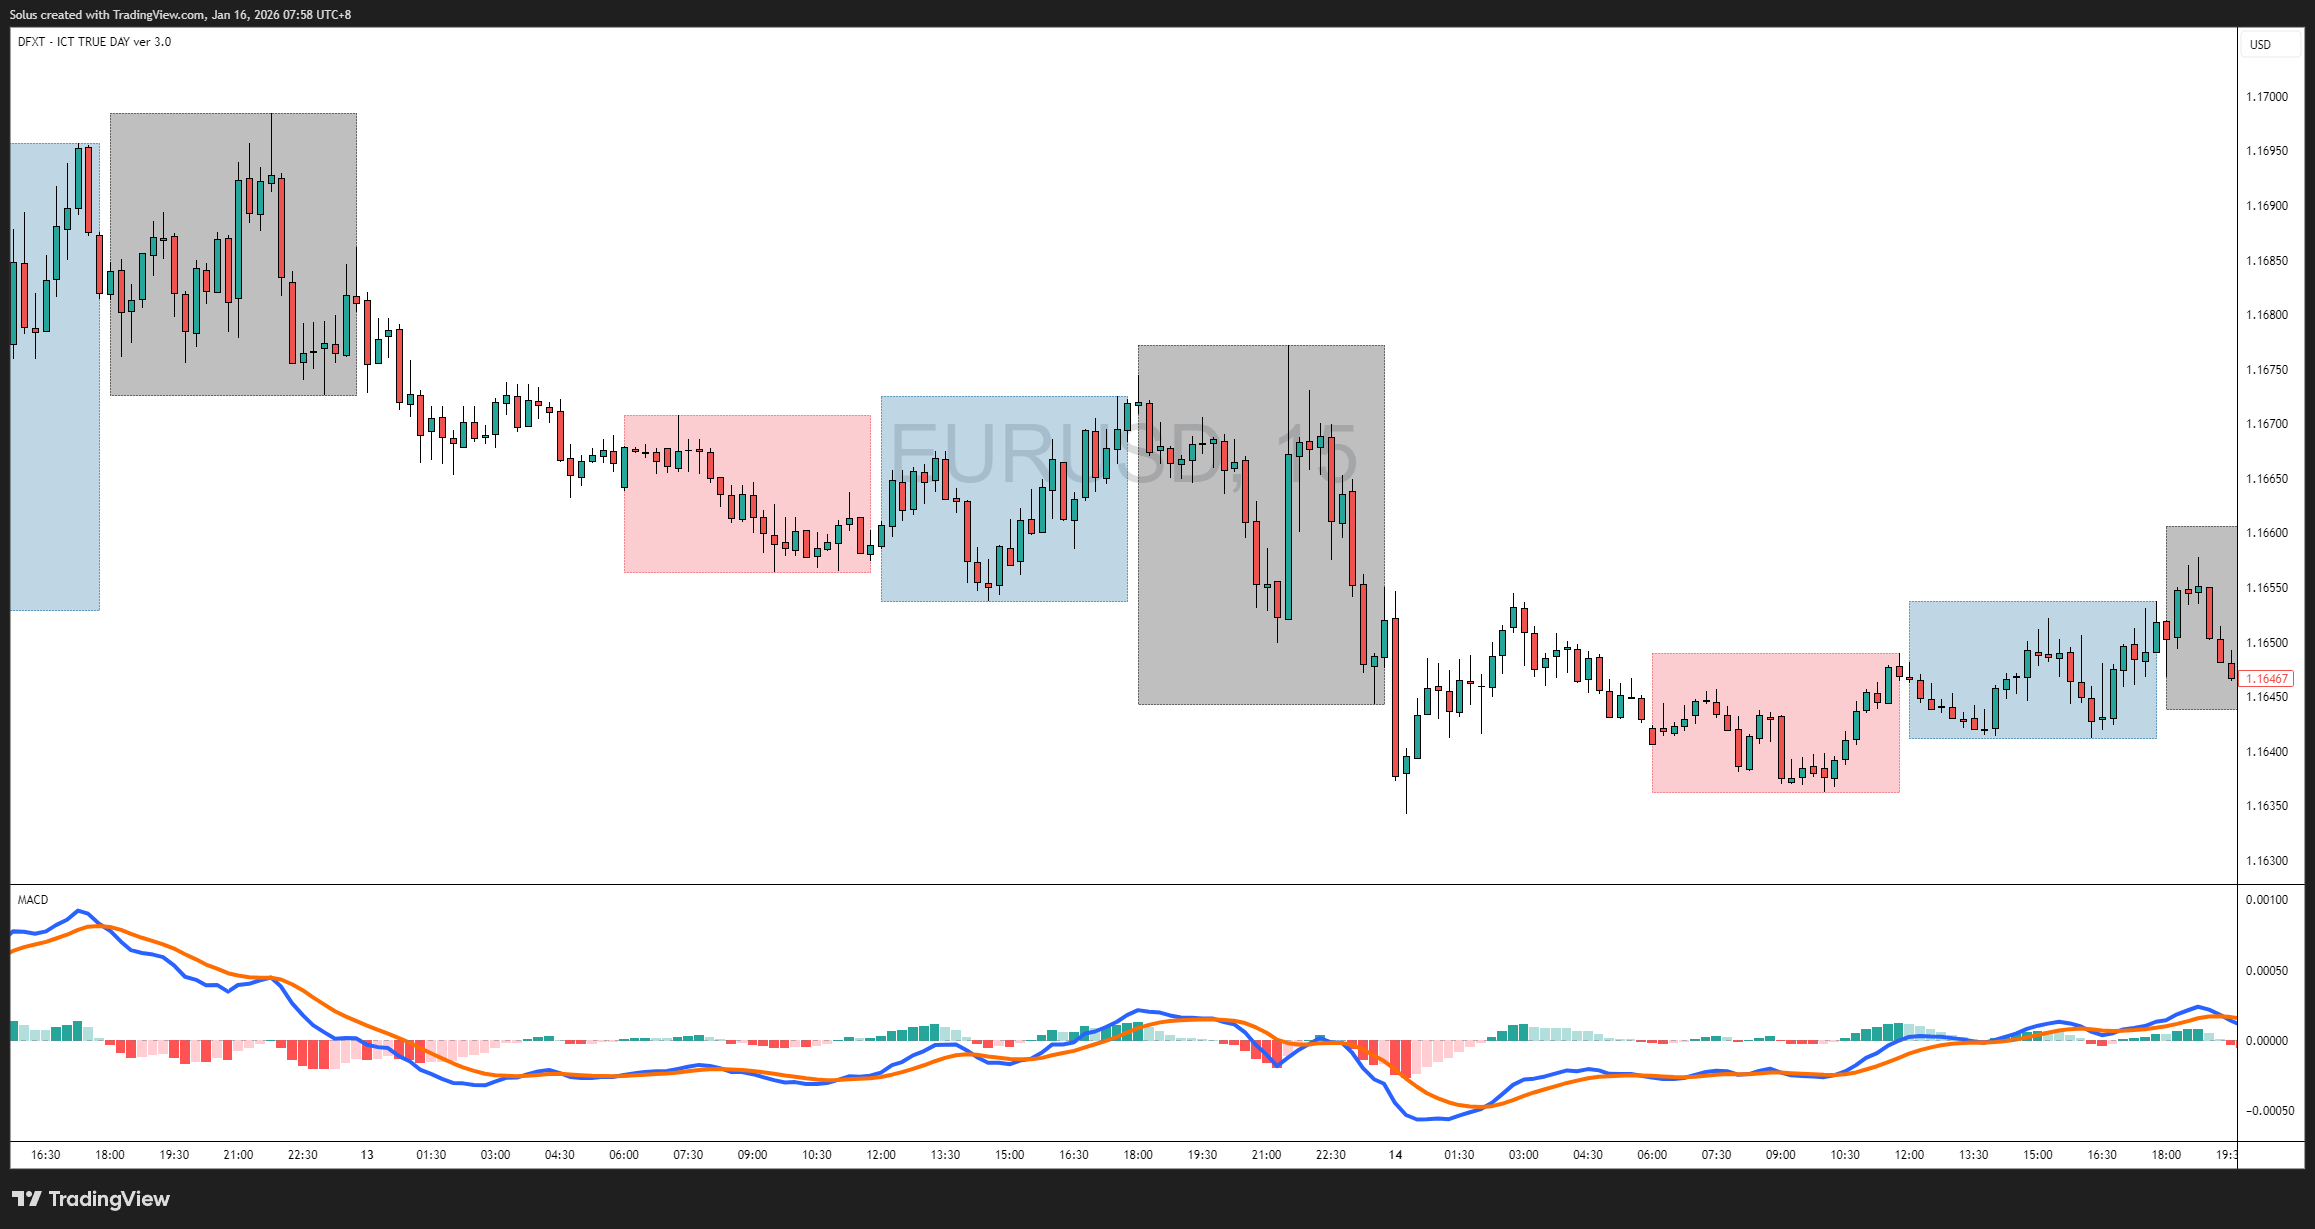
MACD signals mean very little without location.
Momentum behaves differently:
When MACD fires in the middle of nowhere, professionals ignore it.
The purpose of confluence is not perfection - it’s consistency.
A simple professional checklist might look like this:
Trend
Momentum
Strength Filter
Location
Invalidation
If 3–4 boxes aren’t checked, no trade is taken.
This removes:
Many traders mistake confluence for complexity.
Adding indicators doesn’t:
What it often does is:
MACD works best with few, well-defined partners - not a crowded chart.
Think of trading like a doctor diagnosing a patient.
A good doctor doesn’t rely on:
They look for patterns across data points.
MACD is one test.
Price, EMAs, RSI, and levels are others.
A diagnosis is made when enough evidence agrees - not when one signal screams the loudest.
MACD doesn’t need to be your hero indicator.
Its job is quieter than that.
It:
When MACD agrees with structure, strength, and location, trades feel clearer - even when they lose.
That clarity is what professionals trade for.
It’s time to go from theory to execution!
Create an Account. Start Your Live Trading Now!
Looking for step-by-step approaches you can plug straight into the charts? Start here:
Sharpen your edge with proven tools and frameworks:
News moves markets fast. Learn how to keep pace with SMC-based playbooks:
From NASDAQ opens to DAX trends, here’s how to approach indices like a pro:
Gold remains one of the most traded assets - here’s how to approach it with confidence:
Candlesticks are the building blocks of price action. Master the most powerful ones:
Ready to go intraday? Here’s how to build consistency step by step:
Markets swing between calm and chaos. Learn to read risk-on vs risk-off like a pro:
Step inside the playbook of institutional traders with SMC concepts explained:
Forex pairs aren’t created equal - some are stable, some are volatile, others tied to commodities or sessions.
If you’ve ever been stopped out right before the market reverses - this is why:
Mindset is the deciding factor between growth and blowups. Explore these essentials:
The real edge in trading isn’t strategy - it’s how you protect your capital:
If you’re not sure where to start, follow this roadmap:
This way, you’ll grow from foundation → application → mastery, instead of jumping around randomly.
Follow me for more daily market insights!
Jasper Osita - LinkedIn - FXStreet - YouTube
This content may have been written by a third party. ACY makes no representation or warranty and assumes no liability as to the accuracy or completeness of the information provided, nor any loss arising from any investment based on a recommendation, forecast or other information supplies by any third-party. This content is information only, and does not constitute financial, investment or other advice on which you can rely.
ACY Securities is one of Australia's fastest growing multi-asset online trading providers, offering ultra-low-cost trading, rock-solid execution, technologically superior account management and premium market analysis.
Select the categories and companies you wish to follow directly to your person rss feed.
Create Custom RSS FeedSign up and join over 5,000 professional members who receive personalized news alerts, curated professional connections, and more for free!
Sterling steadies after political uncertainty rattled gilt markets, while EUR/USD and EUR/GBP approach key technical levels ahead of today's European session.
GBP/AUD remains trapped in a well-defined bearish trend on both the weekly and daily timeframes.
Discover the key drivers, technical levels, and central bank expectations shaping the EUR/USD trend as the ECB prepares to hold rates and markets watch for a potential breakout.
Sydney-based multi-asset broker ACY Securities has introduced PAXGUSD, a new CFD instrument that allows clients to trade tokenised gold against the US Dollar 24 hours a day, seven days a week. The instrument is available across MetaTrader 4, MetaTrader 5, and the ACY Trading Platform.
Binance has lowered its VIP 3 Wallet Assets threshold from $3 million to $1 million and will now count OTC Spot Trading Volume at a 4x multiplier toward VIP qualification, removing the previous VIP 4 cap and allowing eligible users to progress through the full tier framework up to VIP 9.
Retail futures trading leader NinjaTrader Group has appointed Mark Omens as Senior Vice President, Commercial Strategy, bringing a 25-year veteran of derivatives marketplace CME Group into a newly created role focused on exchange partnerships and enterprise growth.
Gold Price Action Forecast: Will XAU/USD Drop to $3930? Meta Description: Read our Gold price action forecast to see if XAU/USD will drop to $3930.
BitDelta Securities Financial Services LLC (“BitDelta Securities”) today announced that it has received full regulatory approval from the Capital Market Authority (“CMA”) of the United Arab Emirates under the Category 5 — Arrangement and Advice license framework (License No. 20200000439). The approval follows the firm's receipt of In-Principal Approval earlier this year and represents the successful conclusion of the CMA's full licensing process, including the satisfaction of capital requirements, governance appointments, and operational setup.
Crypto.com has received a $400 million strategic investment from Citadel Securities, valuing the firm at $20 billion. It marks the first institutional funding round in the company's history, aimed at accelerating its expansion into tokenised securities, derivatives and other asset classes.
WTI’s pullback into $79–82 is the first major test of the bullish Elliott Wave count, with buyers targeting a renewed break above $85.


