just now

Liquidity Finder Ltd is incorporated in England and Wales, company number 10610740, registered address 167-169 Great Portland Street, Fifth Floor, London W1W 5PF, United Kingdom.
Published: just now

By the end of this lesson, you will understand how to use Japanese candlestick patterns with price action analysis to identify high-probability trade setups, manage risk properly, and trade using confirmation instead of prediction.

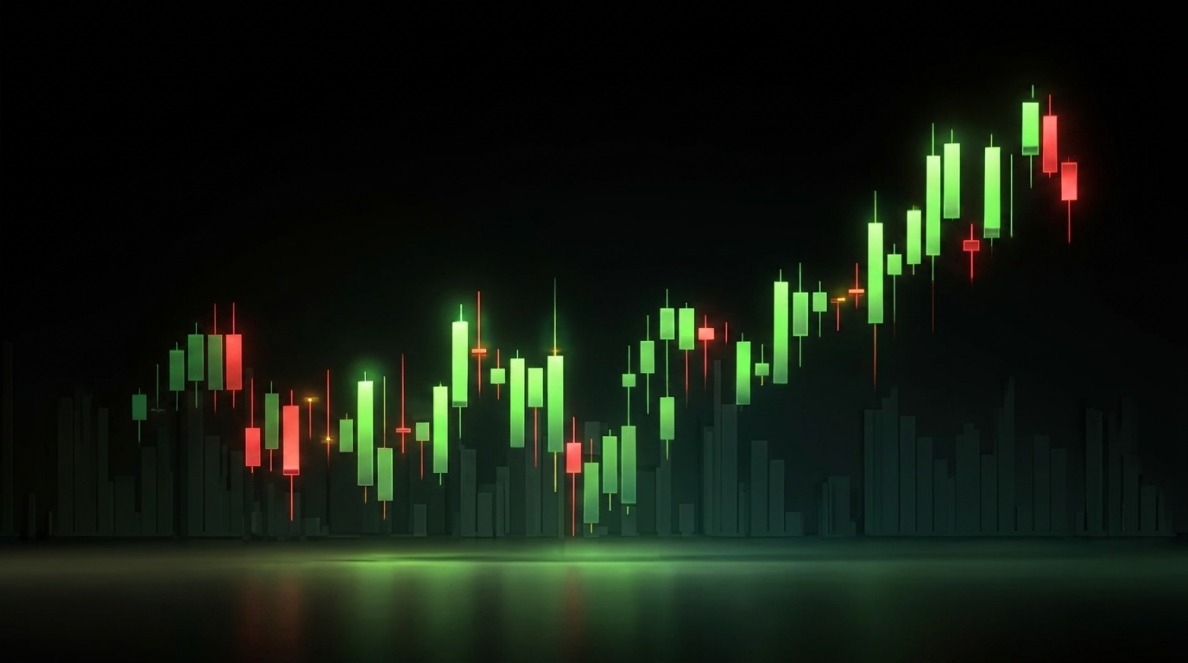
Back in the 1700s, long before modern stock markets existed, Japanese rice traders were already studying price movement through what we now call candlestick charts.
One of the most famous traders, Munehisa Homma, discovered something powerful, markets were not driven by supply and demand alone, but also by human emotions like fear, greed, and hesitation.
By carefully observing how prices opened, moved, and closed each day, Homma began identifying repeating patterns in market behavior. These observations eventually became the foundation of Japanese candlestick charting, a method traders still use today to read price action and understand market psychology.

Today, candlestick patterns remain one of the most powerful tools in technical analysis because they help traders identify:
Candlestick confirmation means waiting for the market to prove the direction before entering a trade.
Instead of predicting, you allow price action to confirm strength or weakness first.
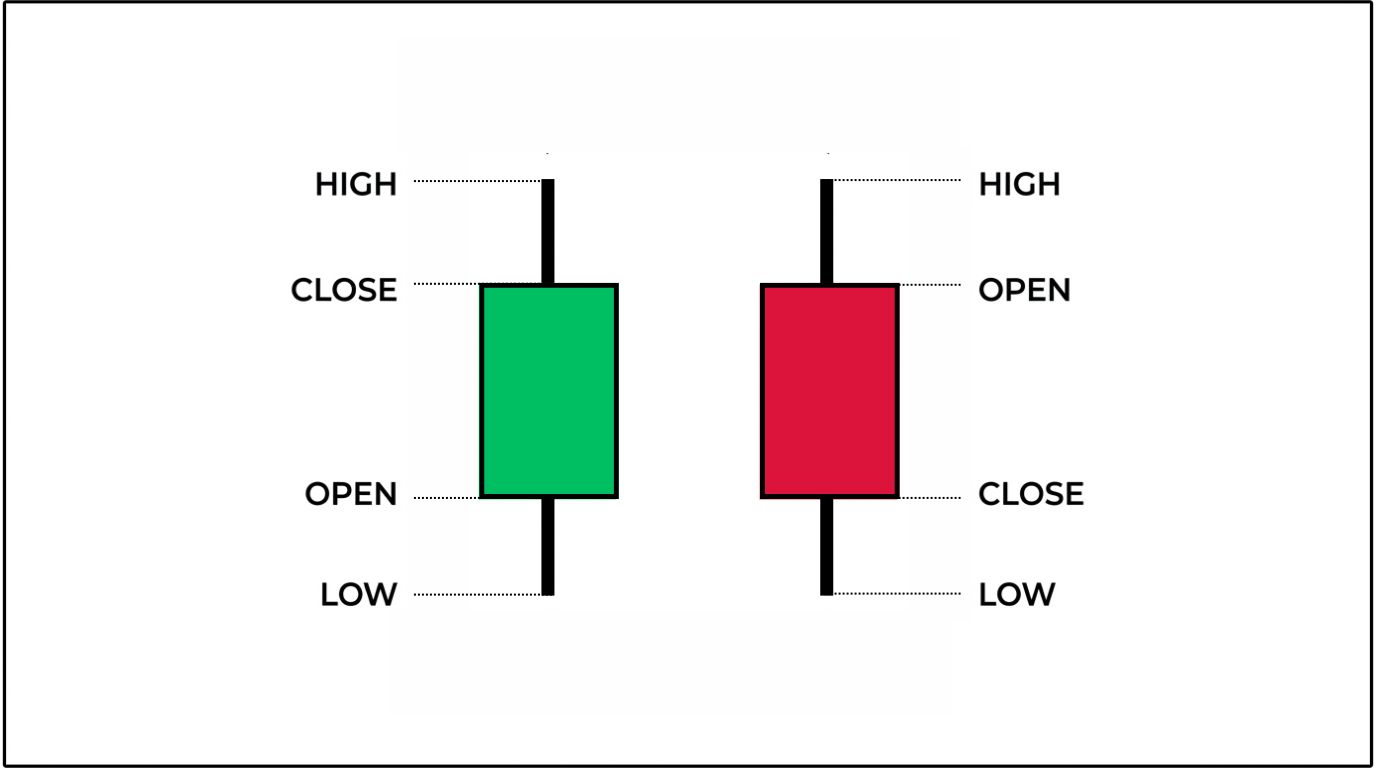
Each candlestick shows four important prices:
this helps traders quickly understand whether buyers or sellers controlled the market during that period.
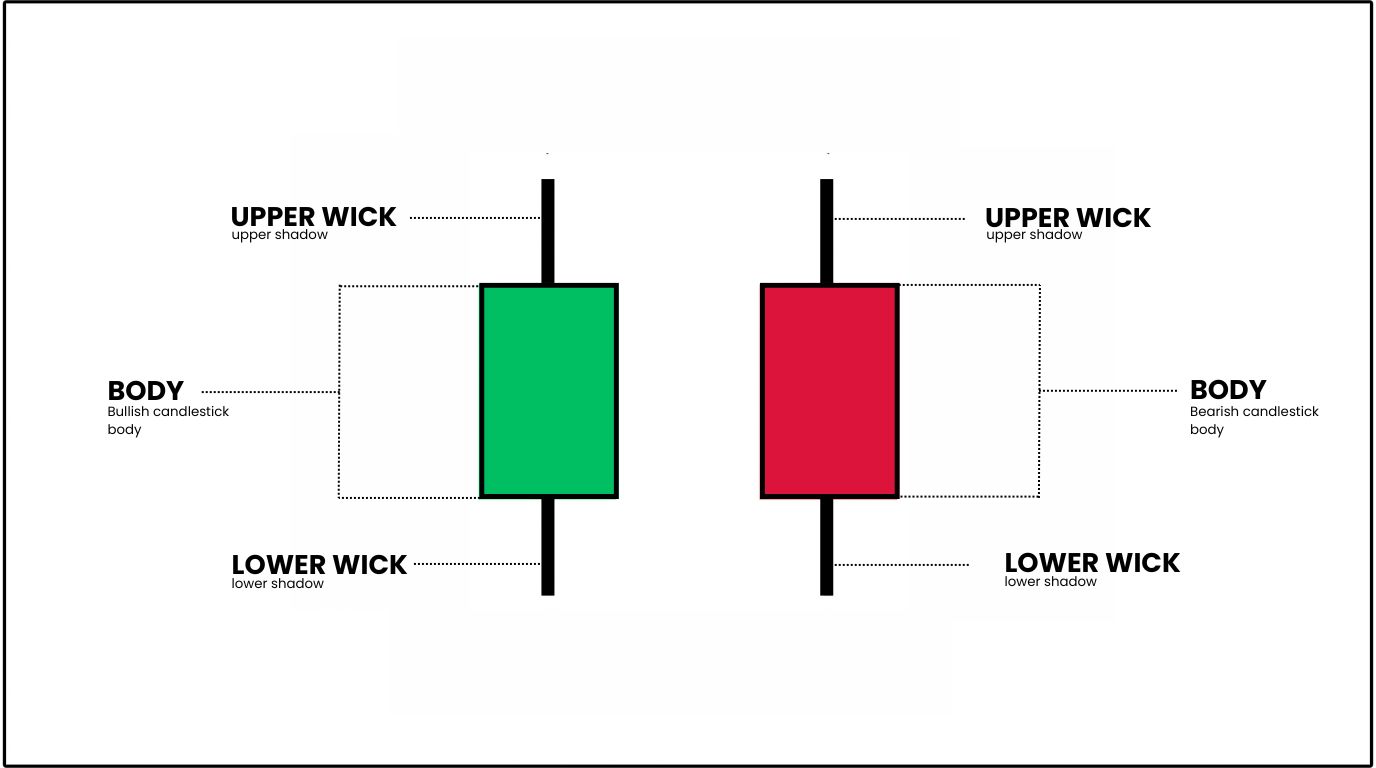
Candlestick Components or Anatomy
Shows the difference between the opening and closing price.
Shows the highest and lowest price reached before the candle closed.
Shows who controlled the market, buyers or sellers.
Bullish and Bearish Candlestick
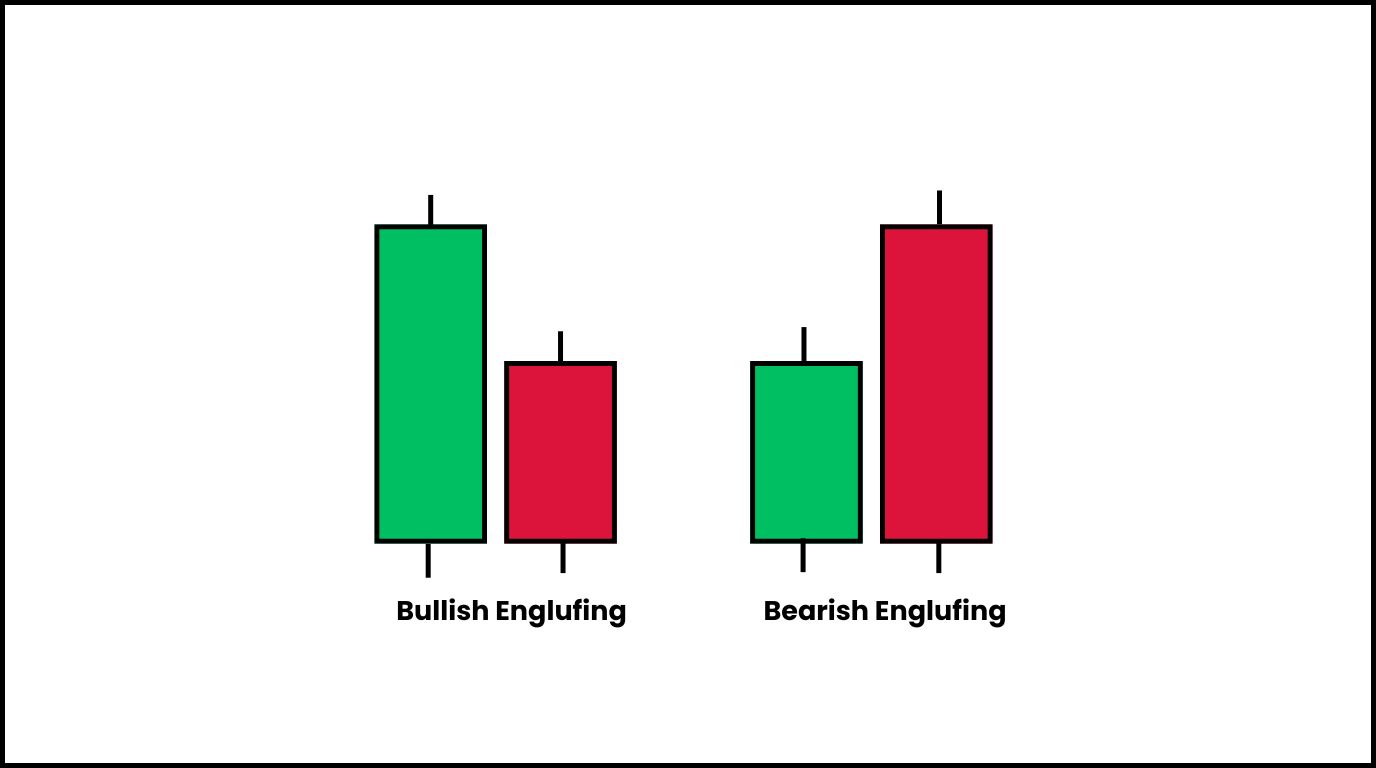
One candle fully “engulfs” the previous candle’s body.
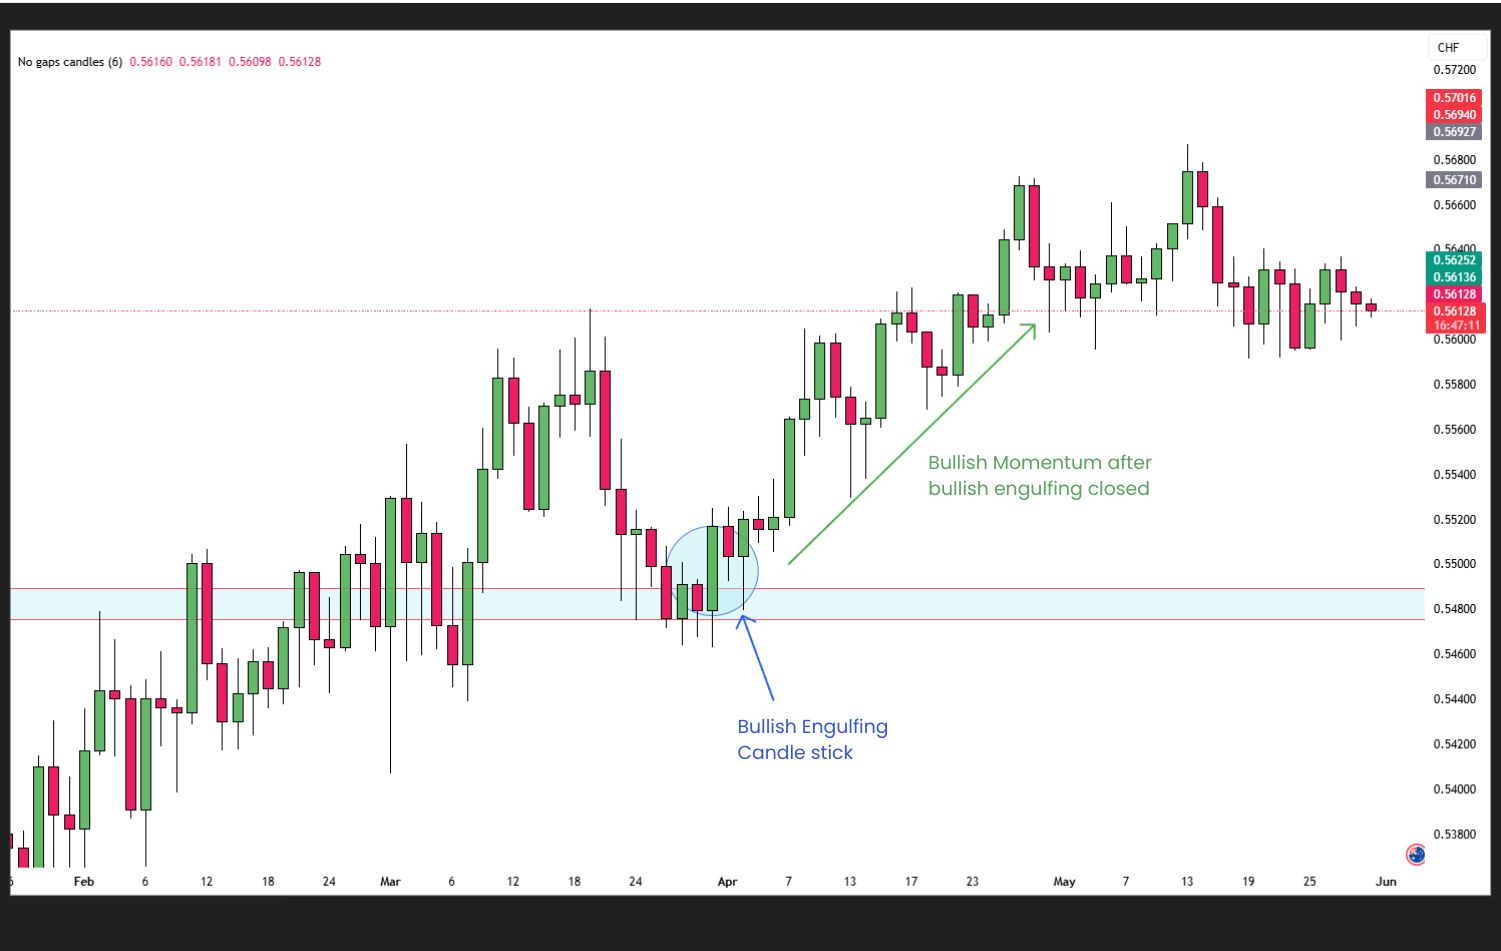
Bullish Engulfing Confirmation
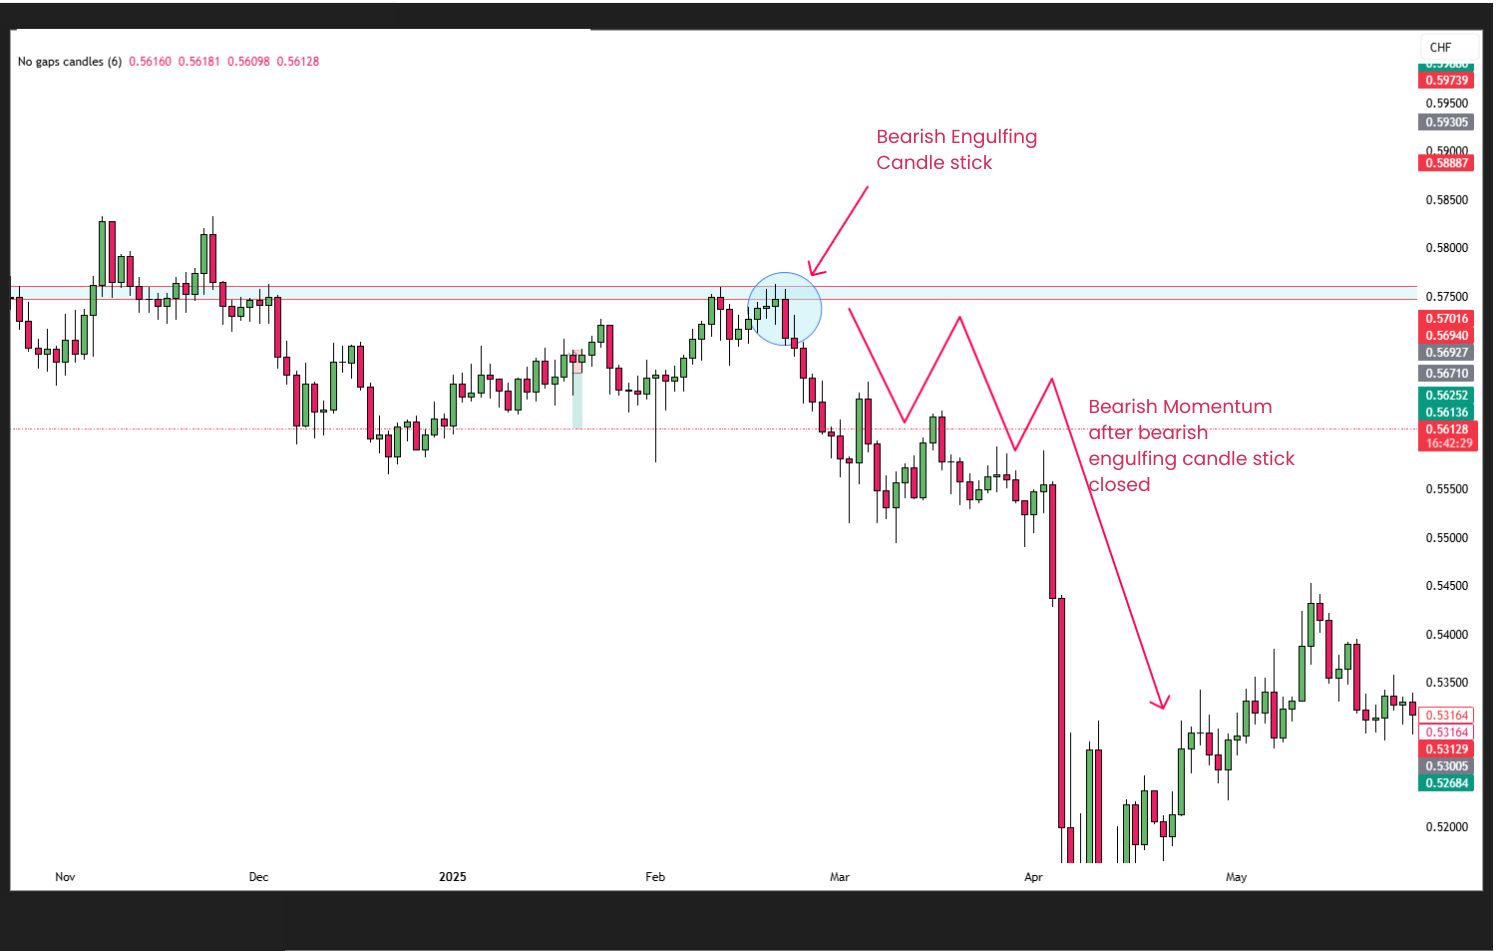
Bearish Engulfing Confirmation
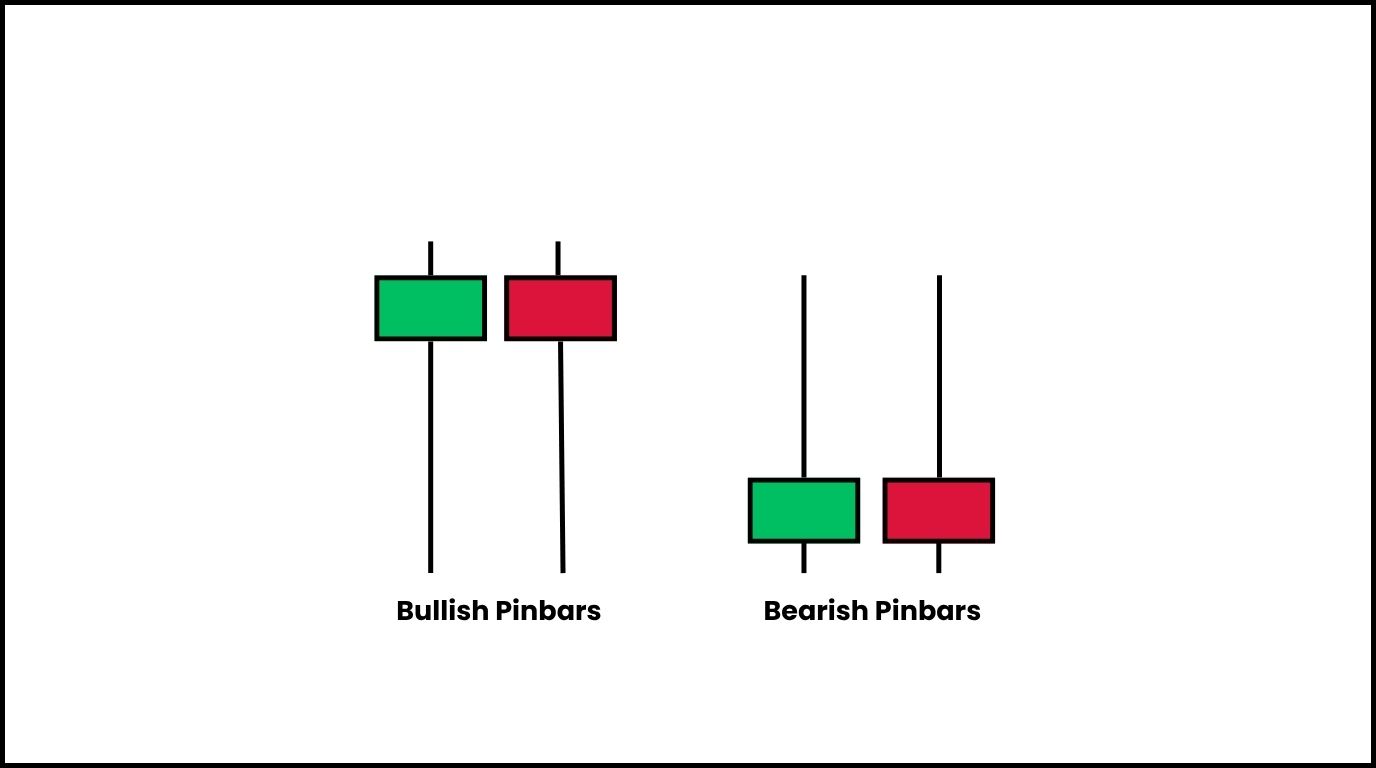
Bullish and Bearish Pinbar Candlestick
Small body, long lower wick (hammer) = potential bullish reversal
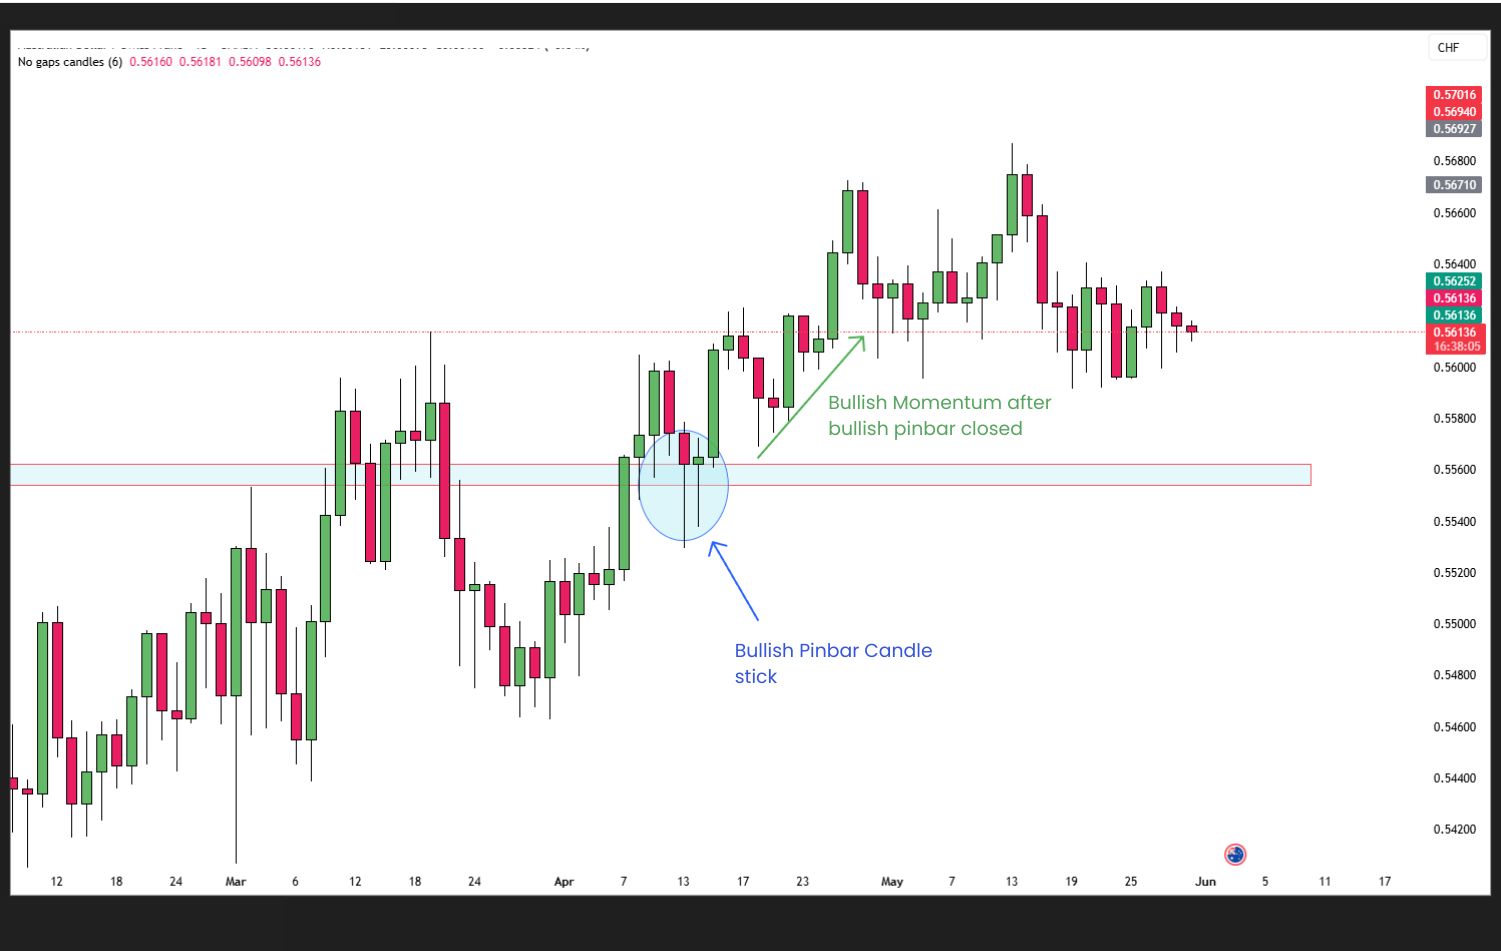
Bullish Pinbar Confirmation
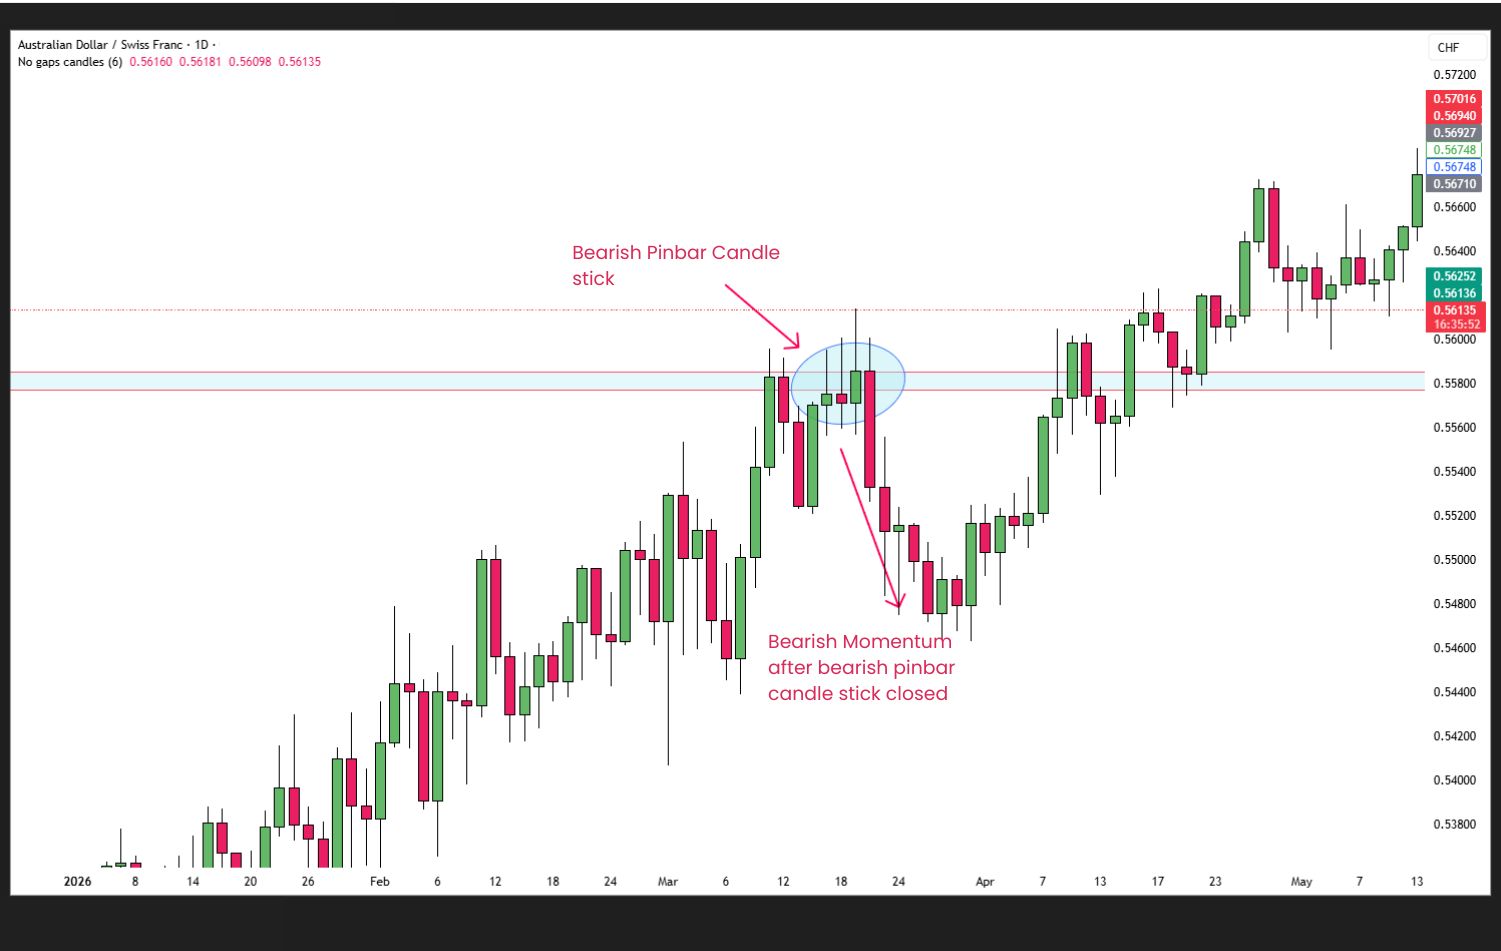
Bearish Pinbar Confirmation
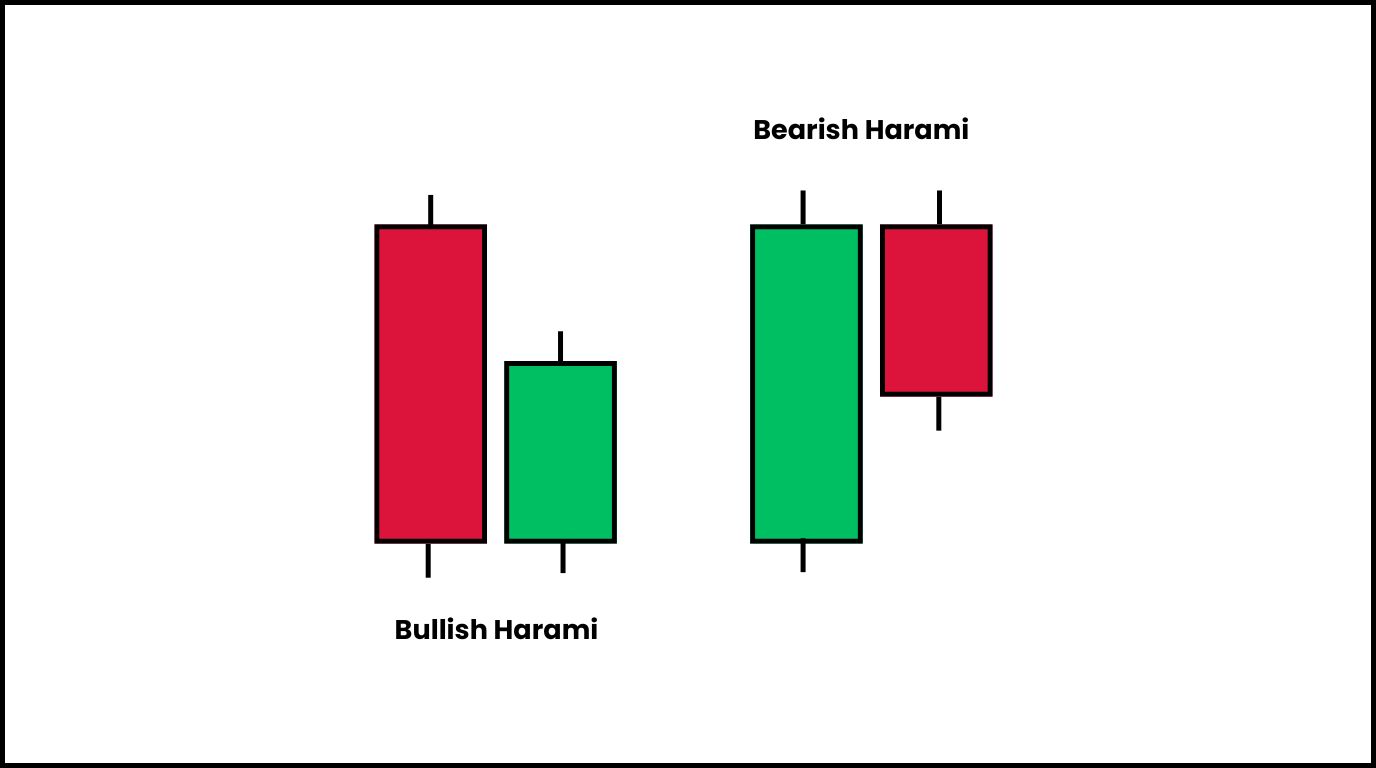
Bulish and Bearish Harami Candlestick
A one body candle (bullish/bearish) stick is followed by a different small body candlestick (bullish/ bearish).
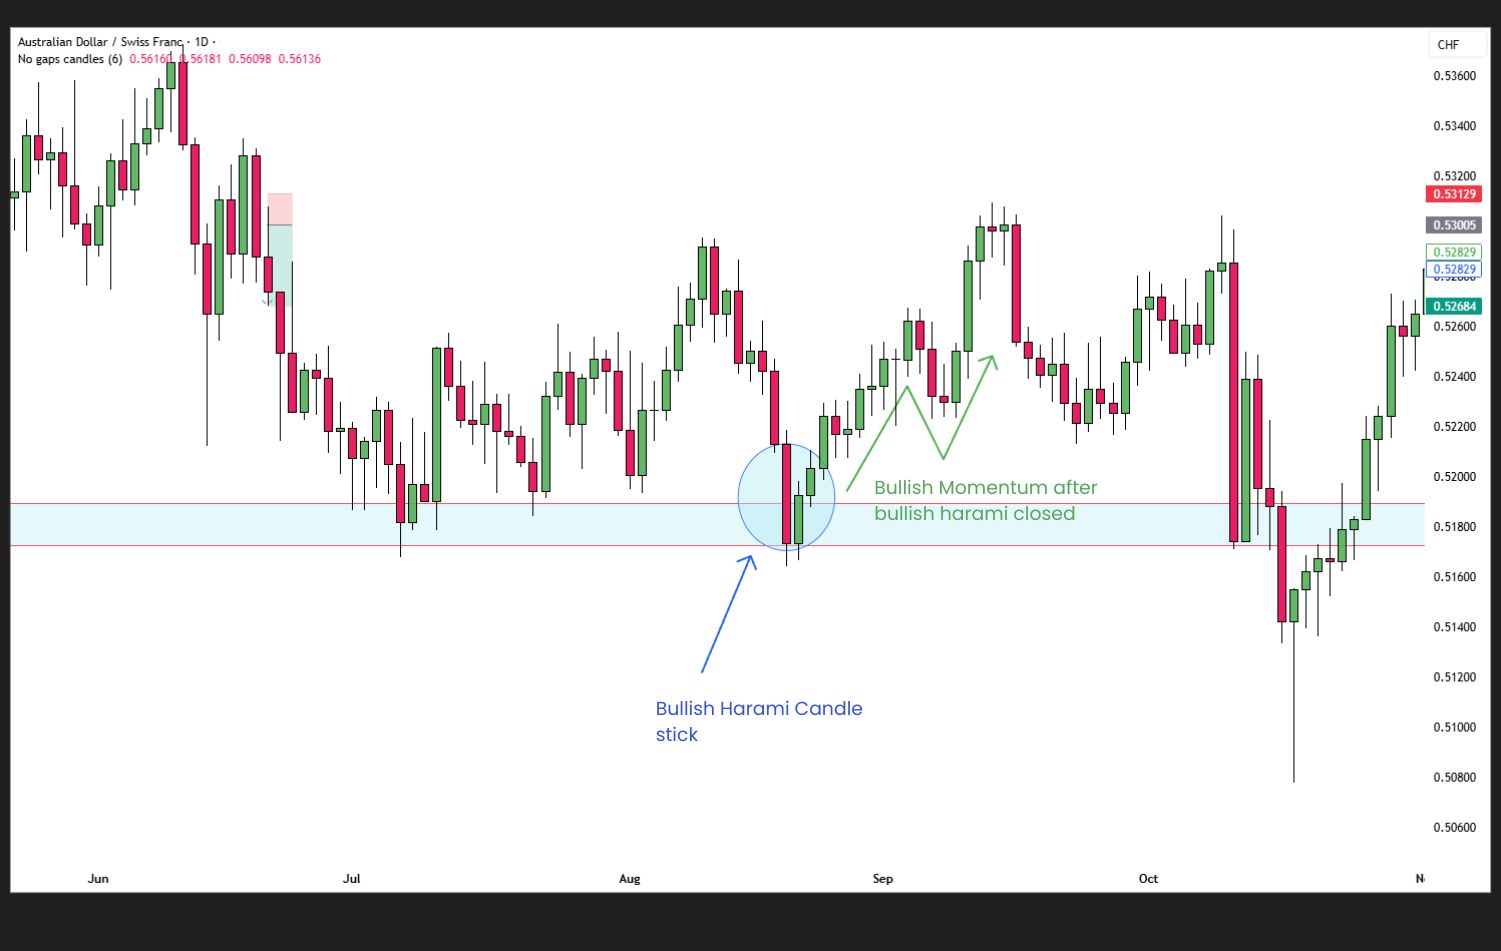
Bullish Harami Confirmation
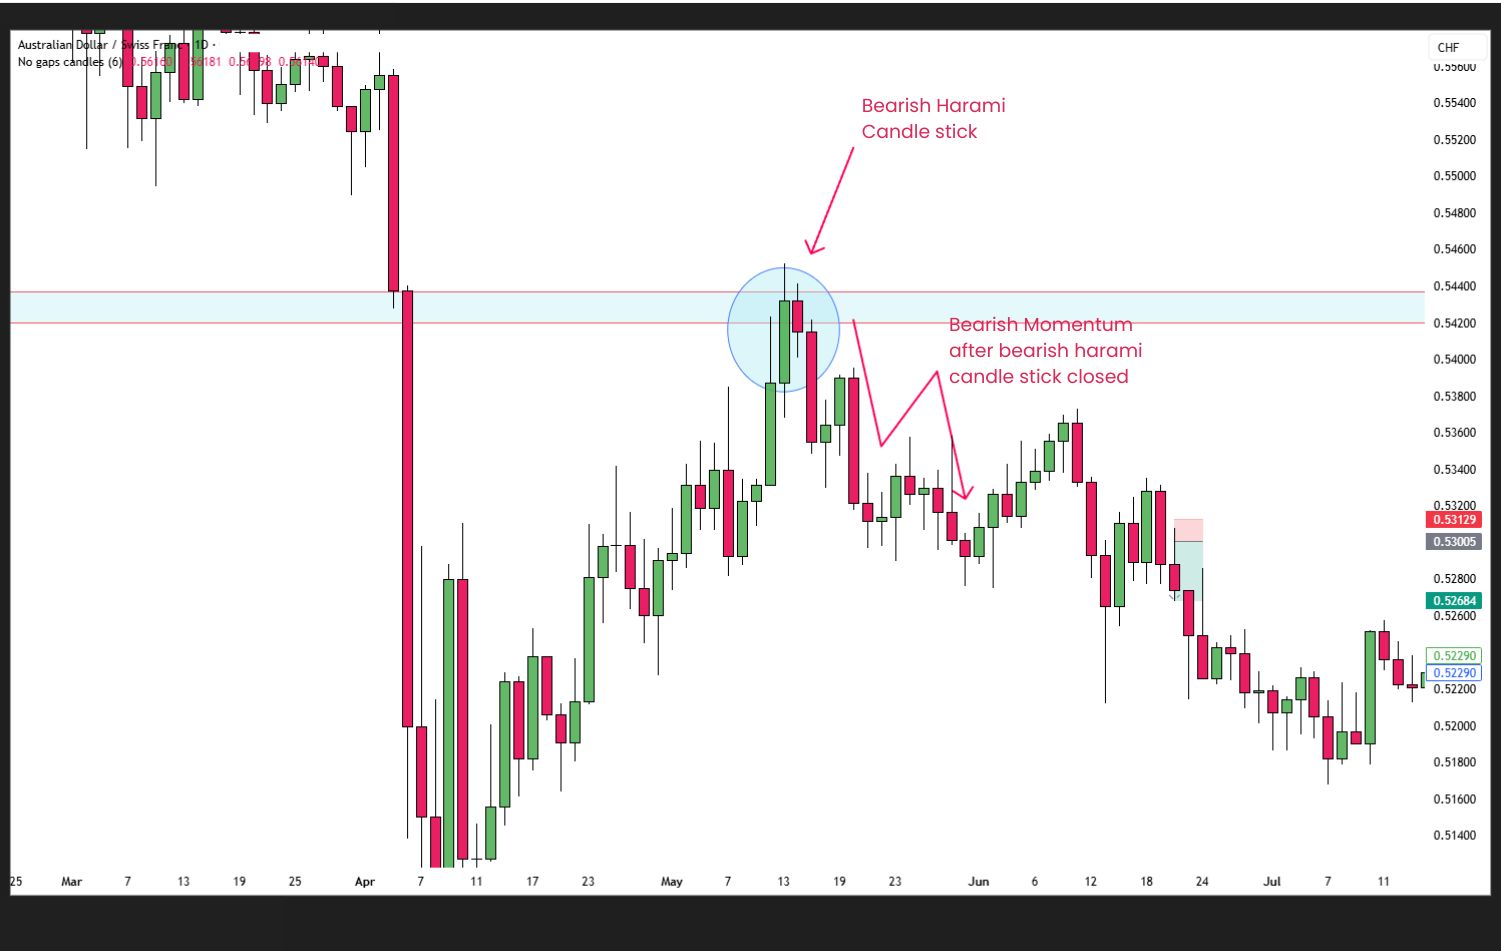
Bearish Harami Confiirmation
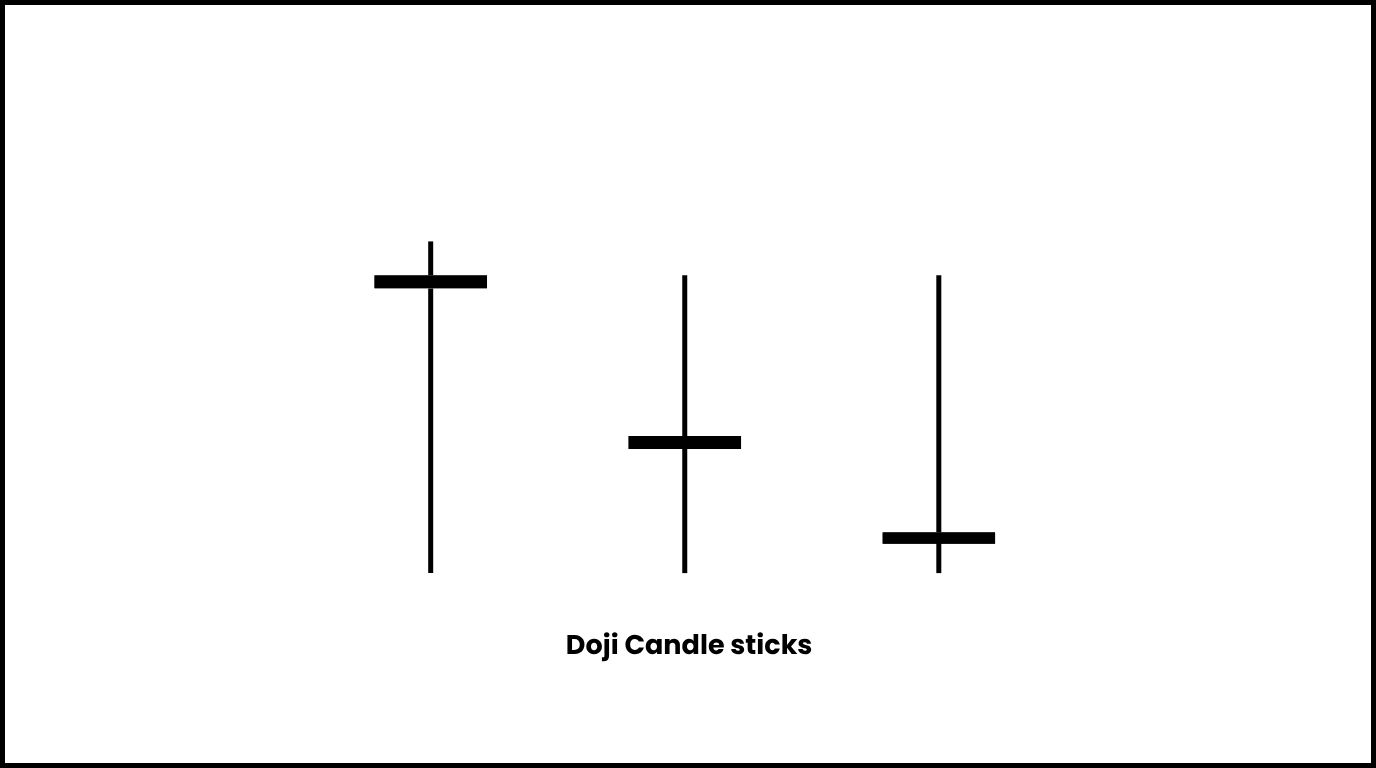
Doji Candle stick
A candle stick that has no candlestick body, it can signal either bearish to bullish or bullish to bearish momentum reversals.
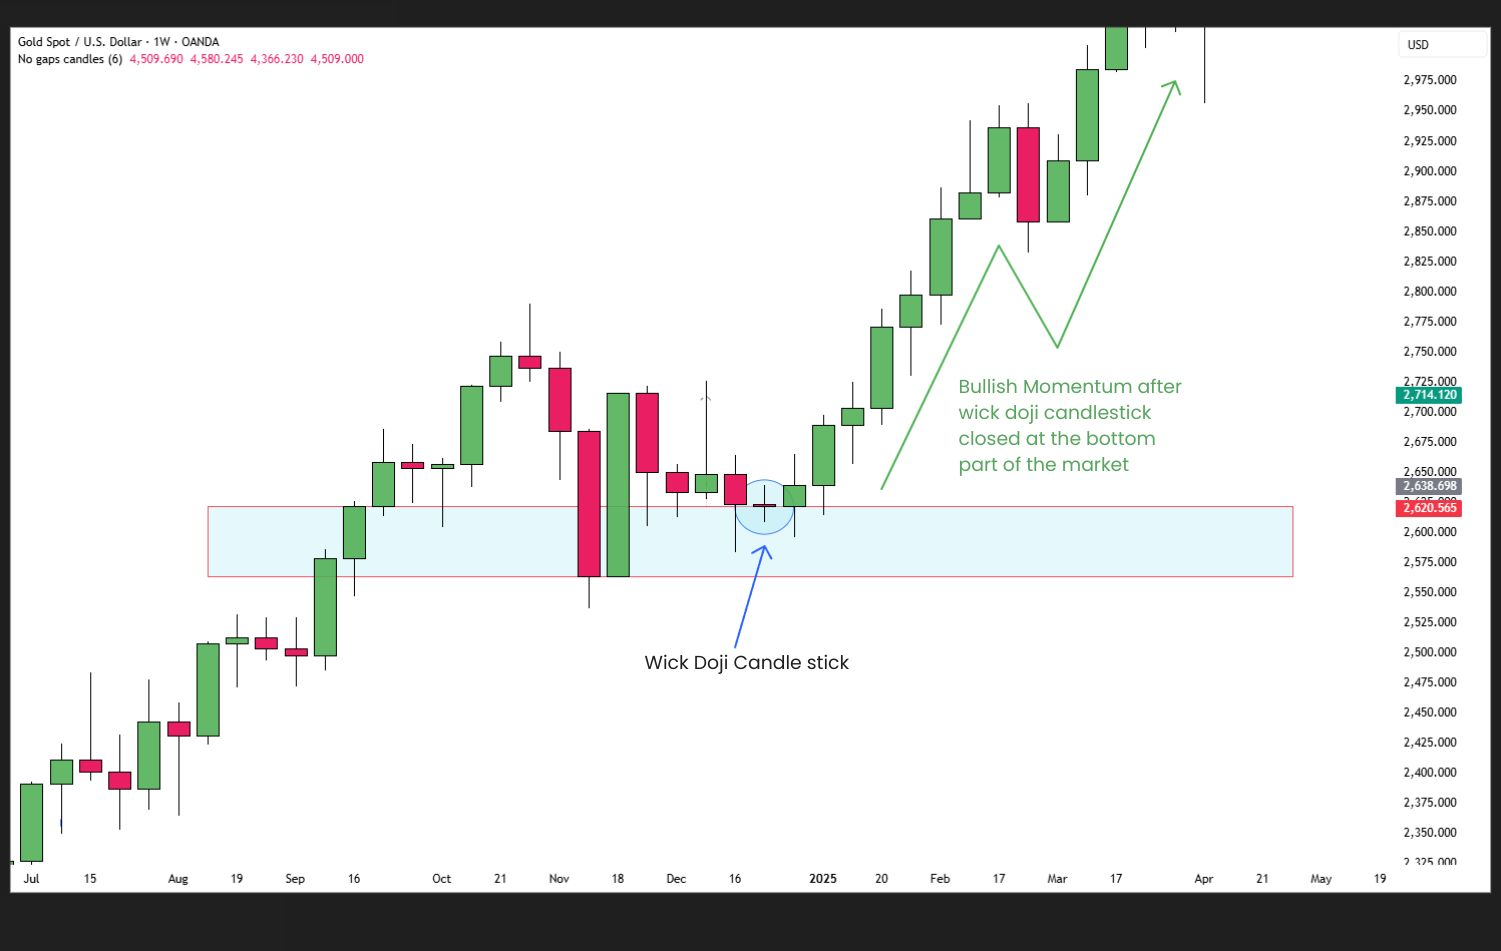
Doji Candlestick Confirmation at a Bullish Scenario
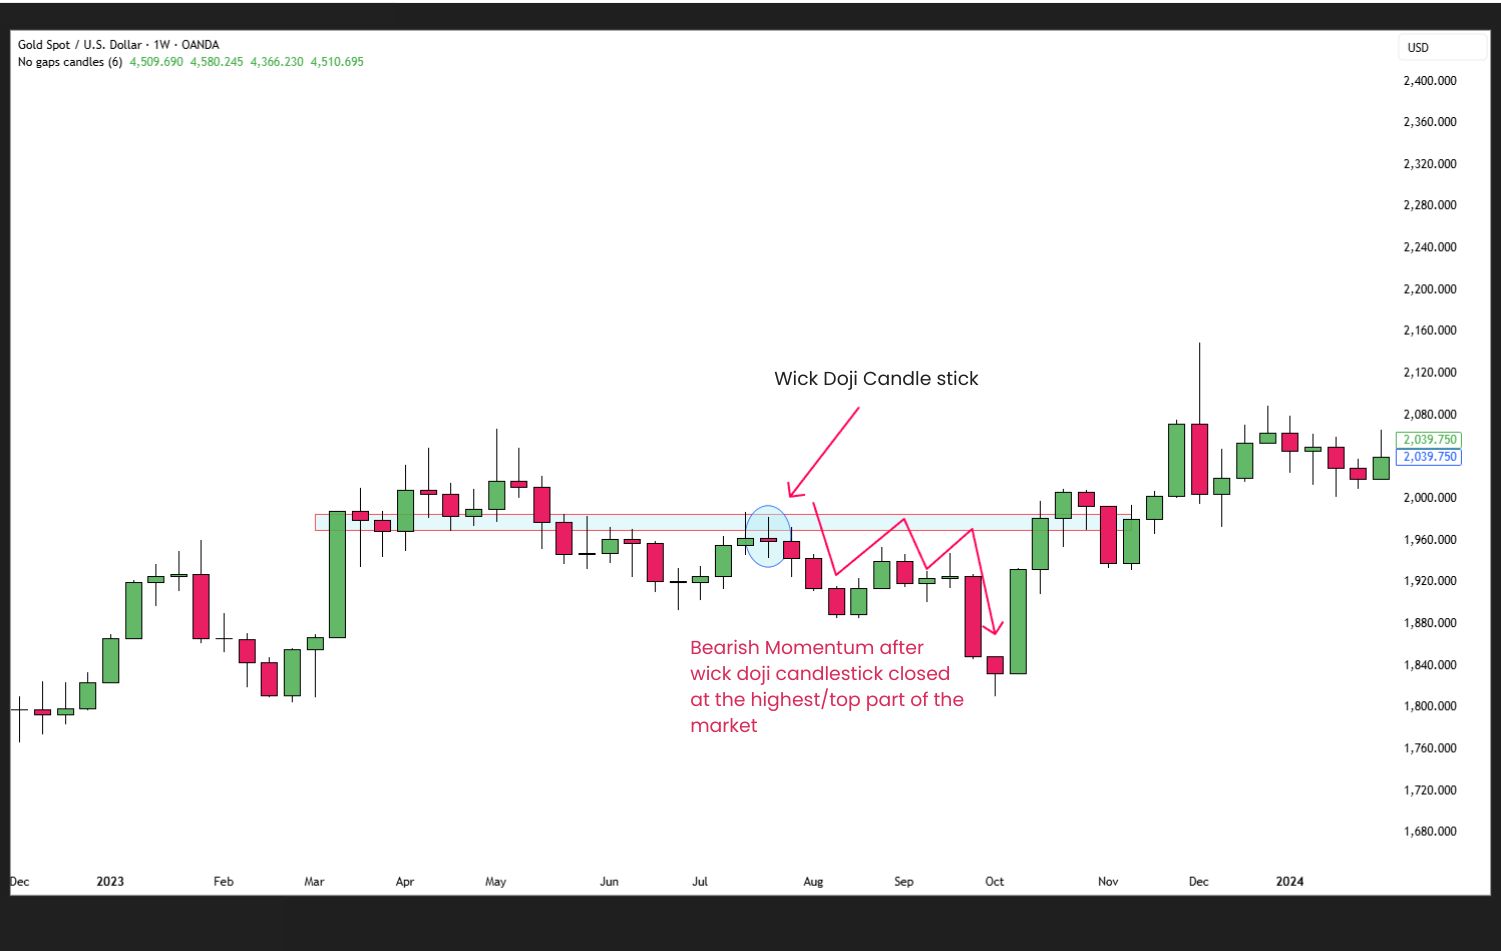
Doji Candlestick Confirmation at a Bearish Scenario
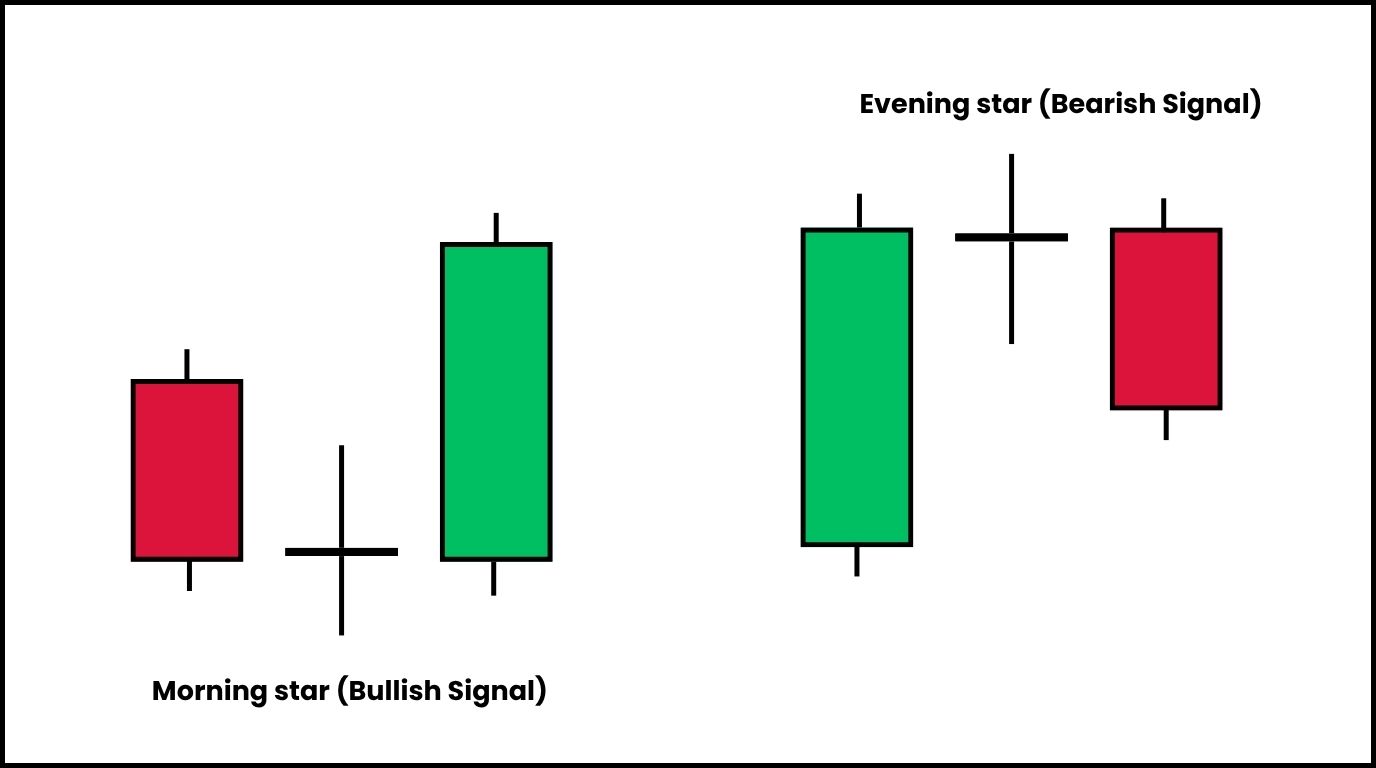
Morning star and Evening star Candlestick
Three-candle reversal pattern
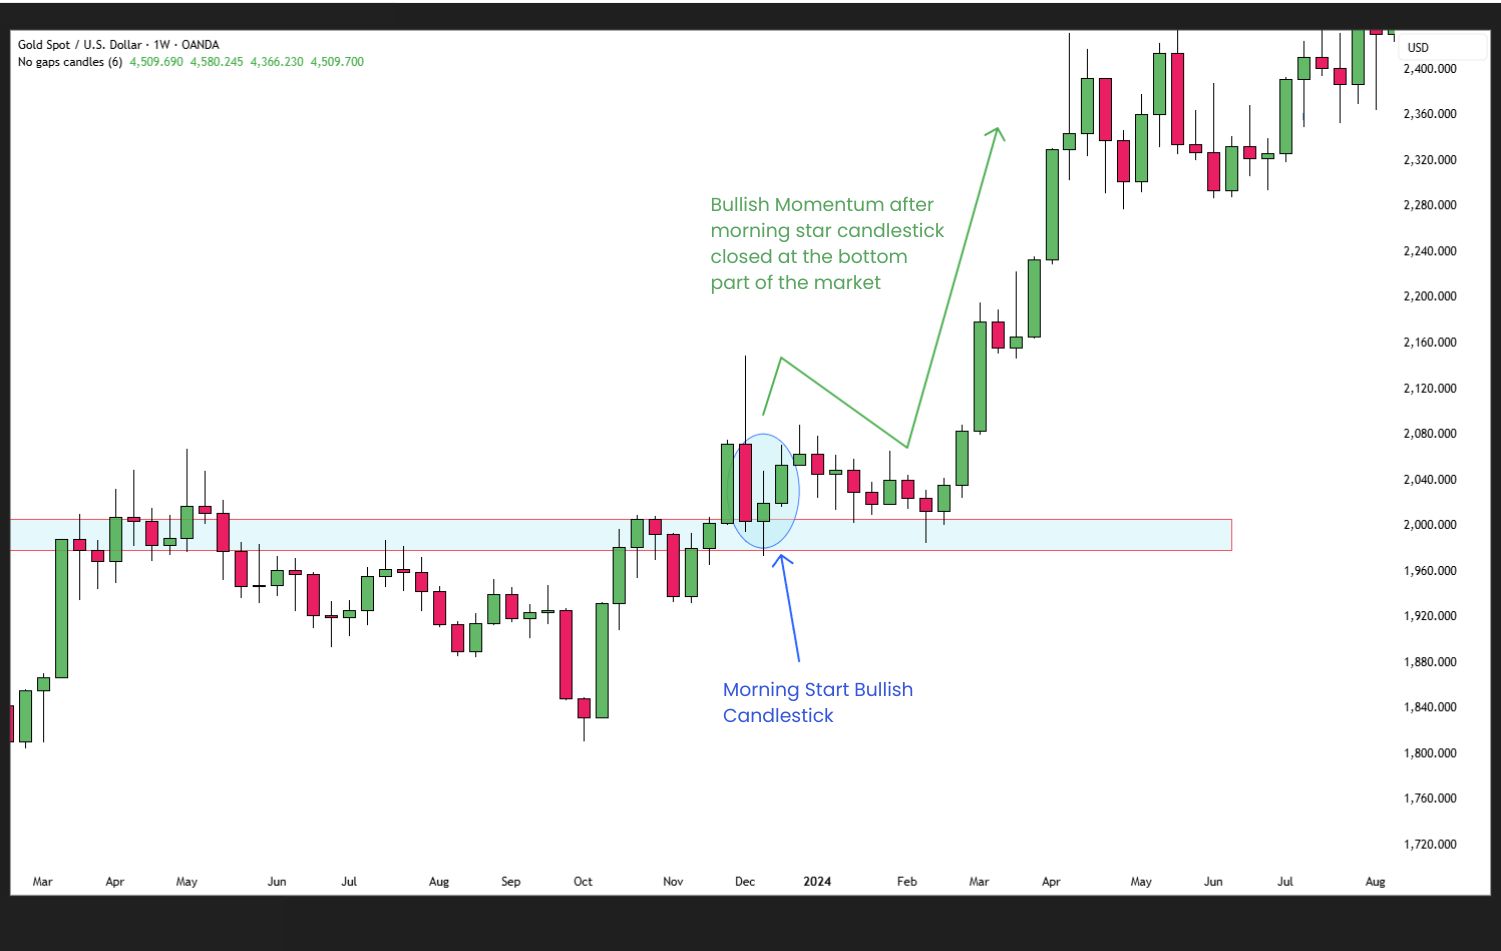
Morning star Candlestick Confirmation
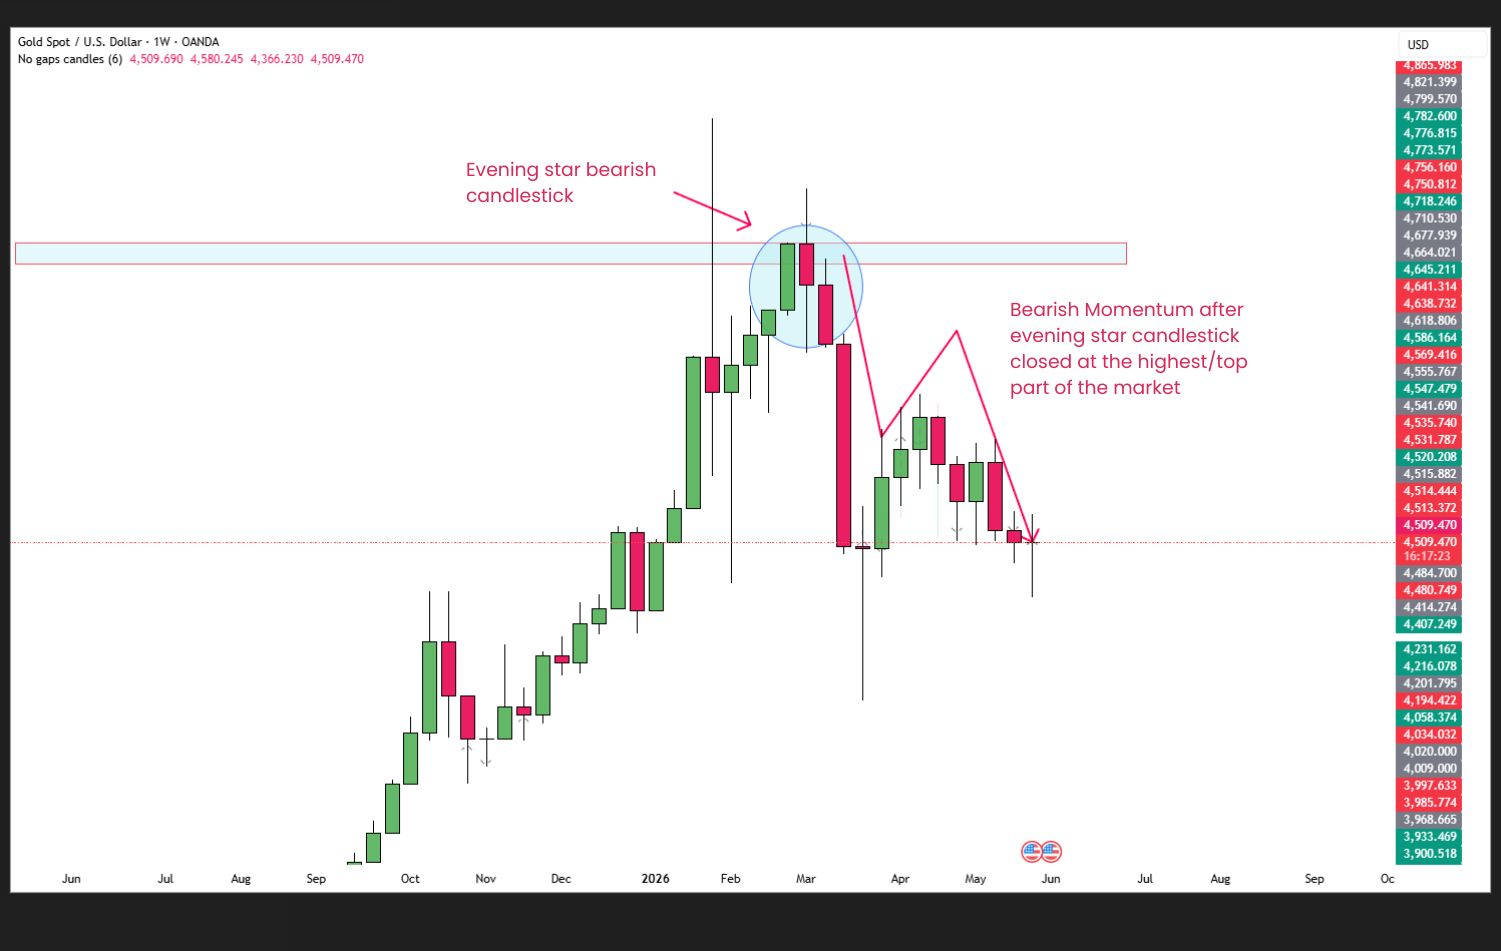
Evening star Candlestick Confirmation
Candlestick patterns alone are NOT enough! A pattern without context is just random candlestick confirmation.
Candlestick pattern and confirmation is best paired with:
This creates a completely structured price action strategy instead of gambling.
Checkout this Blogs, if you want to master the candle stick pattern and confirmation paired up with the Break and Retest Pattern using simple Price action strategy:

Candlestick patterns are powerful because they reveal the battle between buyers and sellers in real time.
But the real edge comes from confirmation!
The best traders in the world do not chase every candle. They wait patiently for the market to confirm direction first.
Because in trading?
Confirmation beats prediction every single time.
Now that if you understand and gained knowledge more about candlestick pattern then,
For more in-depth market breakdowns, real-time analysis, and structured learning content, you can join our Discord community inside ACY Server:
Discord Server - ACY Securities Server
Start your live trading journey today!
• Trade Forex, indices, gold, crypto and other global markets
• Access powerful platforms including ACY, MT4, MT5, and Copy Trading tools
Move from learning simple price action to executing it in the real market with confidence!
Create an Account. Start Your Live Trading Now!
Ready to learn simple price action strategy? Here’s how to do it step by step:
Gold is still one of the most traded assets, here’s how to trade it with confidence:
Your mindset is what separates steady growth from costly mistakes. Focus on these essentials:
Not sure where to begin? Here’s a simple roadmap to guide you:
By building step by step; from basics → real trading → mastering the craft, you’ll gain clarity, confidence, and steady progress without ever feeling overwhelmed.
Follow me for more daily market insights!
Ruffy Grant B. Capacio - LinkedIn
Disclaimer:
Trading forex and derivative instruments involves substantial risk and may not be suitable for all individuals. Only use funds that you are prepared to lose. It is important to understand how these markets work and the risks involved before trading, and to seek independent financial advice if needed. All market analysis and insights shared are intended for educational and informational purposes only and should not be considered financial or investment advice. May 29, 2026
ACY Securities is one of Australia's fastest growing multi-asset online trading providers, offering ultra-low-cost trading, rock-solid execution, technologically superior account management and premium market analysis.
Select the categories and companies you wish to follow directly to your person rss feed.
Create Custom RSS FeedSign up and join over 5,000 professional members who receive personalized news alerts, curated professional connections, and more for free!
Sterling steadies after political uncertainty rattled gilt markets, while EUR/USD and EUR/GBP approach key technical levels ahead of today's European session.
GBP/AUD remains trapped in a well-defined bearish trend on both the weekly and daily timeframes.
Discover the key drivers, technical levels, and central bank expectations shaping the EUR/USD trend as the ECB prepares to hold rates and markets watch for a potential breakout.
Sydney-based multi-asset broker ACY Securities has introduced PAXGUSD, a new CFD instrument that allows clients to trade tokenised gold against the US Dollar 24 hours a day, seven days a week. The instrument is available across MetaTrader 4, MetaTrader 5, and the ACY Trading Platform.
Binance has lowered its VIP 3 Wallet Assets threshold from $3 million to $1 million and will now count OTC Spot Trading Volume at a 4x multiplier toward VIP qualification, removing the previous VIP 4 cap and allowing eligible users to progress through the full tier framework up to VIP 9.
Retail futures trading leader NinjaTrader Group has appointed Mark Omens as Senior Vice President, Commercial Strategy, bringing a 25-year veteran of derivatives marketplace CME Group into a newly created role focused on exchange partnerships and enterprise growth.
Gold Price Action Forecast: Will XAU/USD Drop to $3930? Meta Description: Read our Gold price action forecast to see if XAU/USD will drop to $3930.
BitDelta Securities Financial Services LLC (“BitDelta Securities”) today announced that it has received full regulatory approval from the Capital Market Authority (“CMA”) of the United Arab Emirates under the Category 5 — Arrangement and Advice license framework (License No. 20200000439). The approval follows the firm's receipt of In-Principal Approval earlier this year and represents the successful conclusion of the CMA's full licensing process, including the satisfaction of capital requirements, governance appointments, and operational setup.
Crypto.com has received a $400 million strategic investment from Citadel Securities, valuing the firm at $20 billion. It marks the first institutional funding round in the company's history, aimed at accelerating its expansion into tokenised securities, derivatives and other asset classes.
WTI’s pullback into $79–82 is the first major test of the bullish Elliott Wave count, with buyers targeting a renewed break above $85.


