just now

Liquidity Finder Ltd is incorporated in England and Wales, company number 10610740, registered address 167-169 Great Portland Street, Fifth Floor, London W1W 5PF, United Kingdom.
Published: just now
Most traders are obsessed with finding the perfect entry. They want precision, timing, and confirmation all at once. But markets don’t reward precision as much as they reward alignment. This is where the MACD histogram quietly becomes one of the most misunderstood yet powerful tools in technical analysis.
When the MACD histogram is read correctly, it stops being about entries and starts becoming about conditions. It tells you whether momentum is strengthening, weakening, or quietly bleeding out beneath the surface. And once you understand this, you stop fighting the market and start flowing with it.
This article breaks down how to use the MACD histogram as a momentum strength indicator, not a trigger. You’ll learn how expansion and contraction reveal trend health, how exhaustion shows up before price reacts, and how this perspective helps you stay in winning trades longer instead of cutting them short out of fear.
The MACD histogram measures the difference between the MACD line and the signal line. In simple terms, it measures momentum pressure.
Every histogram bar answers one question:
Is momentum increasing or decreasing right now?
That’s it.
It does not predict price. It does not tell you where to enter. It tells you whether the move you’re watching is being supported or starved.
Once you shift your mindset from entries to conditions, the histogram becomes a filter that keeps you out of weak trades and helps you commit to strong ones.
Histogram expansion means momentum is accelerating.
This usually appears:
Expansion shows that participation is increasing. More traders are committing in the same direction, and price movement is not being forced.
The speed of expansion matters. Sharp expansion shows urgency. Smooth, steady expansion shows control. Both can be profitable, but they tell very different stories about the market’s intent.
Momentum contraction is where most traders get confused.
Price may still be moving higher or lower, but the histogram starts shrinking. This tells you that participation is fading. The move is still alive, but it’s becoming fragile.
Contraction does not mean reversal. It means vulnerability.
This is where traders should stop adding risk, tighten focus, and start managing instead of chasing.
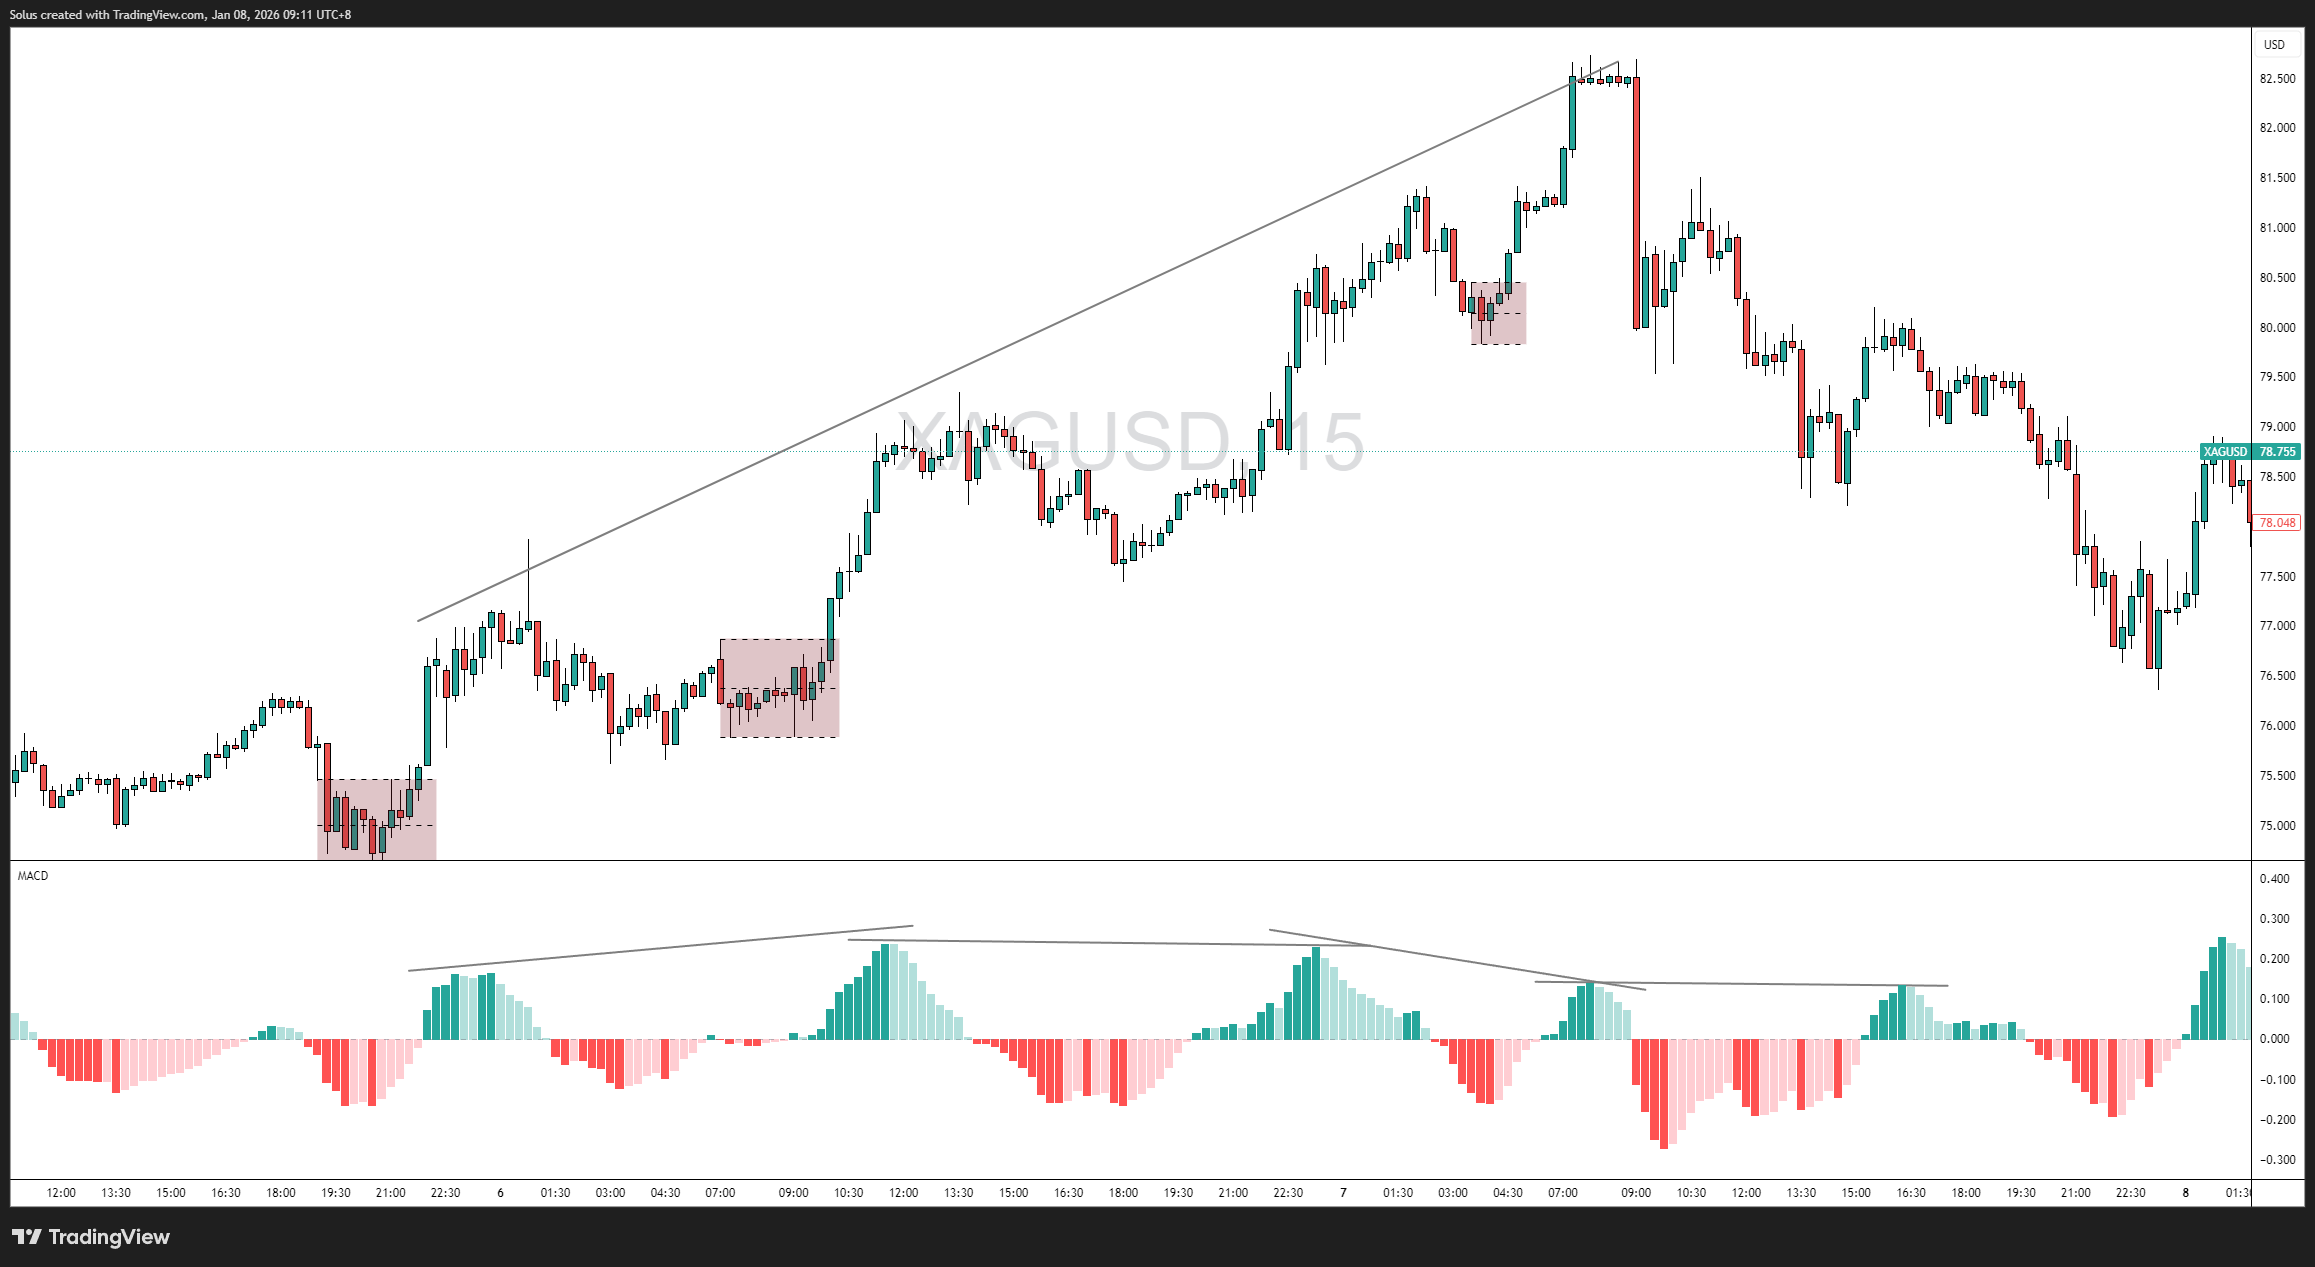
Instead of staring at individual bars, pay attention to the slope of the histogram.
A healthy trend shows:
This tells you the trend is being defended.
A weakening trend shows:
Price might still be trending, but it’s running on borrowed energy.
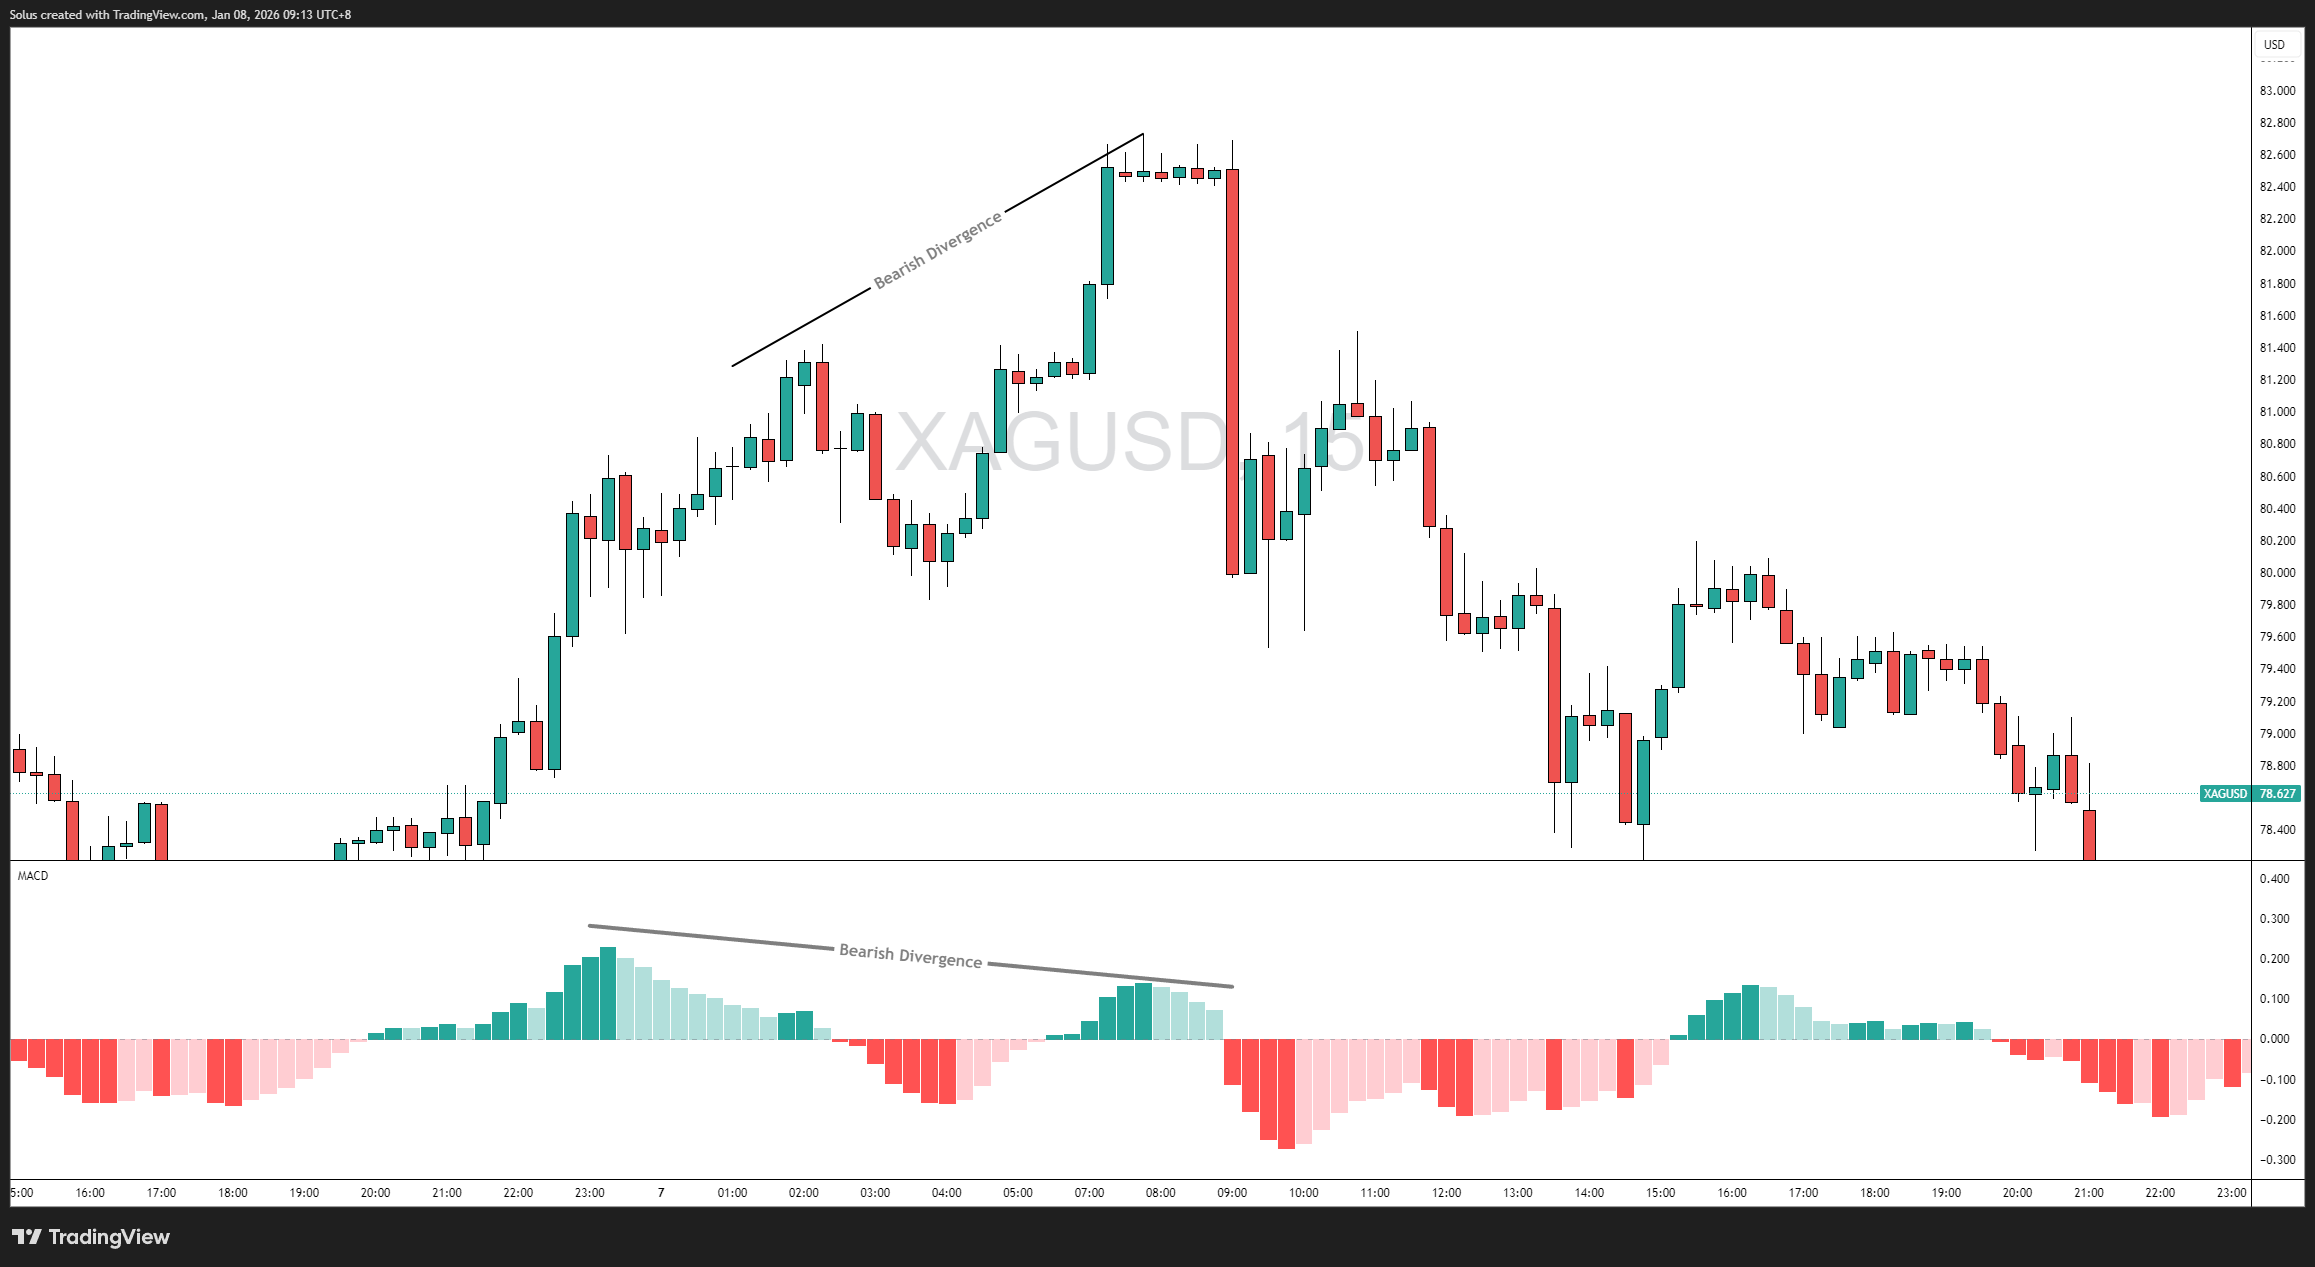
Price hides exhaustion. Momentum exposes it.
Before most reversals, you’ll notice:
This is not a sell signal. It’s a warning label.
Strong trends don’t reverse suddenly. They slow down first. The histogram lets you see that slowdown before fear hits the chart.
Most traders exit winning trades too early because they confuse pullbacks with reversals.
The histogram fixes this problem.
Instead of asking:
“Did price pull back?”
Ask:
“Did momentum collapse?”
If contraction is shallow and momentum rebuilds, the trend is likely intact. If contraction accelerates and expansion fails, the trend is losing sponsorship.
This approach helps you:
Price is the flame.
Momentum is the heat.
A fire doesn’t go out the moment the flame flickers. It dies when the heat disappears.
The MACD histogram measures heat.
By the time the room goes dark, the fire was already dying long before. Momentum tells you that story early.
The MACD histogram measures the rate of change of momentum by tracking the distance between the MACD line and the signal line.
No. Contraction signals weakening momentum, not guaranteed reversal. It’s a condition warning, not an entry trigger.
Yes. Histogram behavior is excellent for managing trades, staying in trends, and exiting when momentum truly fades.
For reading conditions and momentum strength, the histogram is far more useful than crossovers, which are delayed and context-dependent.
It’s time to go from theory to execution!
Create an Account. Start Your Live Trading Now!
Looking for step-by-step approaches you can plug straight into the charts? Start here:
Sharpen your edge with proven tools and frameworks:
News moves markets fast. Learn how to keep pace with SMC-based playbooks:
From NASDAQ opens to DAX trends, here’s how to approach indices like a pro:
Gold remains one of the most traded assets - here’s how to approach it with confidence:
Candlesticks are the building blocks of price action. Master the most powerful ones:
Ready to go intraday? Here’s how to build consistency step by step:
Markets swing between calm and chaos. Learn to read risk-on vs risk-off like a pro:
Step inside the playbook of institutional traders with SMC concepts explained:
Forex pairs aren’t created equal - some are stable, some are volatile, others tied to commodities or sessions.
If you’ve ever been stopped out right before the market reverses - this is why:
Mindset is the deciding factor between growth and blowups. Explore these essentials:
The real edge in trading isn’t strategy - it’s how you protect your capital:
If you’re not sure where to start, follow this roadmap:
This way, you’ll grow from foundation → application → mastery, instead of jumping around randomly.
Follow me for more daily market insights!
Jasper Osita - LinkedIn - FXStreet - YouTube
This content may have been written by a third party. ACY makes no representation or warranty and assumes no liability as to the accuracy or completeness of the information provided, nor any loss arising from any investment based on a recommendation, forecast or other information supplies by any third-party. This content is information only, and does not constitute financial, investment or other advice on which you can rely.
ACY Securities is one of Australia's fastest growing multi-asset online trading providers, offering ultra-low-cost trading, rock-solid execution, technologically superior account management and premium market analysis.
Select the categories and companies you wish to follow directly to your person rss feed.
Create Custom RSS FeedSign up and join over 5,000 professional members who receive personalized news alerts, curated professional connections, and more for free!
Binance has lowered its VIP 3 Wallet Assets threshold from $3 million to $1 million and will now count OTC Spot Trading Volume at a 4x multiplier toward VIP qualification, removing the previous VIP 4 cap and allowing eligible users to progress through the full tier framework up to VIP 9.
Retail futures trading leader NinjaTrader Group has appointed Mark Omens as Senior Vice President, Commercial Strategy, bringing a 25-year veteran of derivatives marketplace CME Group into a newly created role focused on exchange partnerships and enterprise growth.
Gold Price Action Forecast: Will XAU/USD Drop to $3930? Meta Description: Read our Gold price action forecast to see if XAU/USD will drop to $3930.
BitDelta Securities Financial Services LLC (“BitDelta Securities”) today announced that it has received full regulatory approval from the Capital Market Authority (“CMA”) of the United Arab Emirates under the Category 5 — Arrangement and Advice license framework (License No. 20200000439). The approval follows the firm's receipt of In-Principal Approval earlier this year and represents the successful conclusion of the CMA's full licensing process, including the satisfaction of capital requirements, governance appointments, and operational setup.
Crypto.com has received a $400 million strategic investment from Citadel Securities, valuing the firm at $20 billion. It marks the first institutional funding round in the company's history, aimed at accelerating its expansion into tokenised securities, derivatives and other asset classes.
WTI’s pullback into $79–82 is the first major test of the bullish Elliott Wave count, with buyers targeting a renewed break above $85.

BitDelta Securities has secured a full CMA Category 5 licence in the UAE and opened a regulated office in Business Bay, Dubai. The firm operates as an introducing broker, connecting investors with licensed international brokers across multiple asset classes, with CEO Dr. Demetrios Zamboglou commenting on the milestone.
Index volatility is asleep while single stocks fight it out underneath, credit refuses to confirm the equity rally, and a bare macro calendar hands next week to oil.
Digital assets and FX brokerage GC Exchange FZE (GCEX) has appointed Mohammed A. Mulla as a Board Member of its Dubai-based entity, part of the wider GCEX Group.
Learn what Blockchain-as-a-Service is, how it works, and why businesses are using BaaS to build blockchain applications without managing infrastructure.


