just now


Liquidity Finder Ltd is incorporated in England and Wales, company number 10610740, registered address 167-169 Great Portland Street, Fifth Floor, London W1W 5PF, United Kingdom.
Published: just now
Order blocks don’t exist in isolation. They live inside the skeleton of market structure - where breakouts, reversals, and continuations reveal whether institutions are defending, reloading, or exiting their positions. To truly understand order blocks, you must see them as the structural language that institutions speak through AMD (Accumulation–Manipulation–Distribution) - the rhythmic flow of every market cycle. This process forms the foundation of Smart Money Concepts, transforming what looks like random candles into a readable story of intent and control.
When you learn to combine structure (BOS, CHoCH) with correctly marked order blocks, something shifts: you stop reacting to price and start interpreting it. Every move begins to make sense because you now understand why it’s happening, not just what is happening.
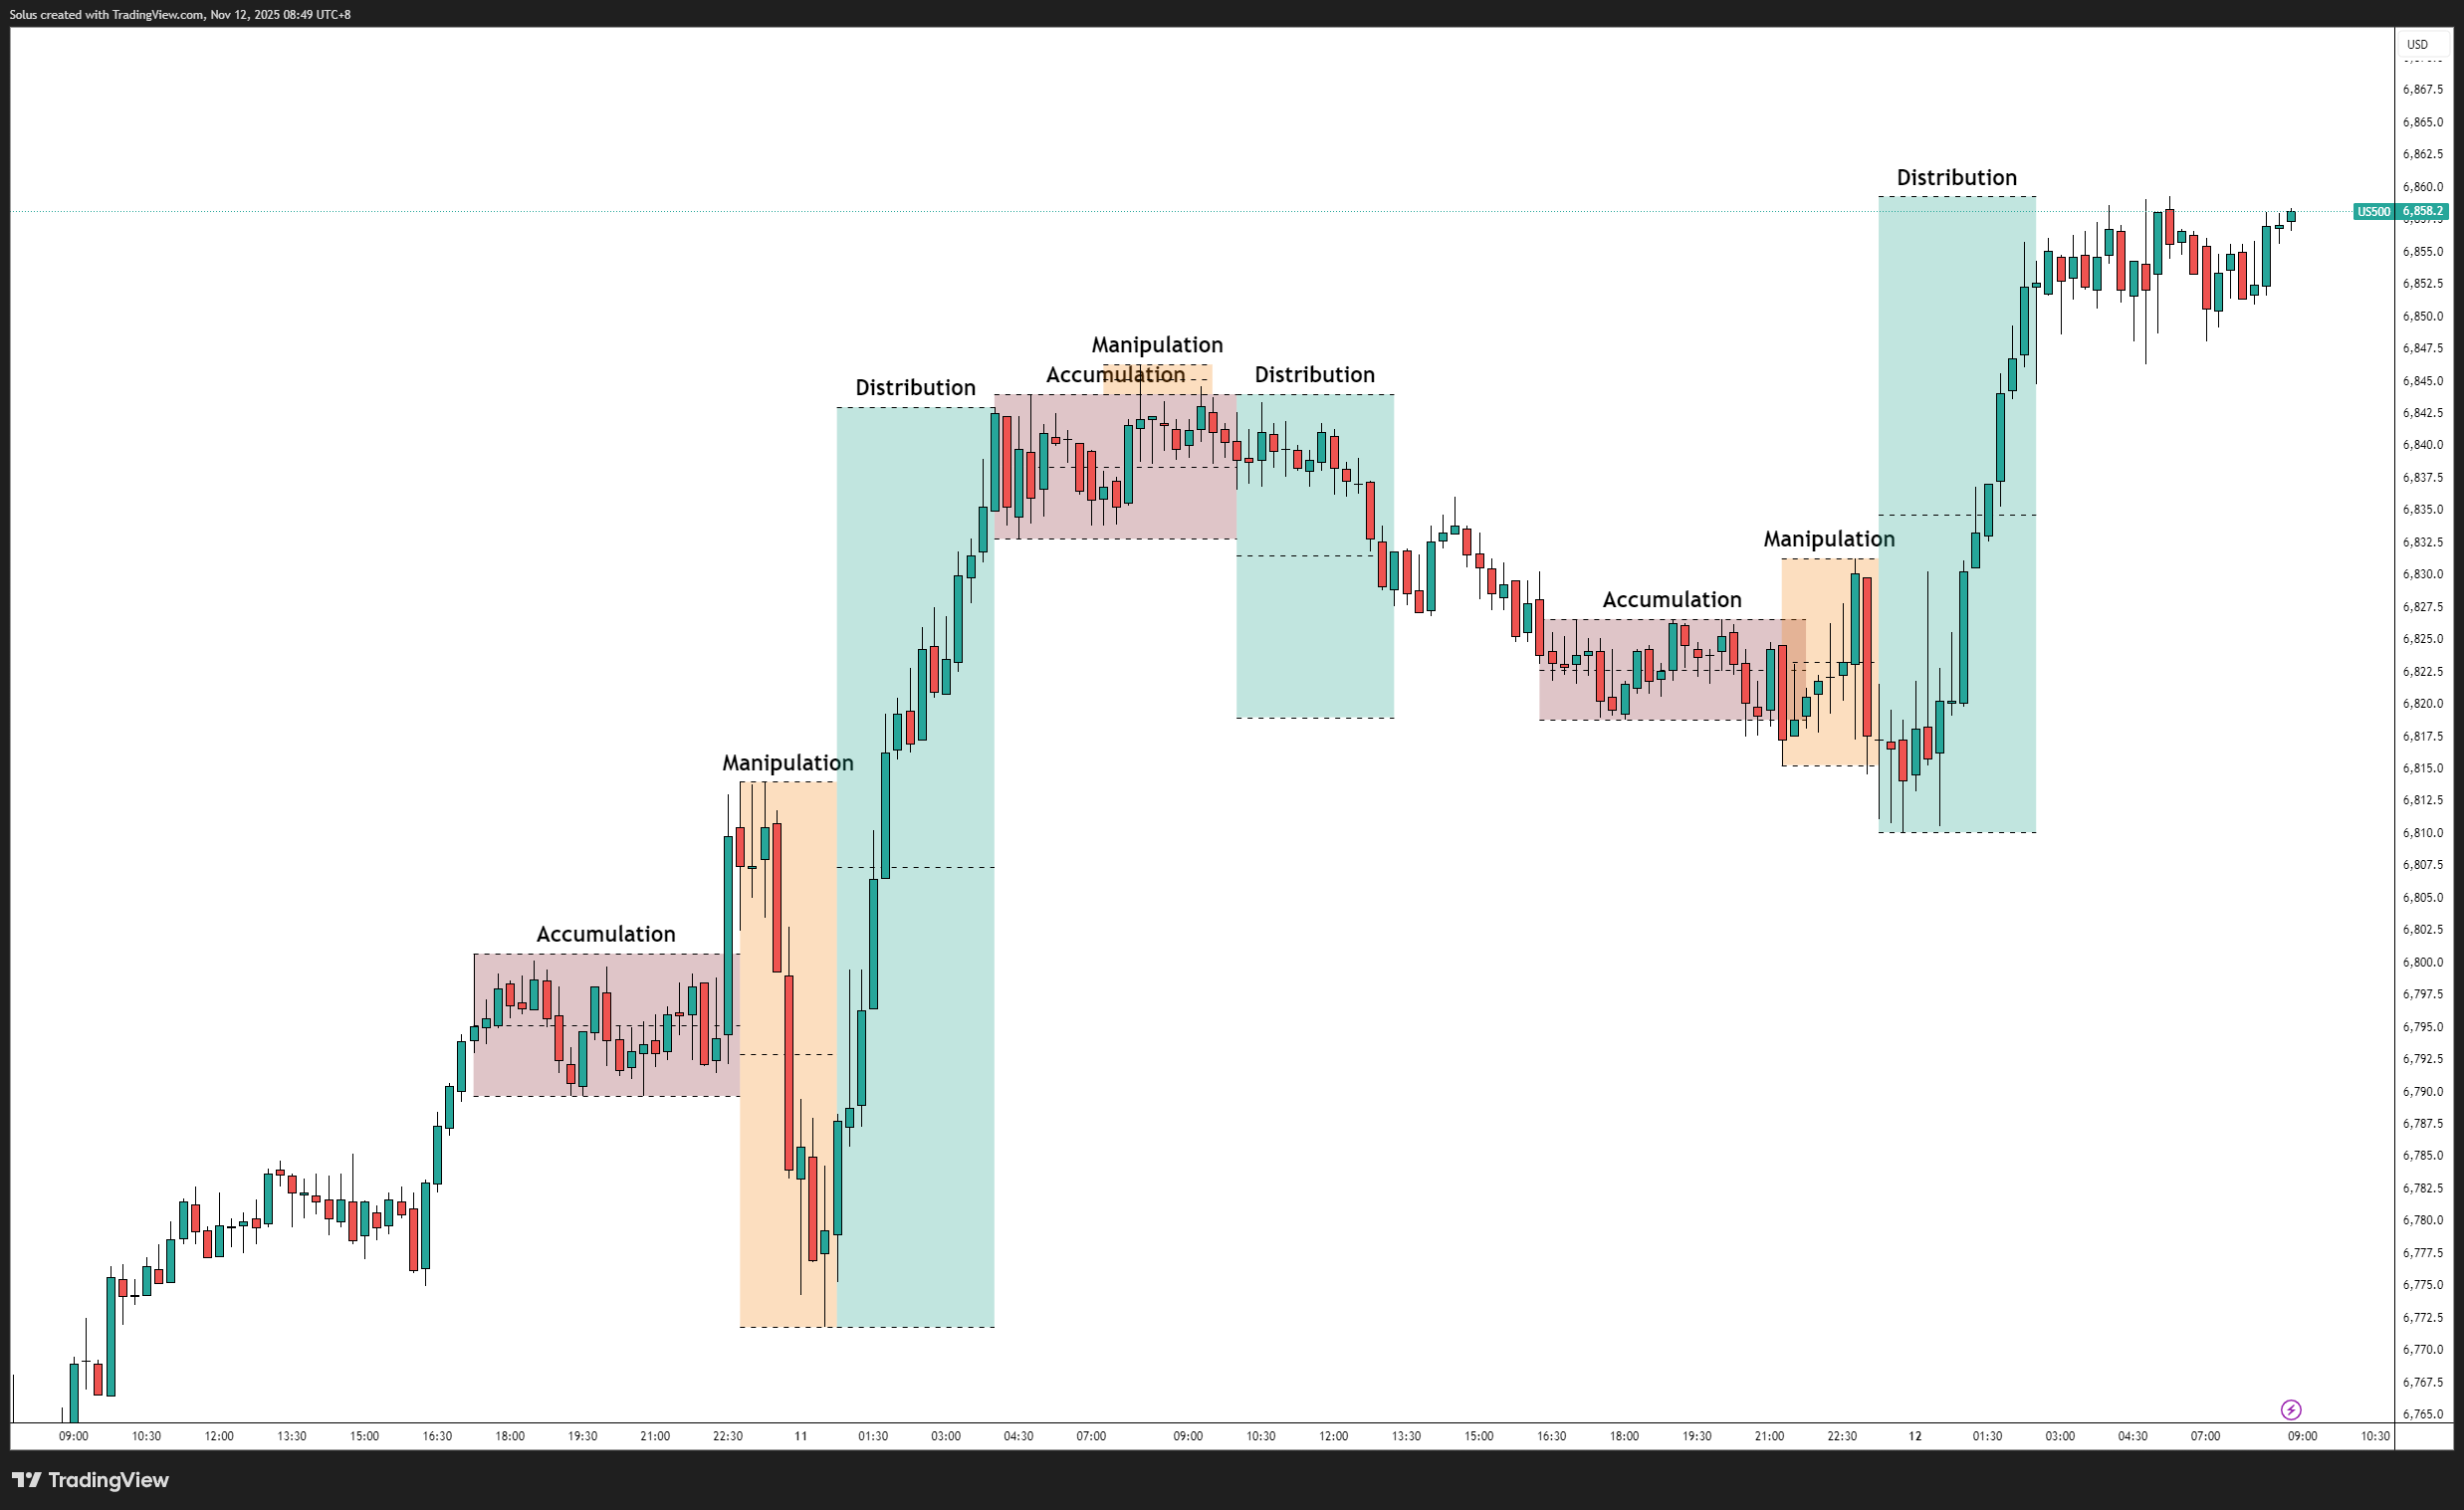
The AMD Framework breaks down all price movements into three recurring stages - Accumulation, Manipulation, and Distribution - each showing how smart money engineers liquidity and transitions from one phase to the next. It’s the silent choreography behind the markets, reflecting the same logic outlined in Accumulation, Manipulation, Distribution.
Inside this rhythm, order blocks are the anchor points - zones of accumulation or distribution that reveal where smart money re-enters the trend. They are the memory of institutional action, the reference points that define how price returns to balance before its next leg.
Think of market structure as the skeleton, and order blocks as the vertebrae that hold it upright. Without them, the entire body of price action collapses into noise.
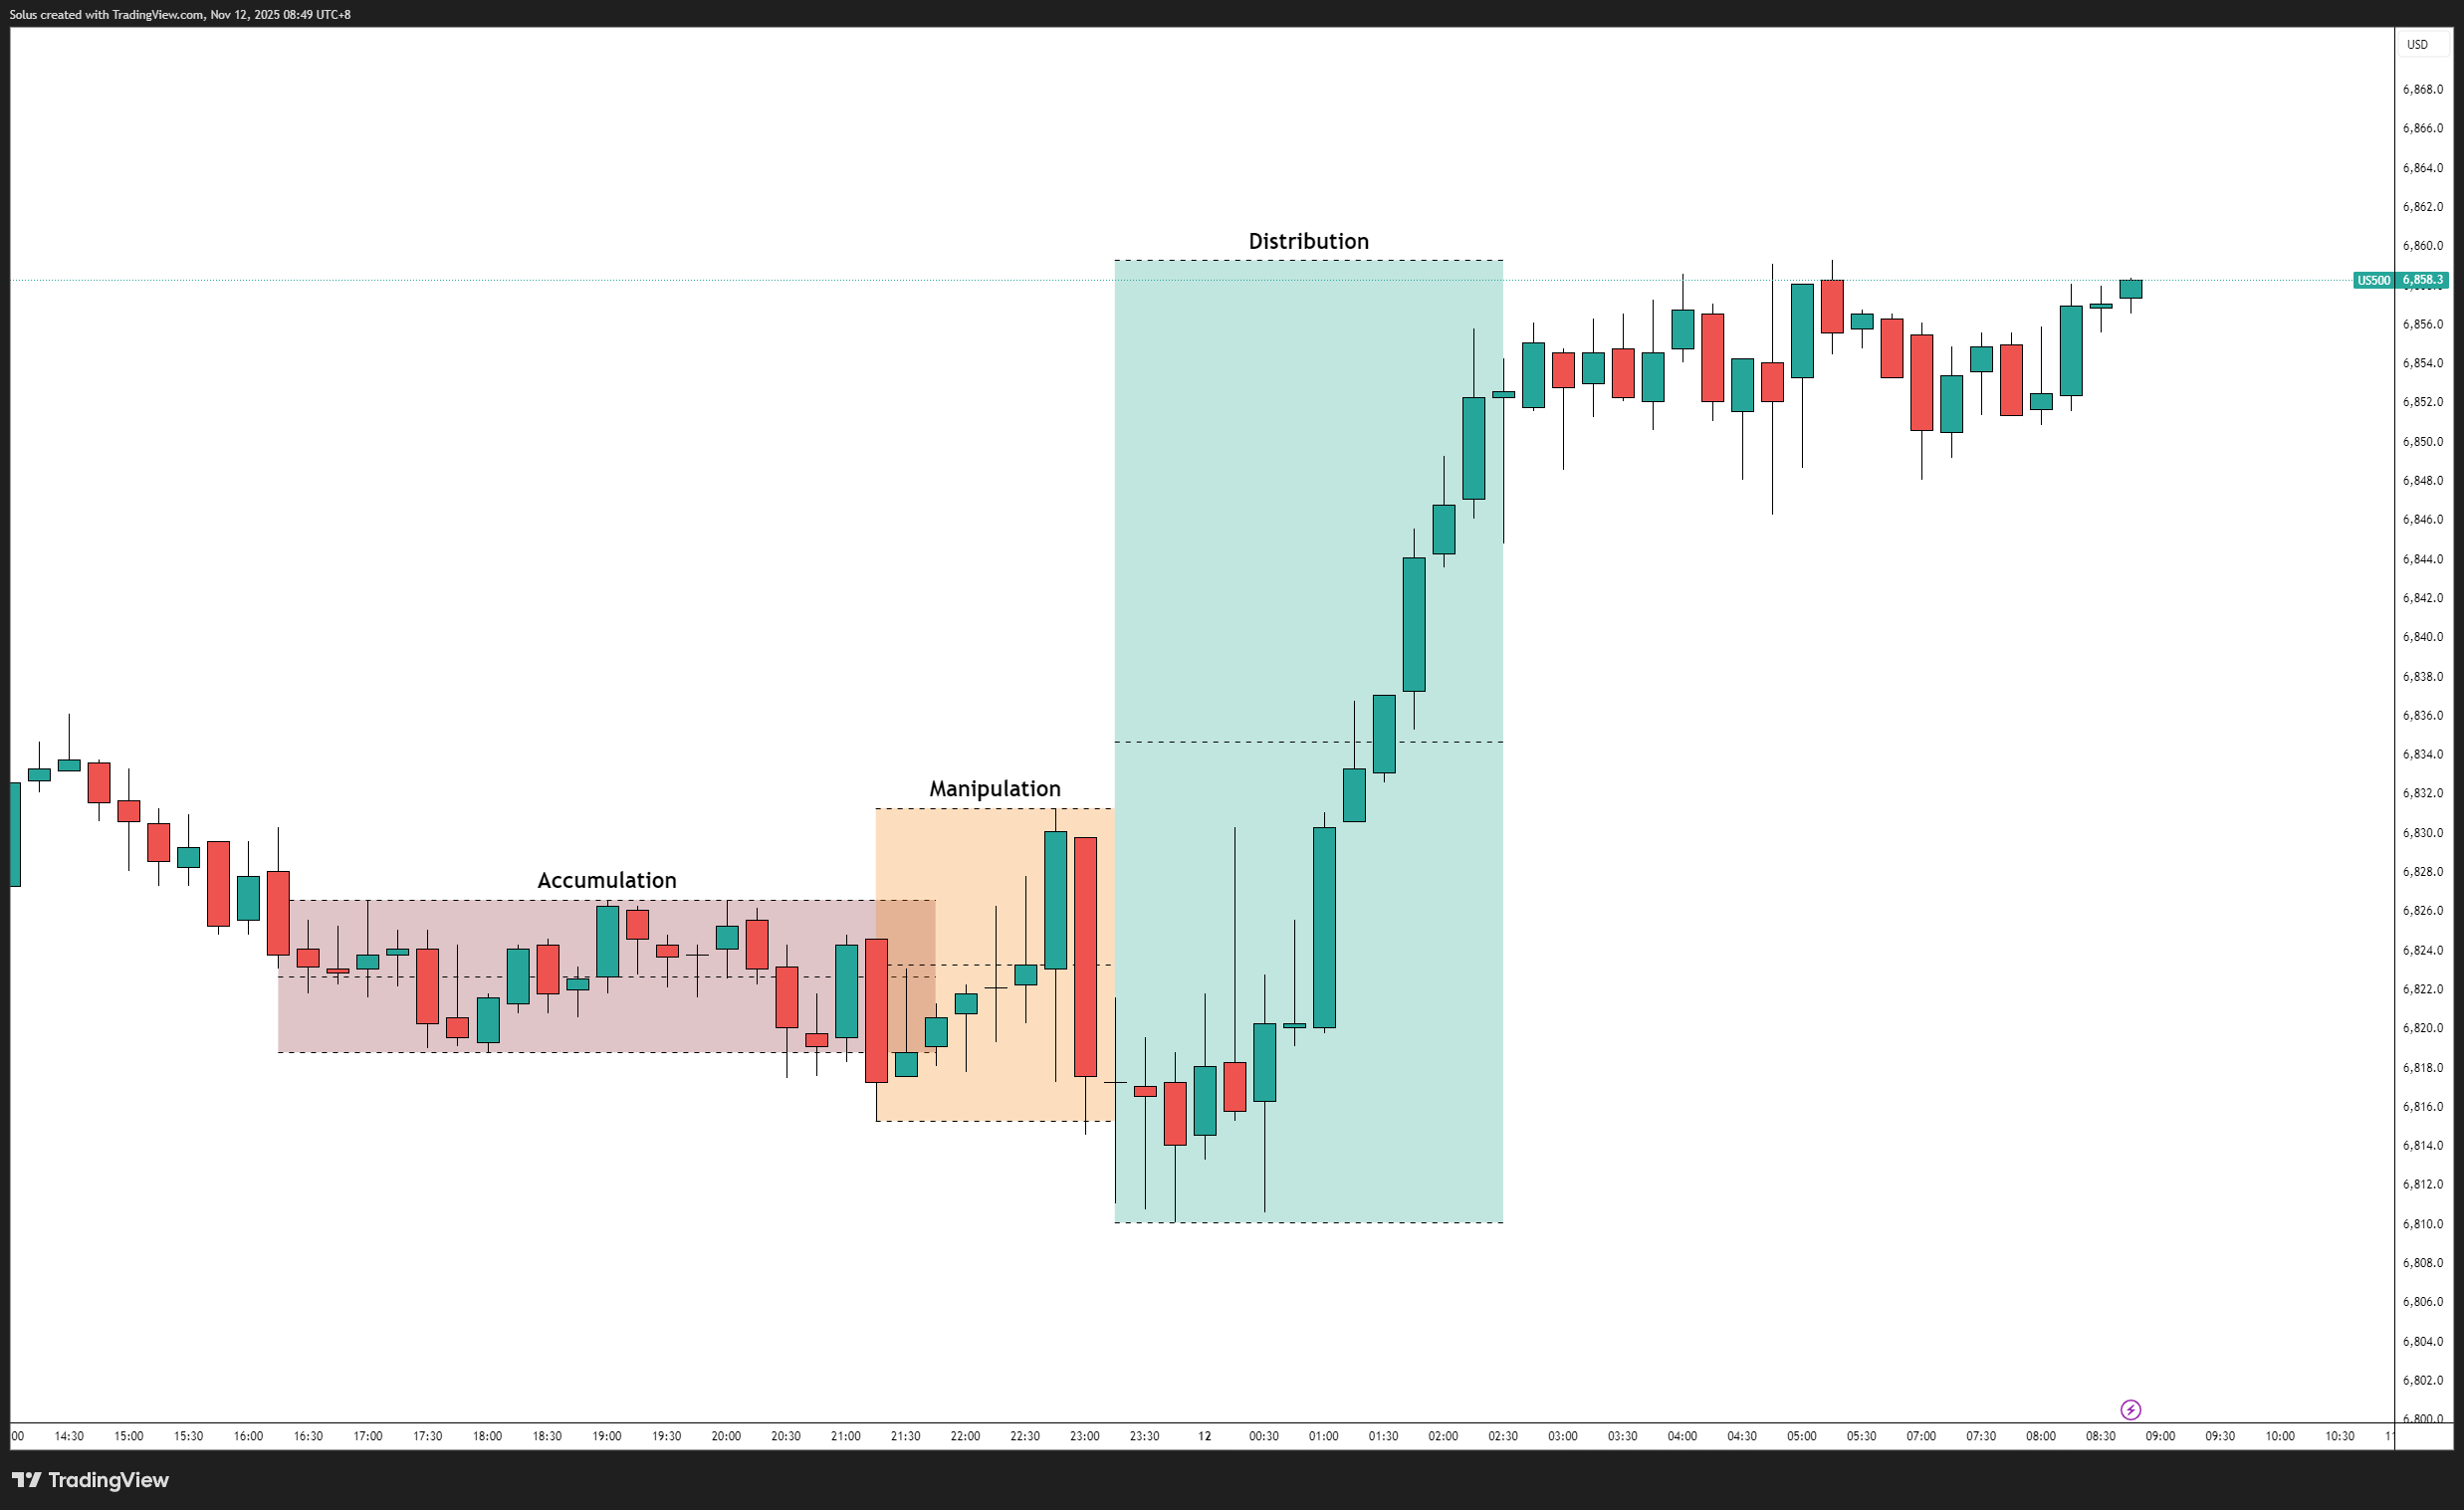
The AMD model is the heartbeat of Smart Money Concepts. It’s what separates random trading boxes from meaningful institutional footprints. Without understanding which phase the market is in, an order block is just a rectangle with no story.
In the accumulation phase, price consolidates within a narrow range. Many traders misinterpret this chop as indecision - but in reality, it’s position building. Institutions are absorbing liquidity quietly. Every “mini” OB you mark here is likely internal and weak because intent hasn’t yet been revealed.
The goal is not to trade accumulation; it’s to observe it. Only after manipulation occurs does the true bias emerge. This is where patience pays.
This is where the “fake breakout” happens. Liquidity above or below the range gets taken, retail traders are trapped, and institutions prepare for displacement.
The OB that forms right before manipulation resolves is often the real institutional footprint. It’s the candle that led to the liquidity sweep before the market chose its real direction.
Here, price expands decisively. This is the phase where your BOS (Break of Structure) confirms direction. The last OB before the move becomes a continuation zone - the same logic detailed in Anatomy of a Perfect Execution.
Once this OB forms, every retracement back into it should be seen as a potential institutional re-entry point.
This repetitive cycle of build–trap–displace is what gives Smart Money traders a map. Every time you identify where the market currently sits within AMD, you regain clarity in chaos.
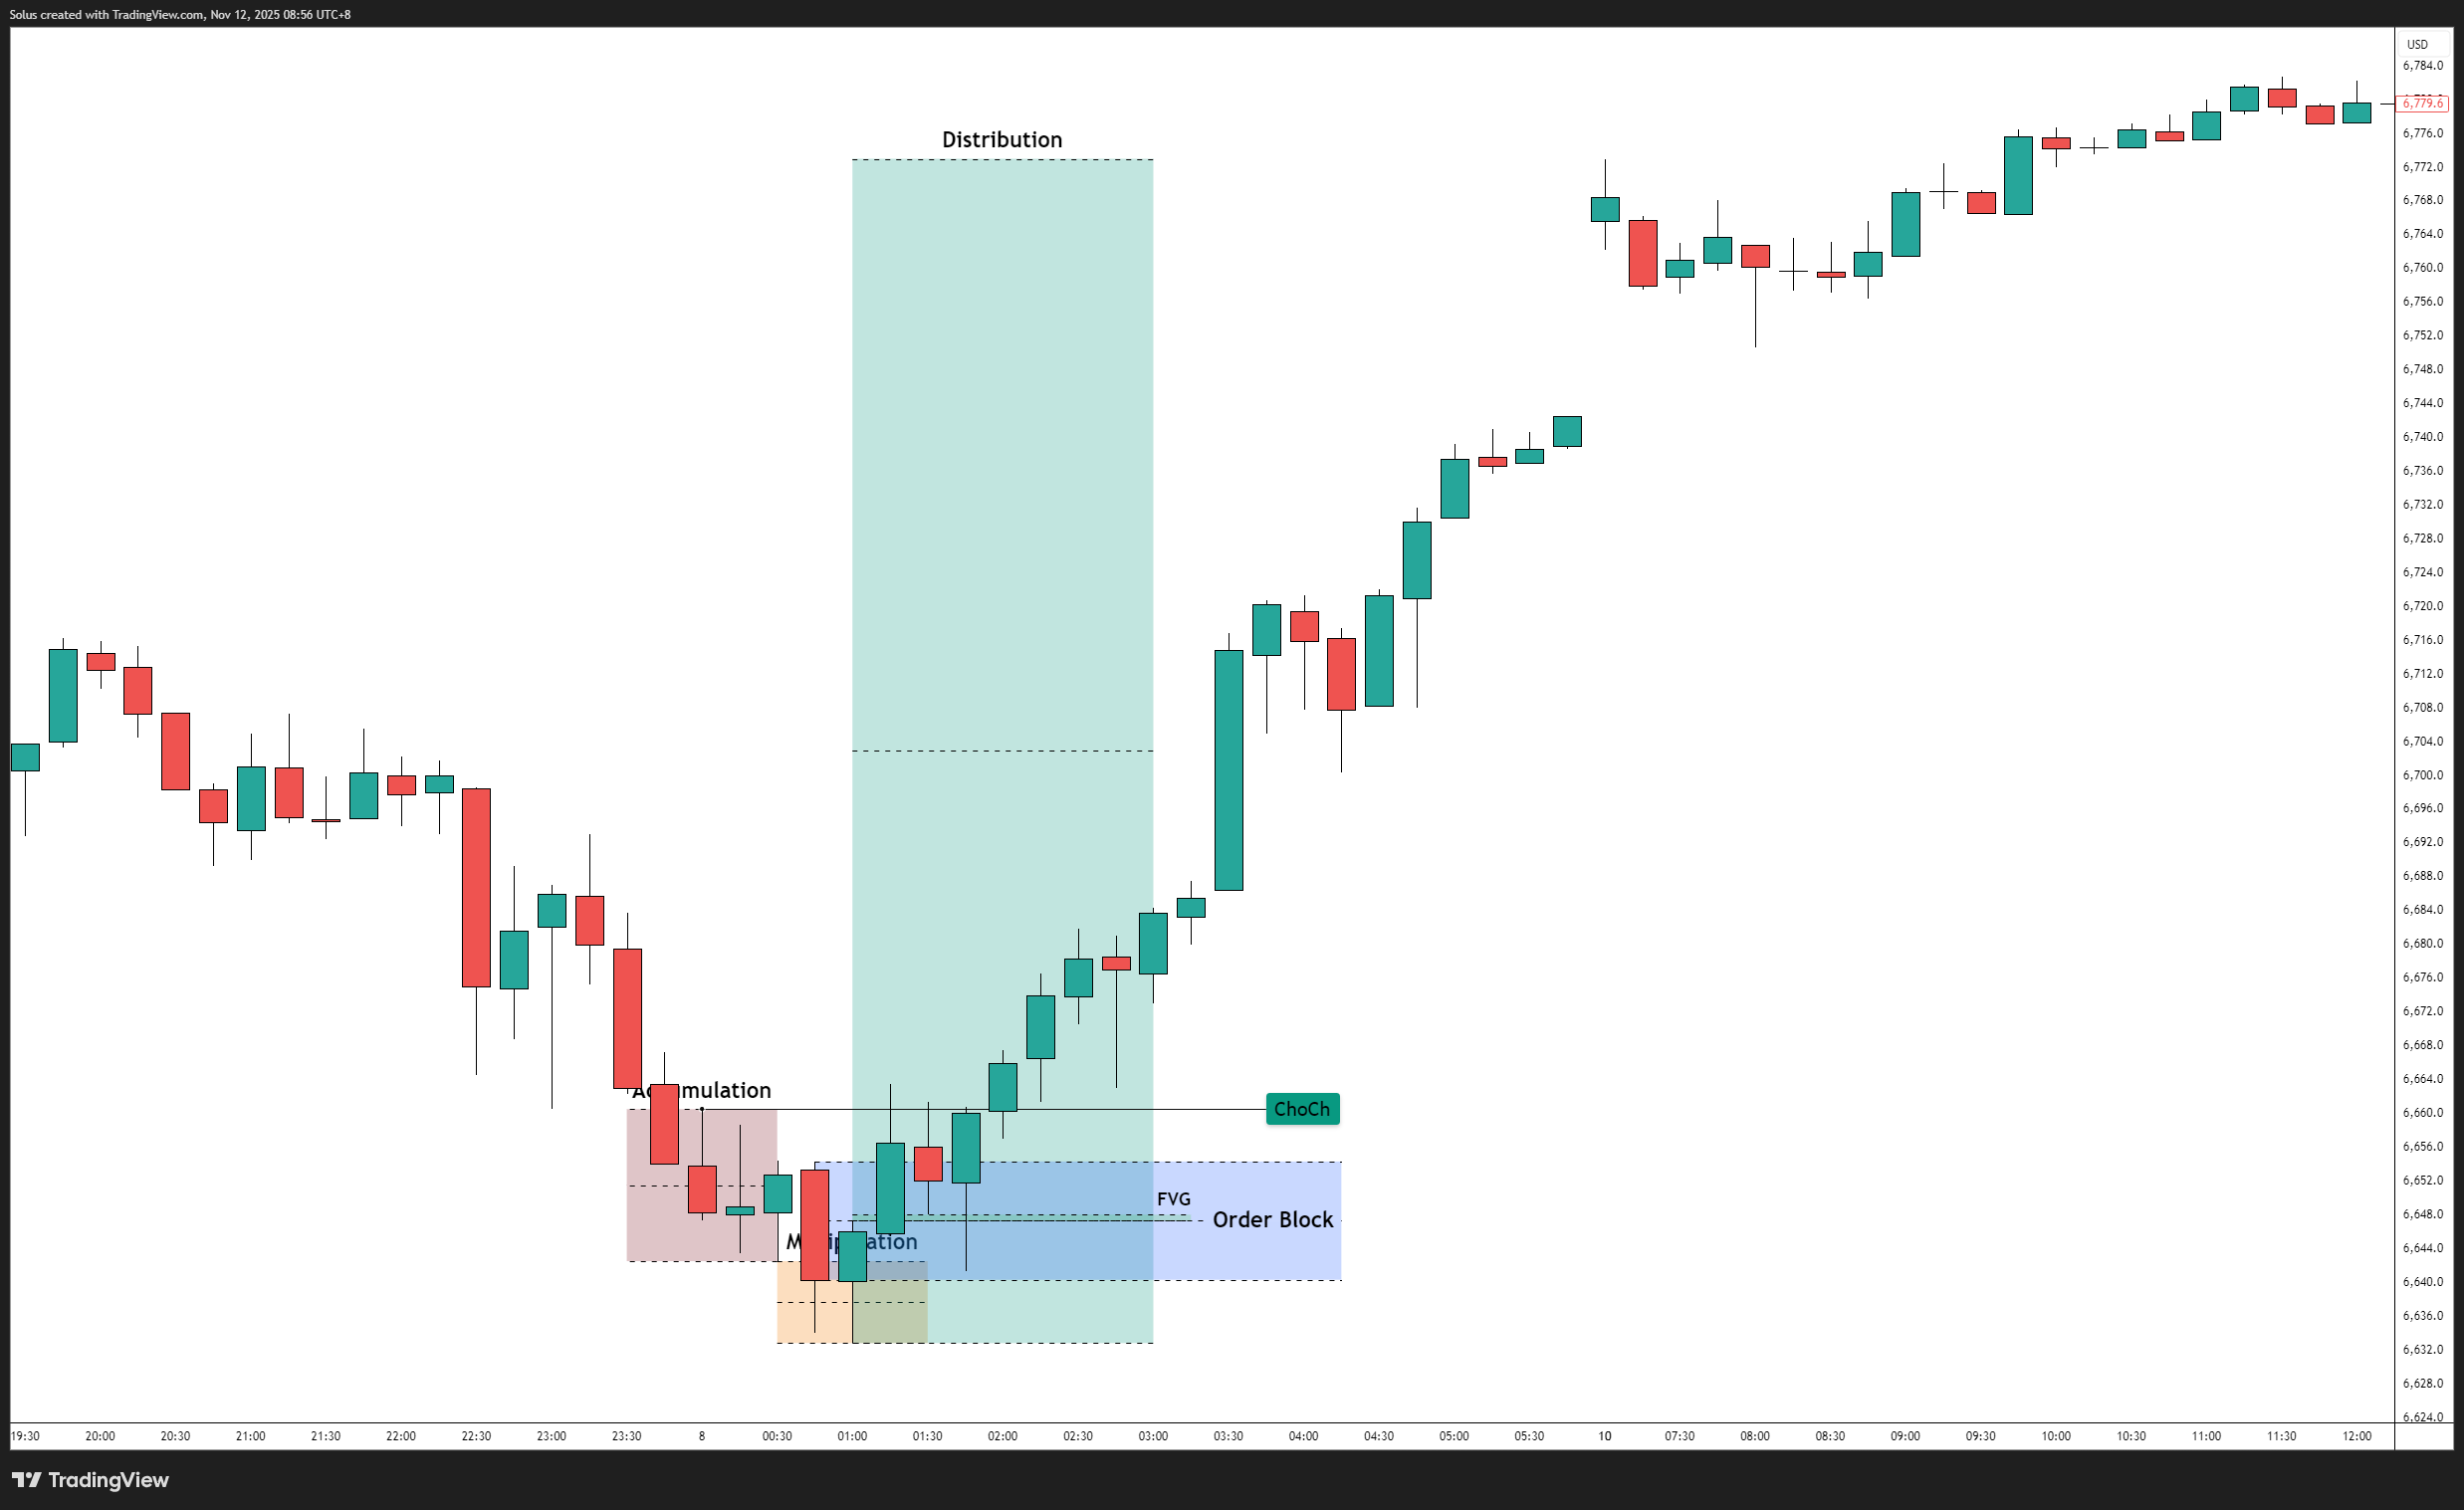
A Change of Character (CHoCH) signals the transition between AMD cycles. It tells you that manipulation has finished and a new accumulation/distribution phase is beginning.
This is where many traders get confused: a CHoCH is not just a break of structure - it’s a shift in intent. When price sweeps liquidity and moves in the opposite direction with momentum, the last opposing candle becomes the CHoCH order block.
These OBs often form at key pivot zones where the market switches from distribution to accumulation or vice versa. To identify them accurately, study the broader Institutional Order Flow and look for where displacement aligns with liquidity engineering.
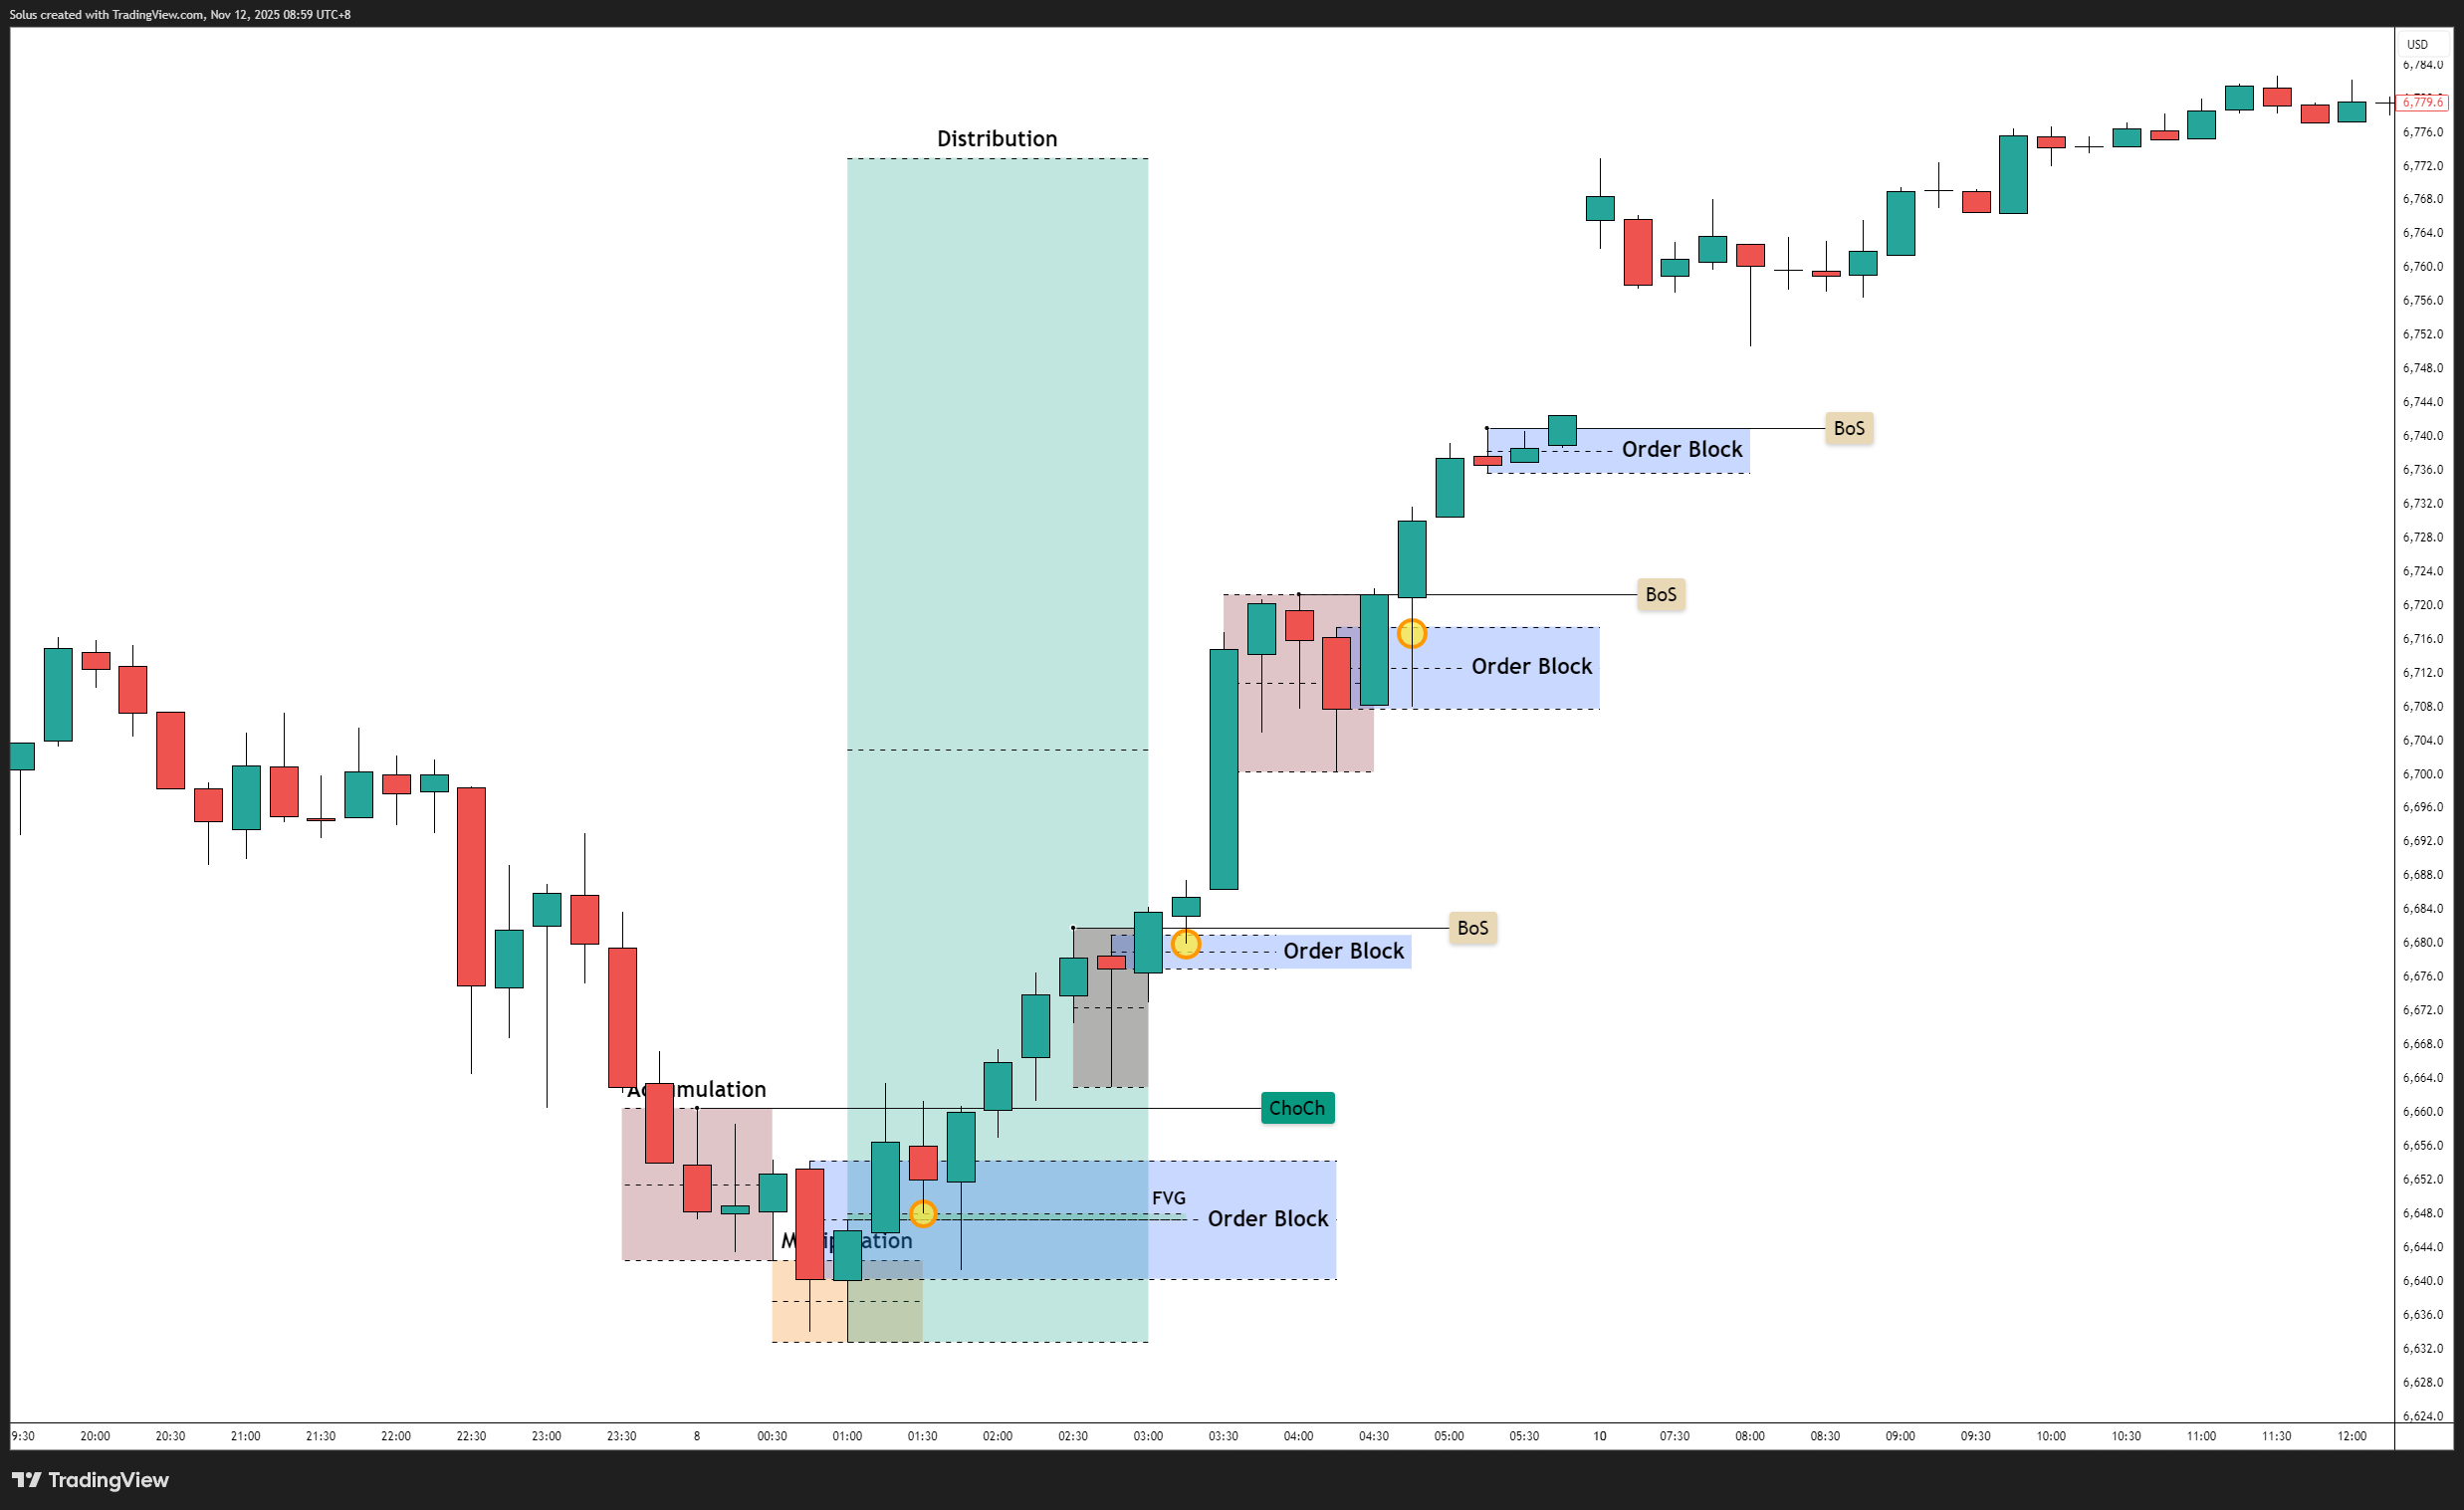
A Break of Structure (BOS) is confirmation of trend continuation. It represents institutional conviction - when price breaks a prior high or low with force and displacement. The OB before that break is your continuation zone, showing where institutions reloaded positions.
These OBs are usually found in the distribution phase of the AMD cycle, where price leaves behind unmitigated imbalances that often overlap with Fair Value Gaps. When price revisits this zone, it’s not random - it’s smart money refilling orders to continue the trend.
Inside accumulation, internal OBs are everywhere. Every minor reaction looks like an entry - but they’re often false signals. These OBs form from micro-balances within the range, representing transactions between short-term participants rather than institutions.
Until manipulation happens, these internal OBs should be treated with caution. They don’t represent true intent; they’re placeholders of liquidity buildup.
Internal range OBs are useful only for intraday refinement - for example, dropping from H1 to M5 to pinpoint smaller zones for precise entries. But on higher timeframes, they hold little structural value until the AMD phase completes.
| Feature | BOS-Based OB | CHoCH-Based OB |
|---|---|---|
| Direction | With trend | Against prior trend |
| Function | Continuation / Reload | Reversal / Shift |
| Phase (AMD) | Distribution | Manipulation to Accumulation |
| Context | After impulsive displacement | After liquidity sweep |
| Reliability | High in trending markets | High at exhaustion points |
Both play crucial roles in confirming institutional behavior. BOS-based OBs show continuation strength, while CHoCH OBs show where control changes hands.
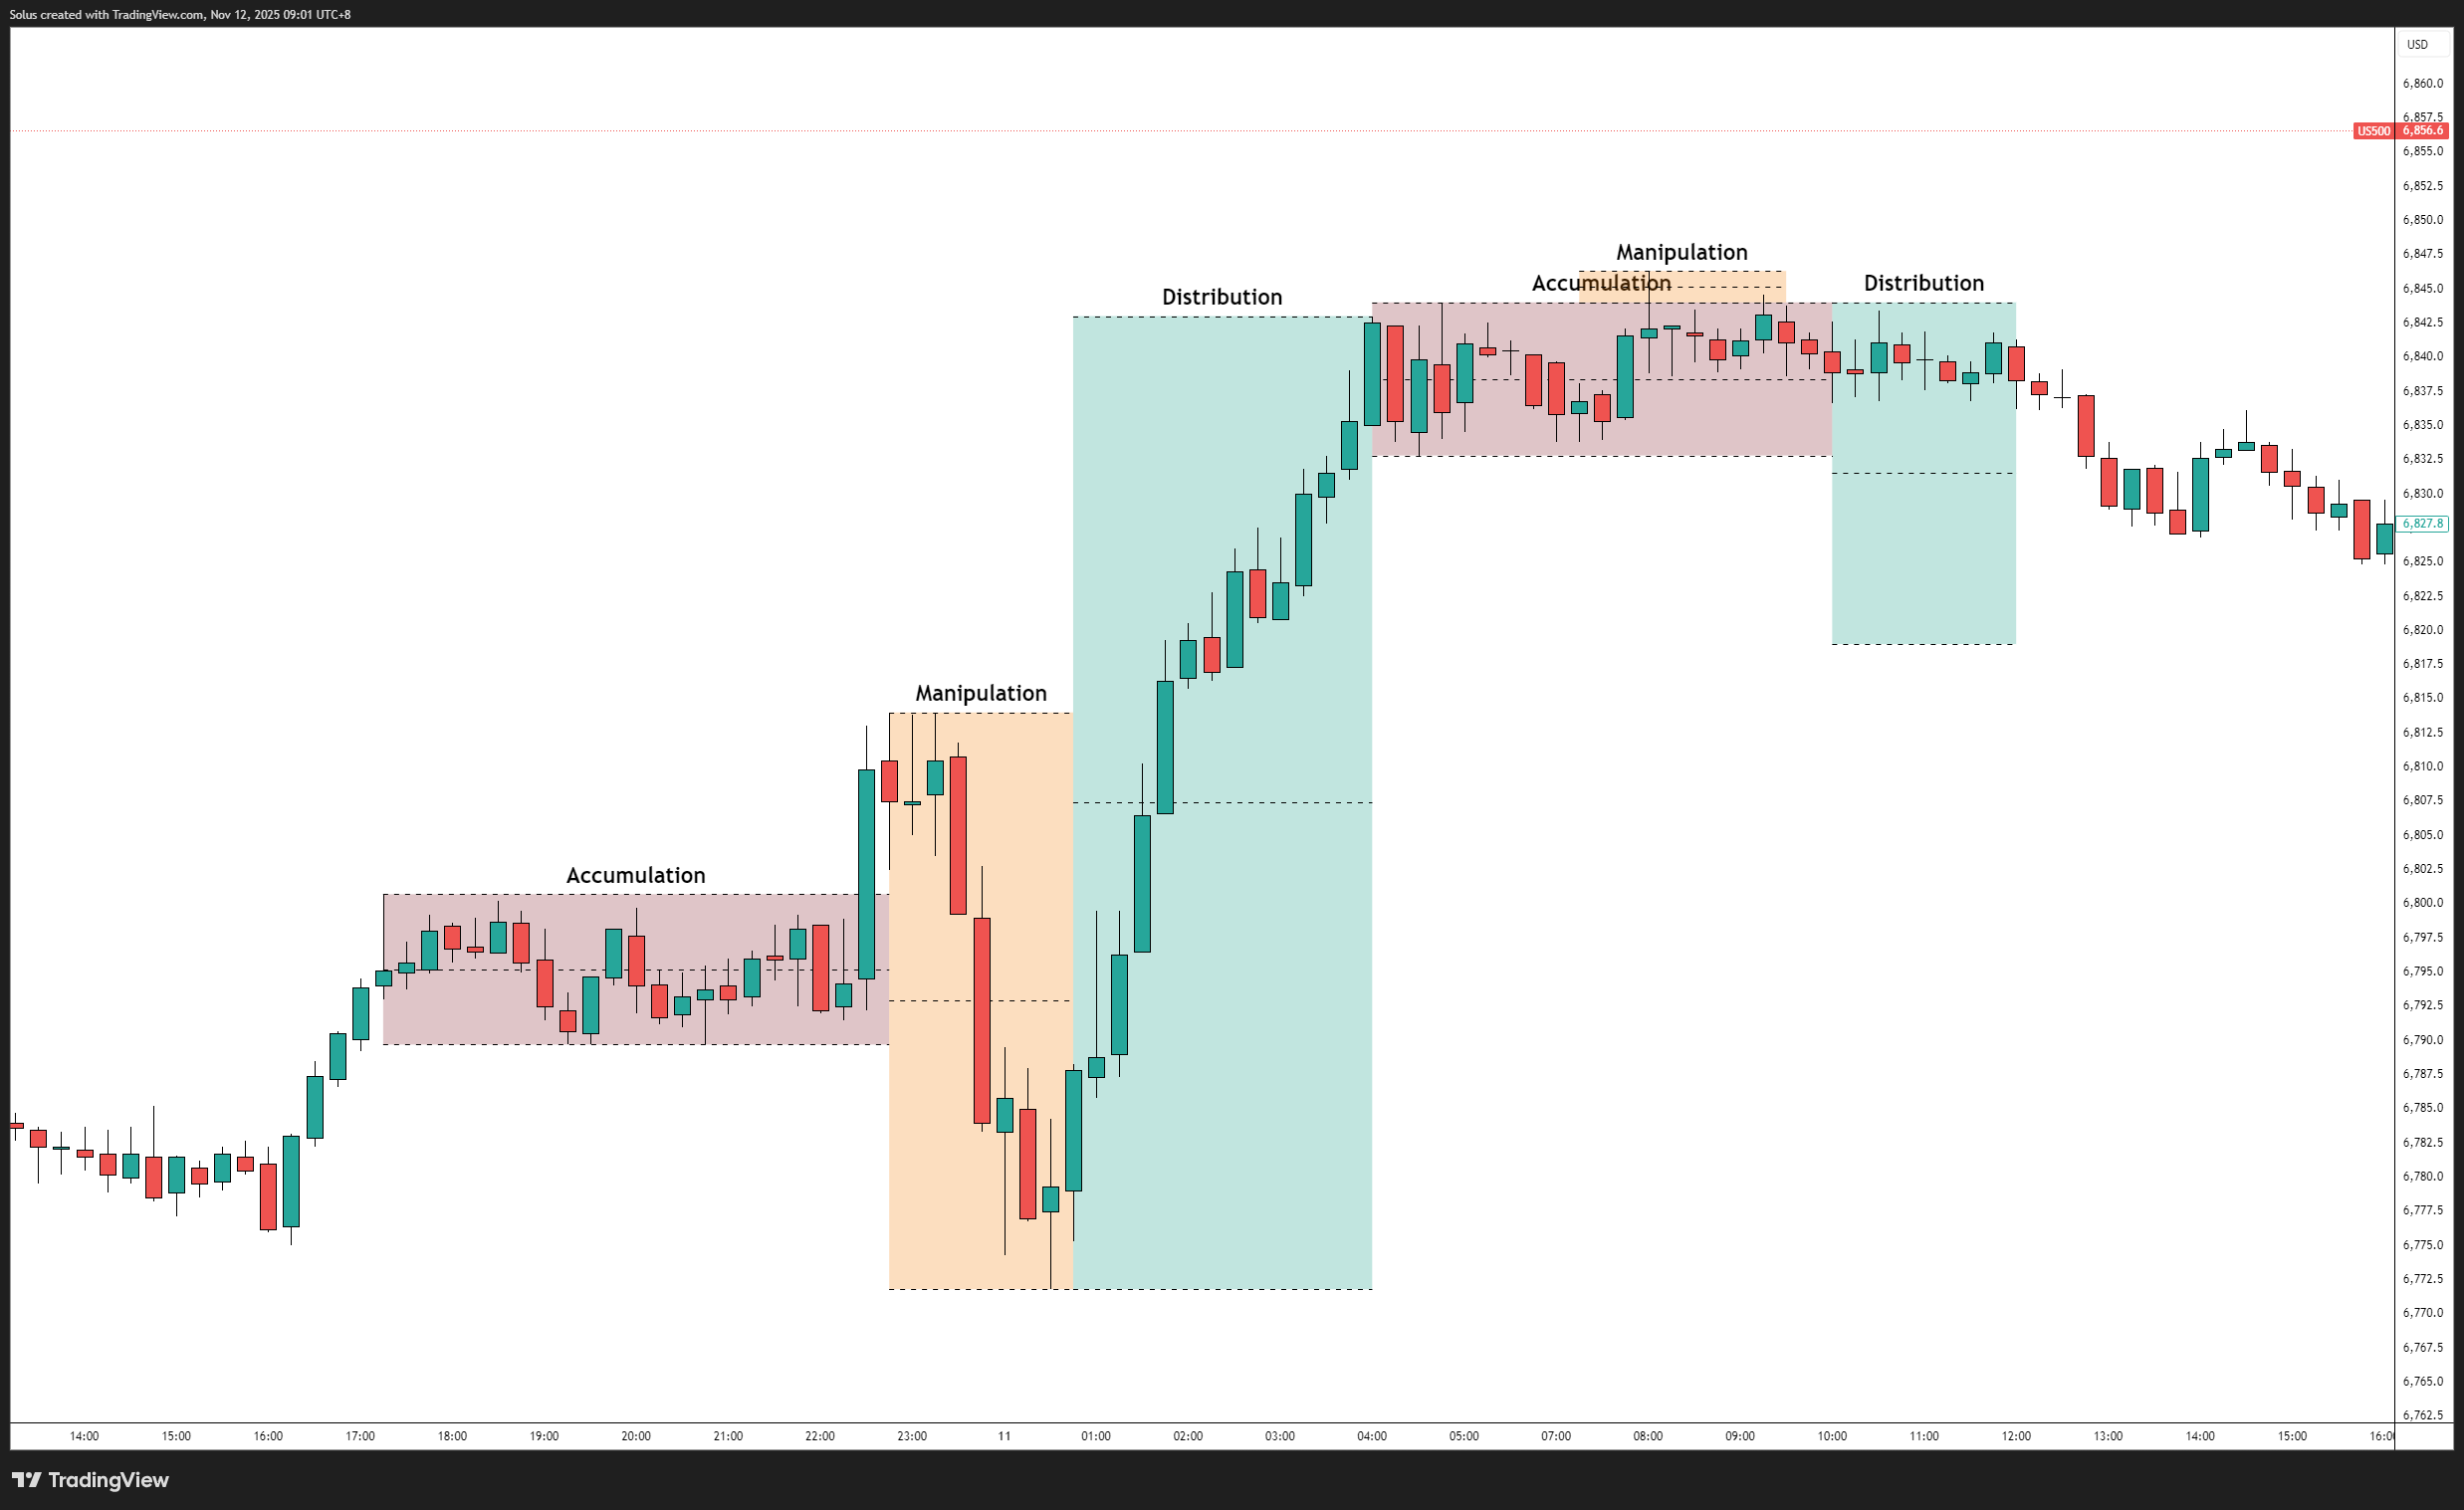
Here’s the reality: every candle can look like an order block inside accumulation.
If you start marking OBs before manipulation and displacement occur, your chart will become a jungle of boxes - each fighting for meaning. This is why most traders experience “fake” order blocks; they’re identifying them before the AMD cycle completes.
Until liquidity has been taken (manipulation) and the real move (distribution) has displaced price, those internal OBs are meaningless. They’re just byproducts of accumulation - activity without direction.
This is why patience is everything. Wait for AMD to unfold before drawing your OB. Let the story complete its chapter before reading the next one.
Not all OBs are created equal. Some carry immense institutional weight; others are fragile. Here’s what adds strength:
If these align, your OB is not just a rectangle - it’s a reflection of institutional control.
Think of AMD like a storm system. Accumulation is the quiet humidity before the thunder. Manipulation is the lightning that strikes unpredictably, shaking confidence. Distribution is the downpour - the release of energy that moves everything in one clear direction.
Order blocks are like the pressure zones where the storm began to form. Trying to identify them before the storm builds is like guessing where lightning will hit based on a few clouds. The sequence must mature first.
Order blocks are the fingerprints of smart money - but they only make sense inside the bigger story of AMD. Without understanding the buildup, trap, and release cycle, every rectangle becomes just a guess.
When you learn to map the rhythm of Accumulation, Manipulation, and Distribution, you stop seeing the market as chaos and start recognizing its pattern of intent. Combine this with structural confirmation and institutional flow, and you’ll finally trade with the market - not against it.
Once you can identify structure and order flow with confidence, it’s time to start trading live and apply these concepts on real charts.
Because AMD gives every OB its context. It tells you whether an OB represents accumulation noise or institutional intent.
Yes, but their strength varies. OBs that form after manipulation and during distribution carry the highest probability.
Because they’re drawn too early - inside accumulation - before the market reveals its true phase.
BOS confirms trend continuation during distribution, while CHoCH marks manipulation giving way to a new accumulation cycle.
It’s time to go from theory to execution!
Create an Account. Start Your Live Trading Now!
Looking for step-by-step approaches you can plug straight into the charts? Start here:
Sharpen your edge with proven tools and frameworks:
News moves markets fast. Learn how to keep pace with SMC-based playbooks:
From NASDAQ opens to DAX trends, here’s how to approach indices like a pro:
Gold remains one of the most traded assets - here’s how to approach it with confidence:
Candlesticks are the building blocks of price action. Master the most powerful ones:
Ready to go intraday? Here’s how to build consistency step by step:
Markets swing between calm and chaos. Learn to read risk-on vs risk-off like a pro:
Step inside the playbook of institutional traders with SMC concepts explained:
Forex pairs aren’t created equal - some are stable, some are volatile, others tied to commodities or sessions.
If you’ve ever been stopped out right before the market reverses - this is why:
Mindset is the deciding factor between growth and blowups. Explore these essentials:
The real edge in trading isn’t strategy - it’s how you protect your capital:
If you’re not sure where to start, follow this roadmap:
This way, you’ll grow from foundation → application → mastery, instead of jumping around randomly.
Follow me for more daily market insights!
Jasper Osita - LinkedIn - FXStreet - YouTube
This content may have been written by a third party. ACY makes no representation or warranty and assumes no liability as to the accuracy or completeness of the information provided, nor any loss arising from any investment based on a recommendation, forecast or other information supplies by any third-party. This content is information only, and does not constitute financial, investment or other advice on which you can rely.
ACY Securities is one of Australia's fastest growing multi-asset online trading providers, offering ultra-low-cost trading, rock-solid execution, technologically superior account management and premium market analysis.

Select the categories and companies you wish to follow directly to your person rss feed.
Create Custom RSS FeedSign up and join over 5,000 professional members who receive personalized news alerts, curated professional connections, and more for free!
US stocks closed higher on Wednesday, with the Nasdaq gaining 1%, the S&P 500 rising 0.6%, and the Dow advancing 0.7%, as renewed enthusiasm for AI-related stocks lifted market sentiment.
SpaceX went public in June as a rocket company. On October 20 it reported as something else entirely: an AI infrastructure business, financed by a satellite broadband network, with a launch division attached. Rockets generated 12% of third quarter revenue and lost money. The AI segment generated 52% of revenue and consumed 84% of capital expenditure. Starlink generated 85% of operating profit.
Standard Chartered has signed definitive agreements to acquire 100% of Zodia Custody UK Limited, folding its regulated digital asset custody business into Securities Services. Zodia Solutions will be set up under SC Ventures with bank investors including Northern Trust, NAB Ventures, Emirates NBD and Investcorp.
Bybit Fintech FZE has secured a Virtual Asset Service Provider licence from Dubai’s Virtual Assets Regulatory Authority for Exchange Services, covering spot trading. Bybit’s Peter Loo said the firm hopes to add derivatives, subject to regulatory approvals. Its international Dubai headquarters opened in 2022.
ATFX Connect has released its Q4 2026 Institutional Edge, examining the geopolitical, monetary policy and fiscal pressures shaping global financial markets in the final quarter of the year.
The Nasdaq 100 is trading at 29,382. After reaching a recent high of 29,957, the index reversed sharply and has been recording a series of lower highs and lower lows.
FM Summit London returns to Old Billingsgate on 24 November 2026 for its 15th edition, with a curated one-day format aimed at senior executives. LMAX Group, Plus500, oneZero and MetaQuotes are among confirmed exhibitors, with Business Connect meetings, roundtables and an opening event at The Folly on 23 November.
GCEX has launched European-style, fiat-settled options on Bitcoin and Ethereum with monthly expiries for eligible professional and institutional clients. The service runs through the GCEX OTC desk, with pricing from Tier 1 liquidity providers and reporting on XplorPortal. GC Exchange Limited is authorised by the UK FCA
Wall Street closed mostly higher on Tuesday, led by a nearly 1% gain in the Dow. In Asia, South Korea’s Kospi rebounded 2.7% and Japan’s Nikkei gained 0.8%.
Brent crude is trading at $111.70. The latest price action show the recovery continuing toward $111.70, suggesting that demand has returned after the sharp correction.