just now

Liquidity Finder Ltd is incorporated in England and Wales, company number 10610740, registered address 167-169 Great Portland Street, Fifth Floor, London W1W 5PF, United Kingdom.
Published: just now

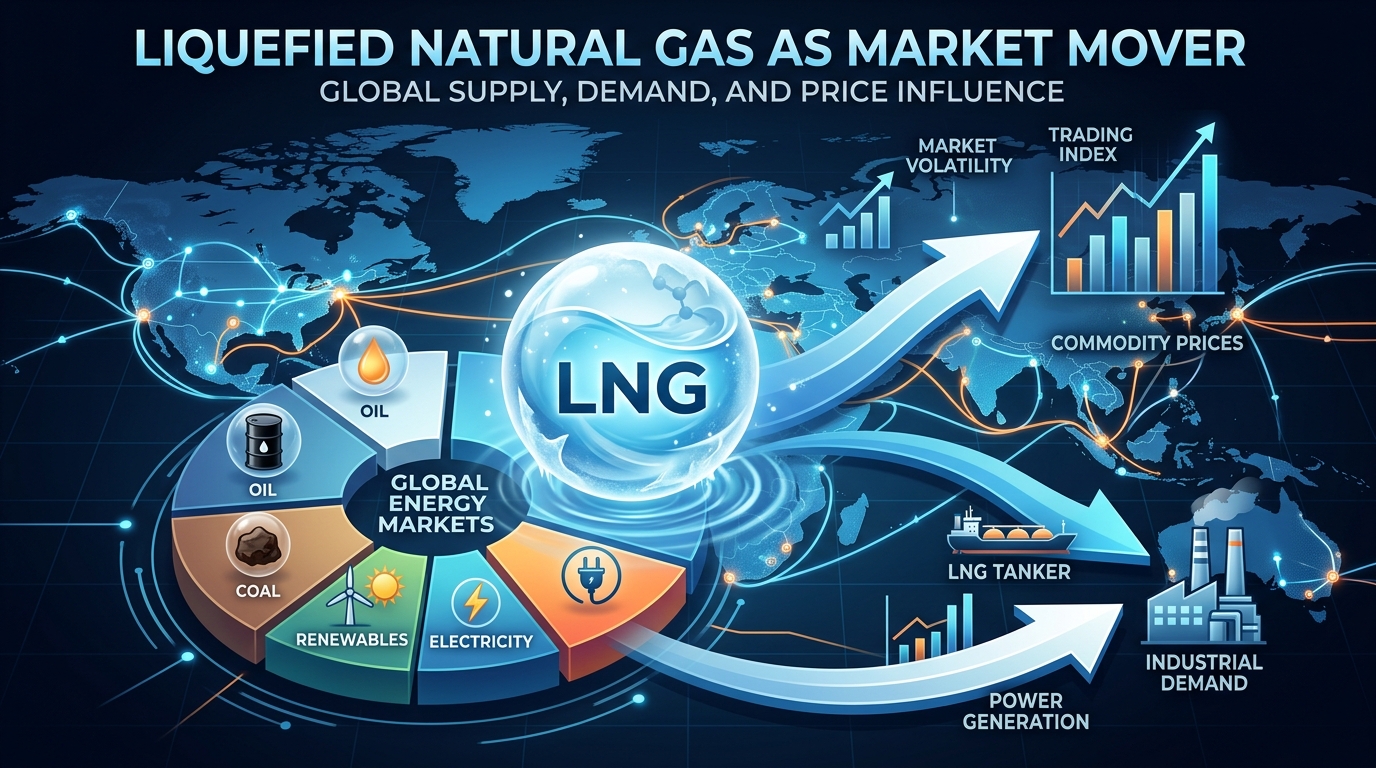
The current influence of Liquefied Natural Gas (LNG) on global equity indices is characterized by a widening spread between domestic production costs and international demand. This dynamic is reshaping market sentiment across several sectors:
The Global Arbitrage Play
The main driver is the price gap between the U.S. Henry Hub and international benchmarks like the Dutch TTF and JKM.
The Main Market Driver Explained
What is Henry Hub price gap?
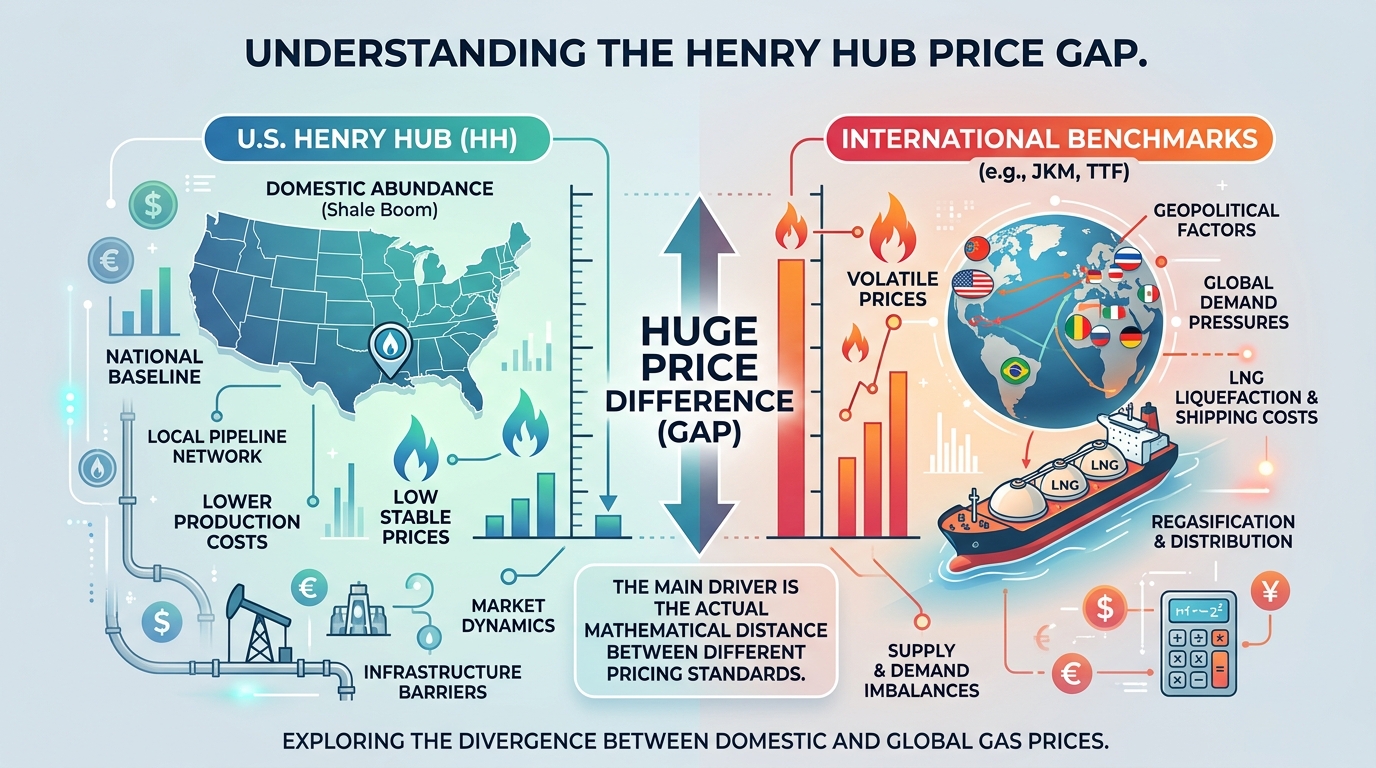
The main driver is the actual mathematical distance between different pricing standards. On one side, we have the U.S. Henry Hub setting the national baseline. On the other hand, international benchmarks sit at completely different price levels. The difference is huge.
How do the Dutch TTF and JKM fit in?
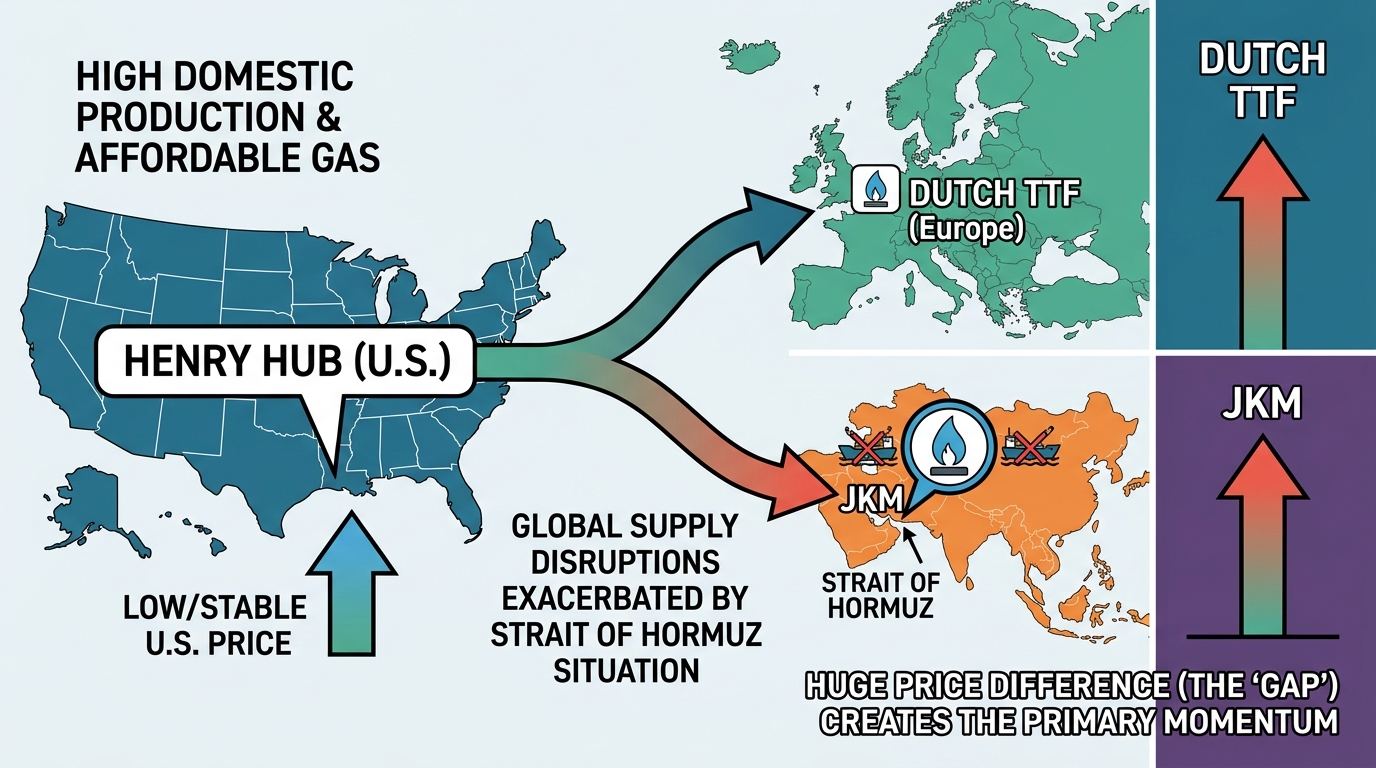
To properly understand the full picture, you must first look at the specific international benchmarks involved. The Dutch TTF acts as one of these major global standards. At the same time, the JKM serves as another critical international marker. They reveal the gap. This exact distance between the domestic and international benchmarks is the ultimate driver
When you compare the U.S. Henry Hub to both the Dutch TTF and JKM, the story becomes perfectly obvious. The huge price difference between these specific locations creates the primary momentum
Since the U.S. is sheltered by high production, domestic gas remains affordable, while global supply disruptions, intensified by the Strait of Hormuz situation, have sent international prices soaring.
Effect on Equity. By selling low-cost domestic supply into high-priced international markets, export-focused energy giants are fueling the resilience of the S&P 500 Energy index. Meanwhile, it acts as a significant headwind for the DAX and other European indices where industrial energy costs are surging.
Infrastructure Expansion as a Growth Catalyst
We are seeing the results of LNG Wave a multi-year cycle of massive capital expenditure.
Record Export Volumes: With U.S. exports reaching approximately 17.9 Bcf/d, the industrial and materials sectors are seeing sustained momentum from infrastructure build-outs.
Index Breadth: The flow of capital into liquefaction and transport infrastructure is helping the S&P 500 maintain strength even during periods of tech-sector volatility, providing a more diversified base for the index.
The Monetary Policy Tether
LNG is no longer just a commodity, it is a macro-inflationary variable that dictates the Federal Reserve’s trajectory.
What Is Sticky Inflation and How Does Export Demand Affect It?
Interest Rate Sensitivity: Why the NASDAQ 100 is Capped
The Dutch TTF or Title Transfer Facility.
As a virtual trading platform in the Netherlands, the TTF has established itself as the epicenter for European gas pricing. It is the most liquid gas trading hub in Europe. Due to its large volume and connectivity, it serves as the main price reference for the entire European continent.
Why it Matters Now?
Europe LNG Tankers: Understanding the TTF Price Shift
Ever since the big move away from Russian pipeline gas, the continent had to find a completely new way to keep the lights on. Now, they rely heavily on Europe LNG tankers to survive. This is a massive pivot. Getting this new fuel from the cold ocean is certainly not simple. To get these massive ships to change course, buyers have to pay top dollar. This creates a very intense bidding war with other global buyers who desperately want the exact same ships. Money does the talking.
Why Are Europe LNG Tankers So Important Now?
For a long time, the continent used to depend directly on pipelines for their daily energy needs. When the supply of Russian pipeline gas stopped, everything changed overnight. They quickly shifted to Liquefied Natural Gas (LNG). Pipelines were officially out.
How Does the TTF Price Affect Global Buyers?
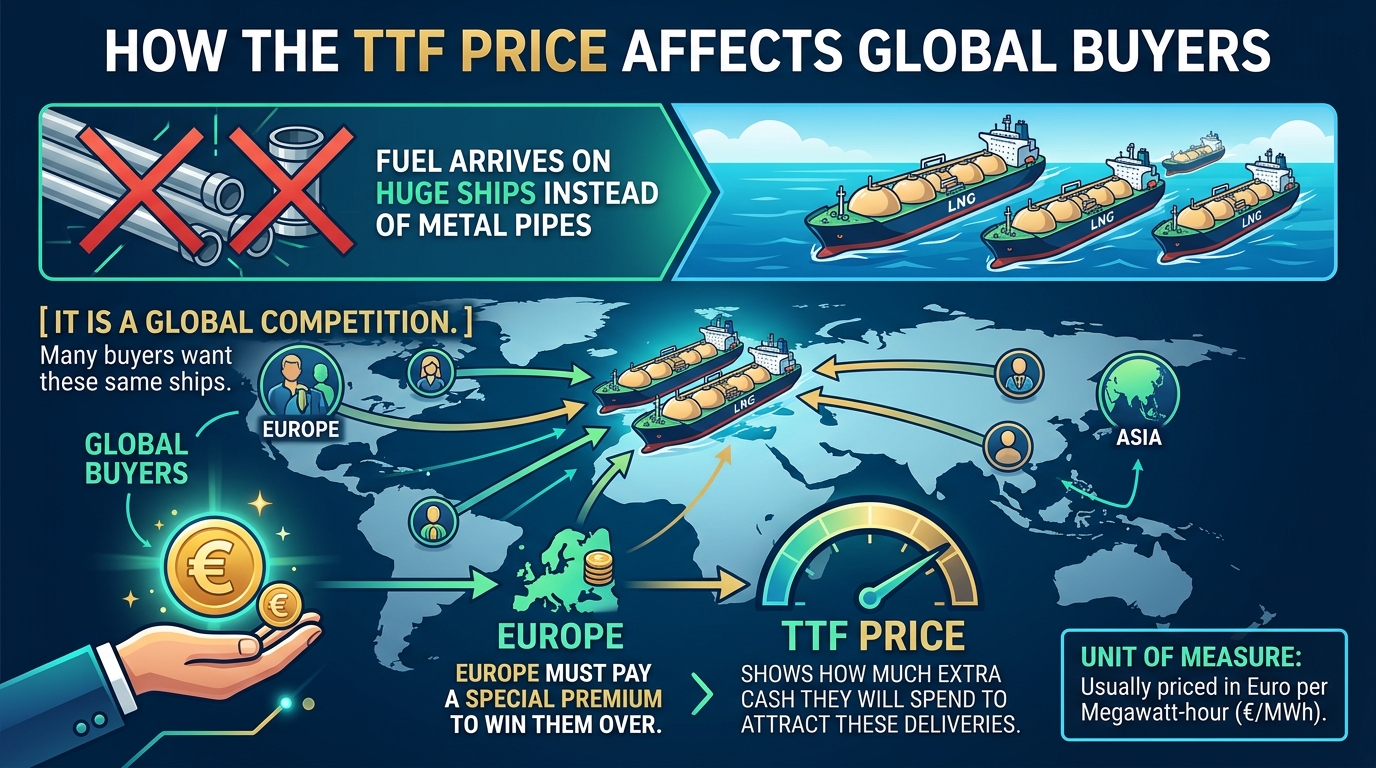
This new fuel arrives on huge ships instead of metal pipes. Because other global buyers want these same ships, Europe must pay a special premium to win them over.
The TTF price clearly shows how much extra cash they will spend to attract these deliveries. It is a global competition. This is usually priced in Euro per Megawatt-hour or €/MWh.
JKM or Japan Korea Marker
JKM Benchmark Price: Understanding Spot LNG in Northeast Asia
How energy traders price gas in the Eastern hemisphere?
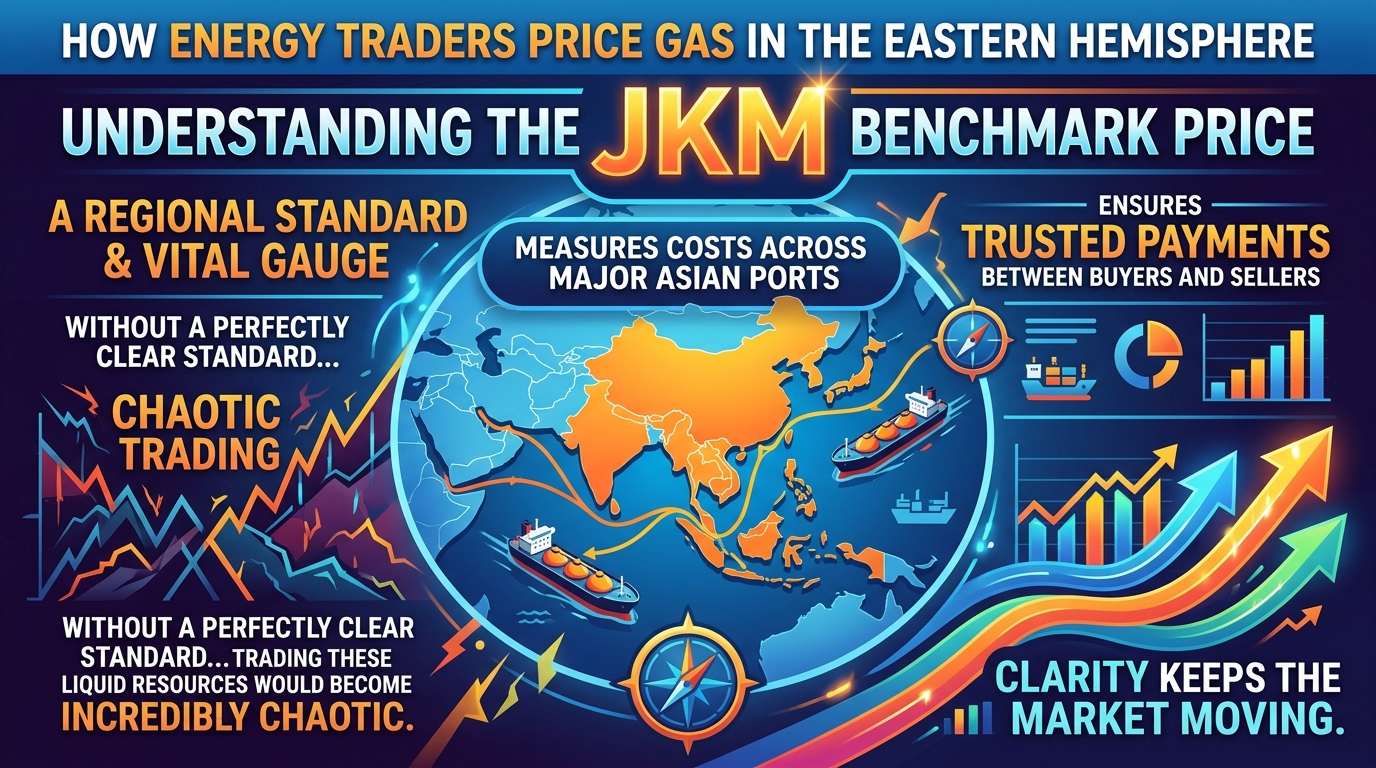
Tracking global energy markets, understanding the JKM benchmark price is absolutely essential for anyone watching international fuel flows. This marker sets the regional standard. The energy world uses this vital gauge to measure costs across major Asian ports. When heavy ships carry valuable fuel across the ocean, buyers and sellers need a trusted number to agree on fair payments. Without a perfectly clear standard, trading these liquid resources would become incredibly chaotic. Clarity keeps the market moving.
What exactly is the JKM benchmark price?
At its core, this metric serves as the defining cost standard for spot LNG cargoes arriving in Northeast Asia. Four specific areas heavily rely on these crucial incoming ship deliveries. The primary destinations tracked by this pricing tool include the massive economies of Japan, South Korea, China, and the island of Taiwan. These regions need gas.
How does this assessment differ from the TTF?
The Asian model does not work like a bustling trading floor today. Instead of providing a physical hub for direct trading, experts simply evaluate market conditions to calculate the final JKM benchmark price assessment accurate. It is strictly an evaluation.
The Assessment: Unlike the TTF, which is a physical/virtual hub where traders buy and sell, the JKM is a price assessment published by S&P Global Platts. It represents the market value of a physical cargo of LNG arriving at an Asian port.
Why it Matters Now?
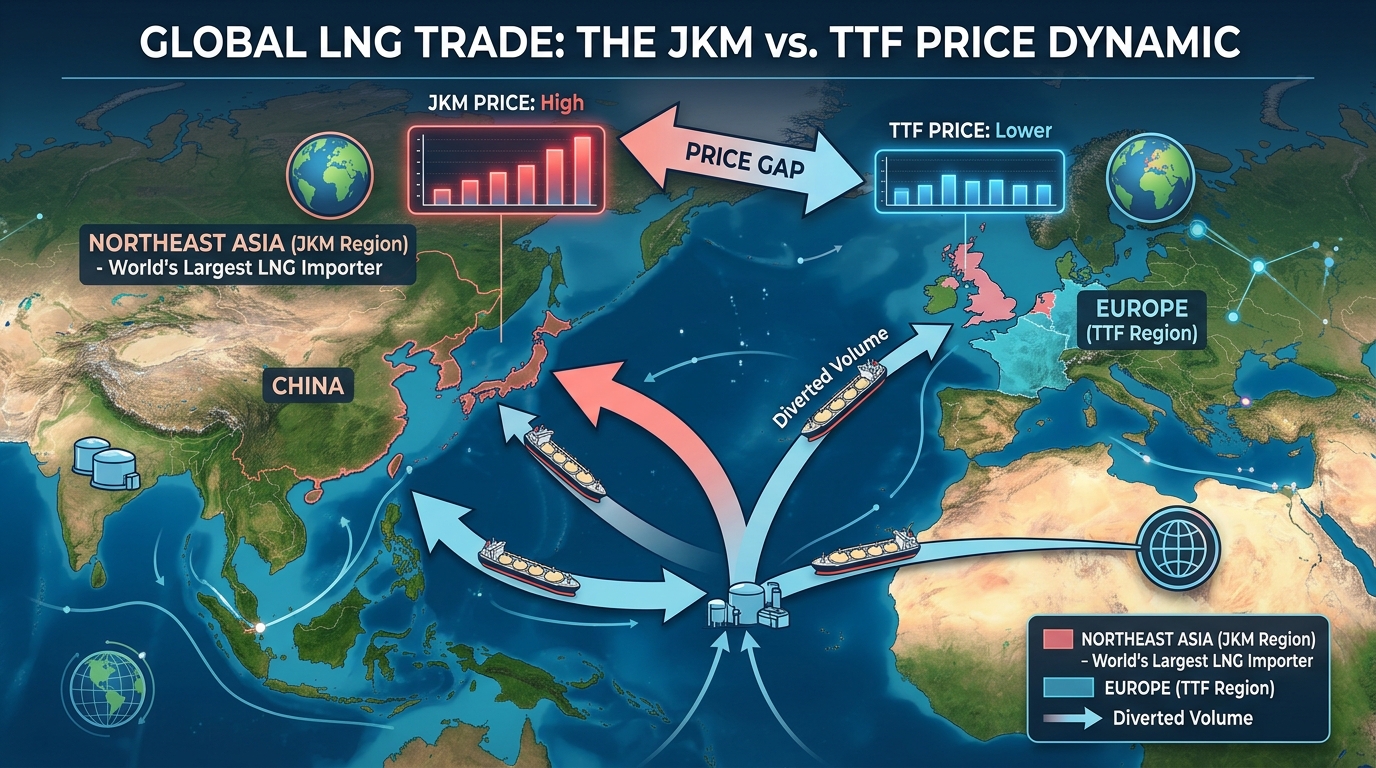
Northeast Asia is the world’s largest importing region for LNG. JKM is mostly the highest-priced benchmark across the globe and if JKM is significantly higher than TTF, tankers will shift toward Asia and vice-versa. This is usually priced in US Dollars per Million British Thermal Units or $/MMBtu.
| Index | Impact | Primary Driver |
| S&P 500 | Mixed/Positive | Energy sector strength vs. inflationary pressure on consumer discretionary. |
| NASDAQ 100 | Negative | Sticky energy inflation keeping yields high and delaying Federal Reserve pivots. |
| DAX (Germany) | Negative to Neutral | High TTF prices impacting heavy industrial and chemical manufacturing. |
| Energy Select Sector (XLE) | Positive | Record export volumes and high international spot price capture. |
The Spread. Traders watch the TTF-JKM Spread to see where the next cargo of LNG will go.
The U.S. Connection
U.S. exporters look at both prices and compare them to the Henry Hub (the U.S. benchmark). If Henry Hub is $3 but JKM is $15, the profit margin (after shipping and liquefaction costs) is massive, which is currently driving those energy indices higher.
| Feature | Dutch TTF | JKM |
| Region | Europe (Netherlands) | Northeast Asia |
| Type | Hub-based / Pipeline & LNG | Physical Spot Cargo Assessment |
| Currency | Euro (€) | US Dollar ($) |
| Influence | European industrial & heating costs | Asian manufacturing & power costs |
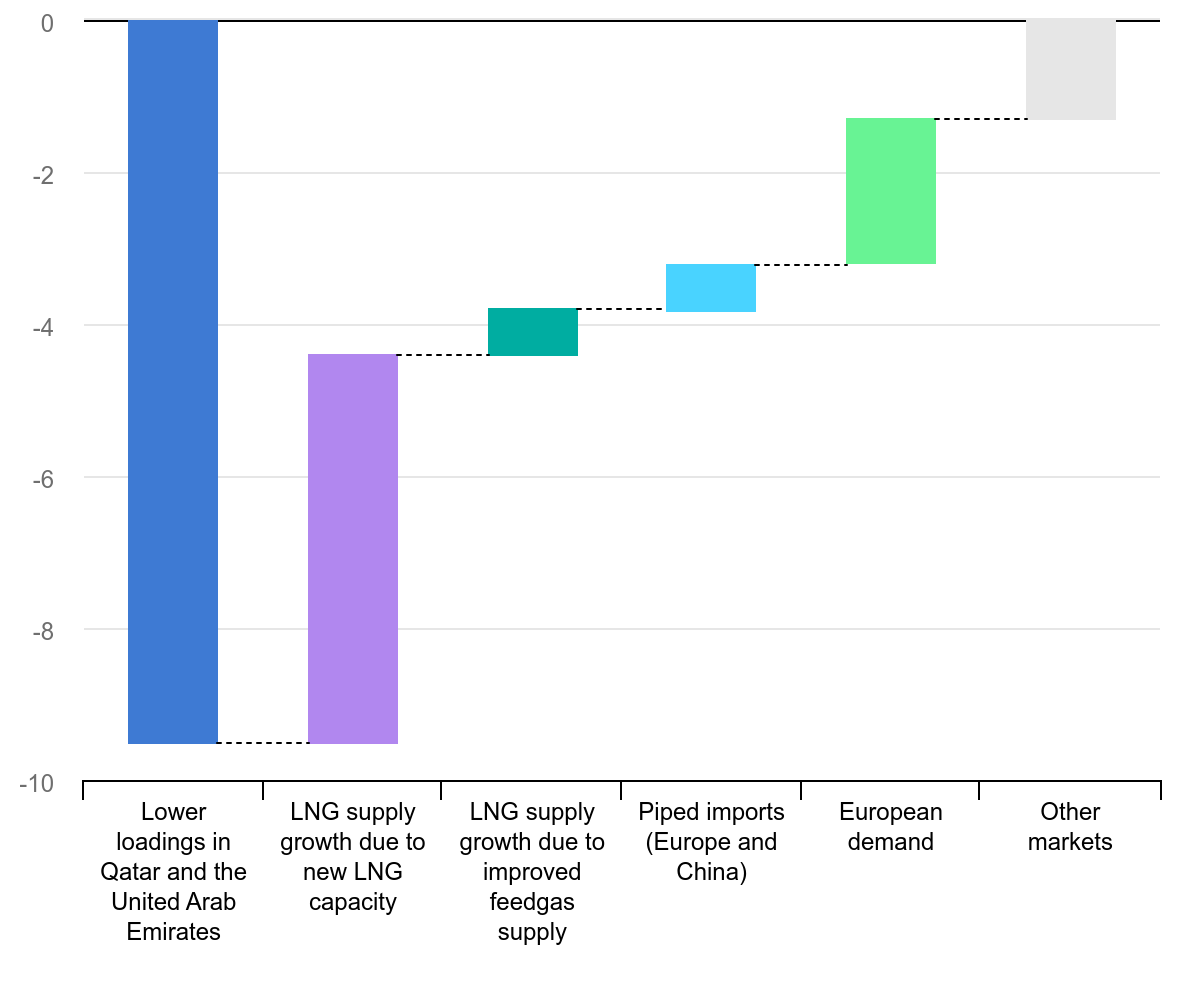
The conflict in the Middle East has triggered a massive supply shock in the global LNG market, effectively postponing the anticipated LNG wave of surplus supply by at least two years.
The Immediate Impact
Production Loss: Qatar and the UAE face a 20 bcm shortfall for March–April, with an additional 10 bcm lost during the slow ramp-up of liquefaction plants.
Transit risks as beyond physical plant damage, flows remain restricted through the Strait of Hormuz.
Qatar Infrastructure Fragility -Global Risk
Why does this fundamentally tighten the global supply equilibrium?
A loss of 70 bcm is an incredibly massive shock to the worldwide energy system. This volume drop tightens the global supply equilibrium. Fewer resources mean the entire world operates with a significantly tighter, much more fragile baseline. The global balance shifts completely.
With project delays as postponing the North Field East expansion adds another 20 bcm to the deficit.
Cumulative Loss. The conflict is projected to remove 120 bcm of LNG from the market—roughly 15% of the world’s expected supply for this period.
While new global liquefaction capacity will eventually offset these losses, the supply crunch will be most severe through 2026–2027. The market easing investors were expecting has been pushed back to at least 2028, keeping global prices higher for longer.
The closure of the Strait of Hormuz has severely disrupted global gas markets, though the shock is being partially cushioned by a rise in non-Qatari supply from projects planned years ago.
The Current Situation
Supply Buffer. While Qatari exports are restricted, new liquefaction plants in other regions are coming online to mitigate the losses.
What Is a Volatility Hedge? Protecting Price Swings
Surviving a sudden crisis requires a reliable volatility hedge. When extreme price swings hit the market suddenly, unprepared businesses often face devastating financial trouble that they simply cannot recover from easily. You must be ready.
The recent crisis proves that market safety does not happen by accident. In fact, buyers and sellers only stay protected when they agree to smart, structured deals. It saves the day.
How Do Long-Term Contracts Stop Extreme Price Swings?
To stop massive pricing jumps, you must use sophisticated pricing models. Simple agreements just cannot handle the heavy shocks of a real crisis. By building advanced pricing into your diversified deals, you ensure that neither the buyer nor the seller takes a fatal financial hit. Both sides win together.
Here are the core elements needed for true protection:
Future Outlook
Preventing Energy Shortages with Value Chain Investment
The only way to stop a crisis is to fund the whole energy value chain. When we talk about the overall chain, we mean everything from gathering resources to delivering power into your home.
How Does Sustained Investment Help Gas, LNG, and Electricity?
Here is exactly where our constant funding needs to go:
Energy Security Diplomacy: Stabilizing Global Supply
The dissimilarity between cheap U.S. gas (Henry Hub) and expensive global gas (TTF and JKM) has become a major force in the 2026 stock market.
U.S. energy companies are moving in record profits by taking cheap domestic gas and selling it at sky-high global prices. This export strategy completely redefines modern natural gas investment trends. The index stands strong. U.S. energy companies are driving S&P 500 resilience by selling cheap domestic gas at high global prices.
High energy costs are severely hurting manufacturing sectors across Europe and Asia. Because overseas factories are forced to pay top dollar for imported American fuel, their operating expenses have completely exploded. This heavy burden is actively weighing down major international indices like the DAX and the Nikkei. Foreign markets are bleeding.
High interest rates are famously difficult for growth-heavy sectors to navigate. With the Federal Reserve backed into a corner, intense pressure falls directly onto tech stocks and the NASDAQ index. Companies relying on cheap borrowing are struggling to maintain their previous momentum under these tight central bank policies. Tech feels the pain.
In 2026, natural gas investment trends show this fuel is no longer just a basic utility. It has officially transformed into a primary engine that actively dictates central bank decisions and global wealth.
In the 20th century, we watched Crude Oil. In the early 21st century, we watched Central Bank balance sheets. In 2026, the most important chart for a global macro trader is the spread between Henry Hub, TTF, and JKM.
LNG isn't just a commodity anymore, it is the geopolitical currency that determines corporate margins in Europe, inflation in America, and trade balances in Asia.
Disclaimer: This content may have been written by a third party. ACY makes no representation or warranty and assumes no liability as to the accuracy or completeness of the information provided, nor any loss arising from any investment based on a recommendation, forecast or other information supplies by any third-party. This content is information only, and does not constitute financial, investment or other advice on which you can rely.
ACY Securities is one of Australia's fastest growing multi-asset online trading providers, offering ultra-low-cost trading, rock-solid execution, technologically superior account management and premium market analysis.
Select the categories and companies you wish to follow directly to your person rss feed.
Create Custom RSS Feed
just now
Sign up and join over 5,000 professional members who receive personalized news alerts, curated professional connections, and more for free!
Gold Price Action Forecast: Will XAU/USD Drop to $3930? Meta Description: Read our Gold price action forecast to see if XAU/USD will drop to $3930.
BitDelta Securities Financial Services LLC (“BitDelta Securities”) today announced that it has received full regulatory approval from the Capital Market Authority (“CMA”) of the United Arab Emirates under the Category 5 — Arrangement and Advice license framework (License No. 20200000439). The approval follows the firm's receipt of In-Principal Approval earlier this year and represents the successful conclusion of the CMA's full licensing process, including the satisfaction of capital requirements, governance appointments, and operational setup.
Crypto.com has received a $400 million strategic investment from Citadel Securities, valuing the firm at $20 billion. It marks the first institutional funding round in the company's history, aimed at accelerating its expansion into tokenised securities, derivatives and other asset classes.
WTI’s pullback into $79–82 is the first major test of the bullish Elliott Wave count, with buyers targeting a renewed break above $85.

BitDelta Securities has secured a full CMA Category 5 licence in the UAE and opened a regulated office in Business Bay, Dubai. The firm operates as an introducing broker, connecting investors with licensed international brokers across multiple asset classes, with CEO Dr. Demetrios Zamboglou commenting on the milestone.
Index volatility is asleep while single stocks fight it out underneath, credit refuses to confirm the equity rally, and a bare macro calendar hands next week to oil.
Digital assets and FX brokerage GC Exchange FZE (GCEX) has appointed Mohammed A. Mulla as a Board Member of its Dubai-based entity, part of the wider GCEX Group.
Learn what Blockchain-as-a-Service is, how it works, and why businesses are using BaaS to build blockchain applications without managing infrastructure.
CFDs vs stocks compared on leverage, ownership, costs, dividends, taxes, and risk. Learn the differences between stocks and CFDs and discover which suits your investing or trading goals.
Want to master the markets? A winning trading mindset beats a perfect strategy. Learn how emotional discipline helps you conquer fear and avoid heavy losses.