just now

Liquidity Finder Ltd is incorporated in England and Wales, company number 10610740, registered address 167-169 Great Portland Street, Fifth Floor, London W1W 5PF, United Kingdom.
Published: just now

The U.S. dollar faces a critical test as Fed cut bets collide with GDP and Core PCE data. With 83% odds of easing priced in, DXY’s fate hinges on whether resistance at 98.80 breaks or a rejection sends it back toward 97.50.
Markets remain firmly convinced that the Federal Reserve will deliver a 25bps rate cut on September 17. According to CME FedWatch, there is an 83.3% probability of easing, compared to just 16.7% odds of no change and 0% probability of a hike.
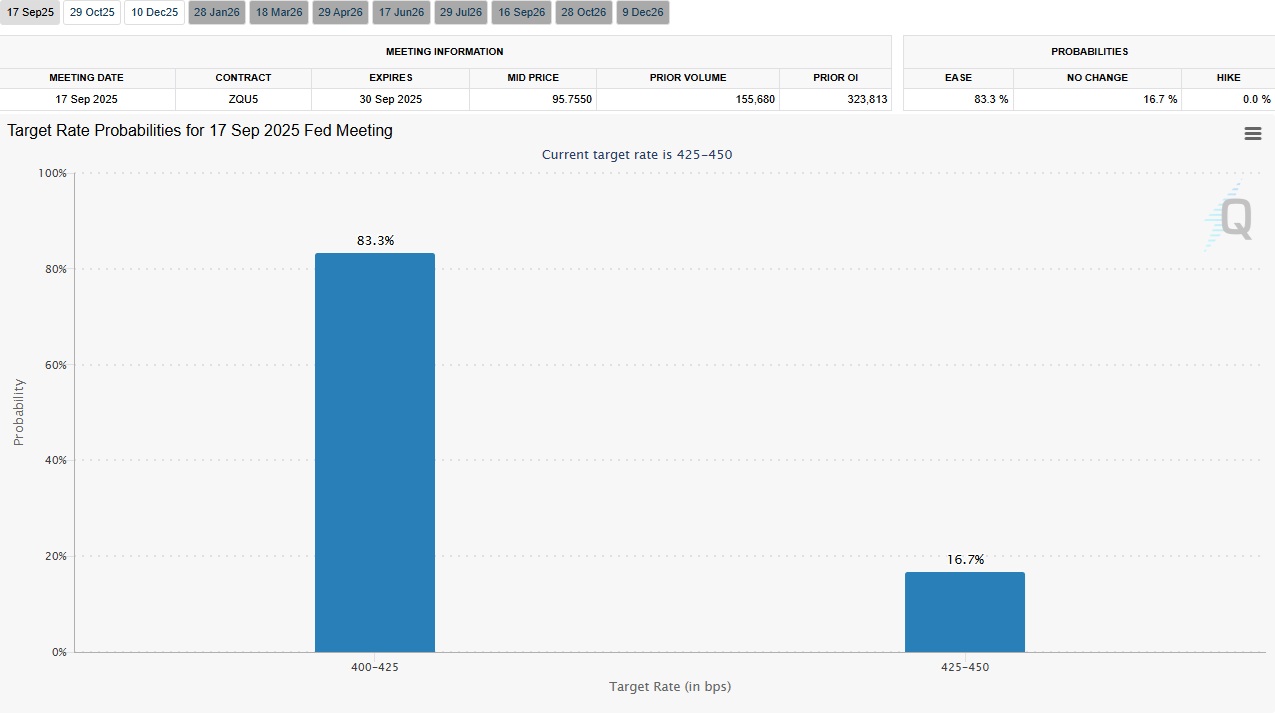
This dovish expectation has been the primary weight on the U.S. dollar, keeping investors defensive on the greenback as capital rotates toward higher-yielding emerging markets and alternative assets.
However, with such a high probability of cuts already priced in, the risk for the dollar is now skewed asymmetrically: if the Fed delivers less-dovish guidance or data surprises to the upside (jobs, GDP, PCE), the dollar could stage a sharper rebound.
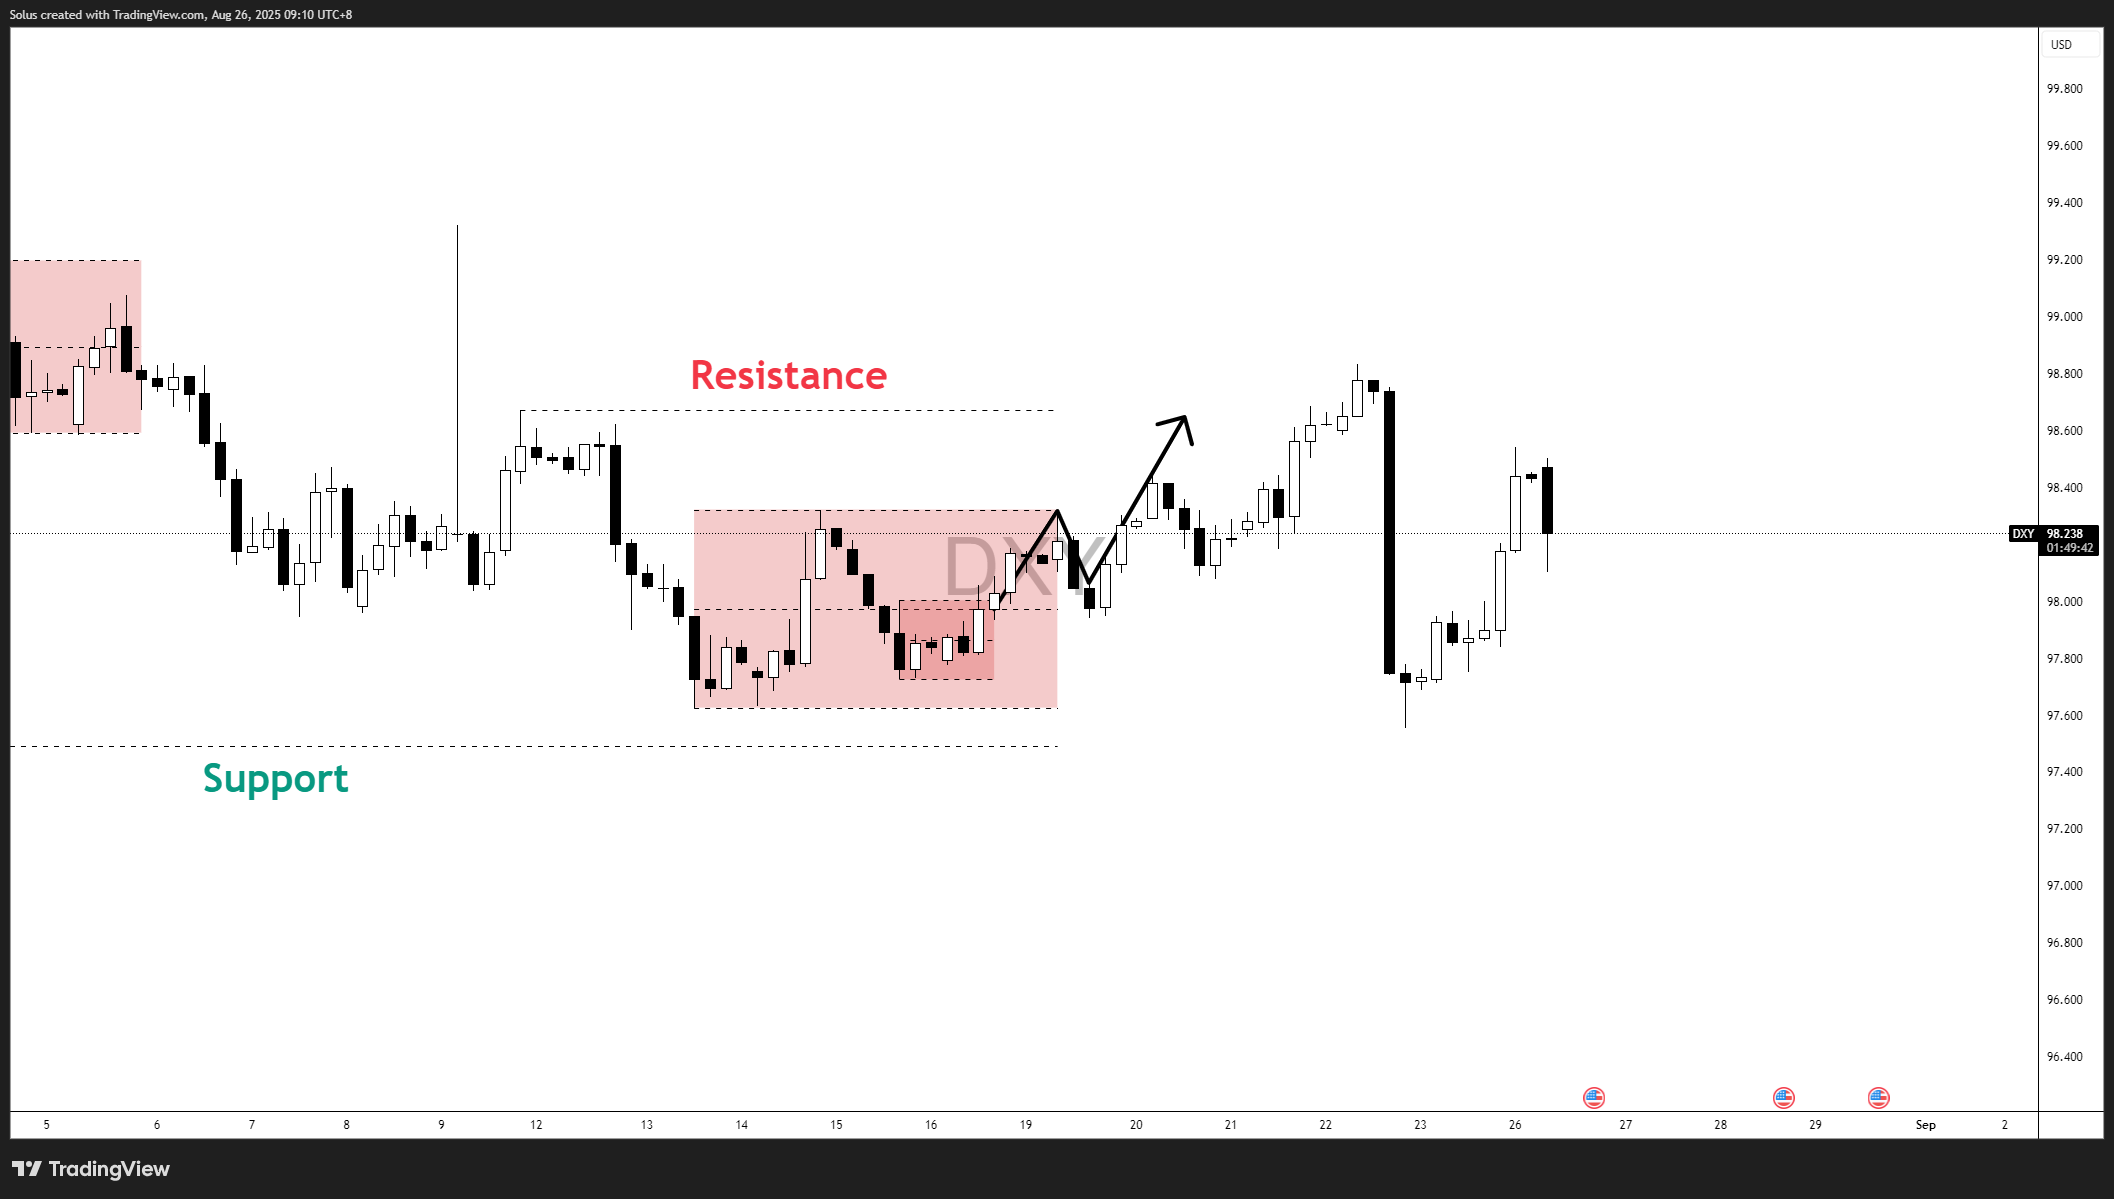
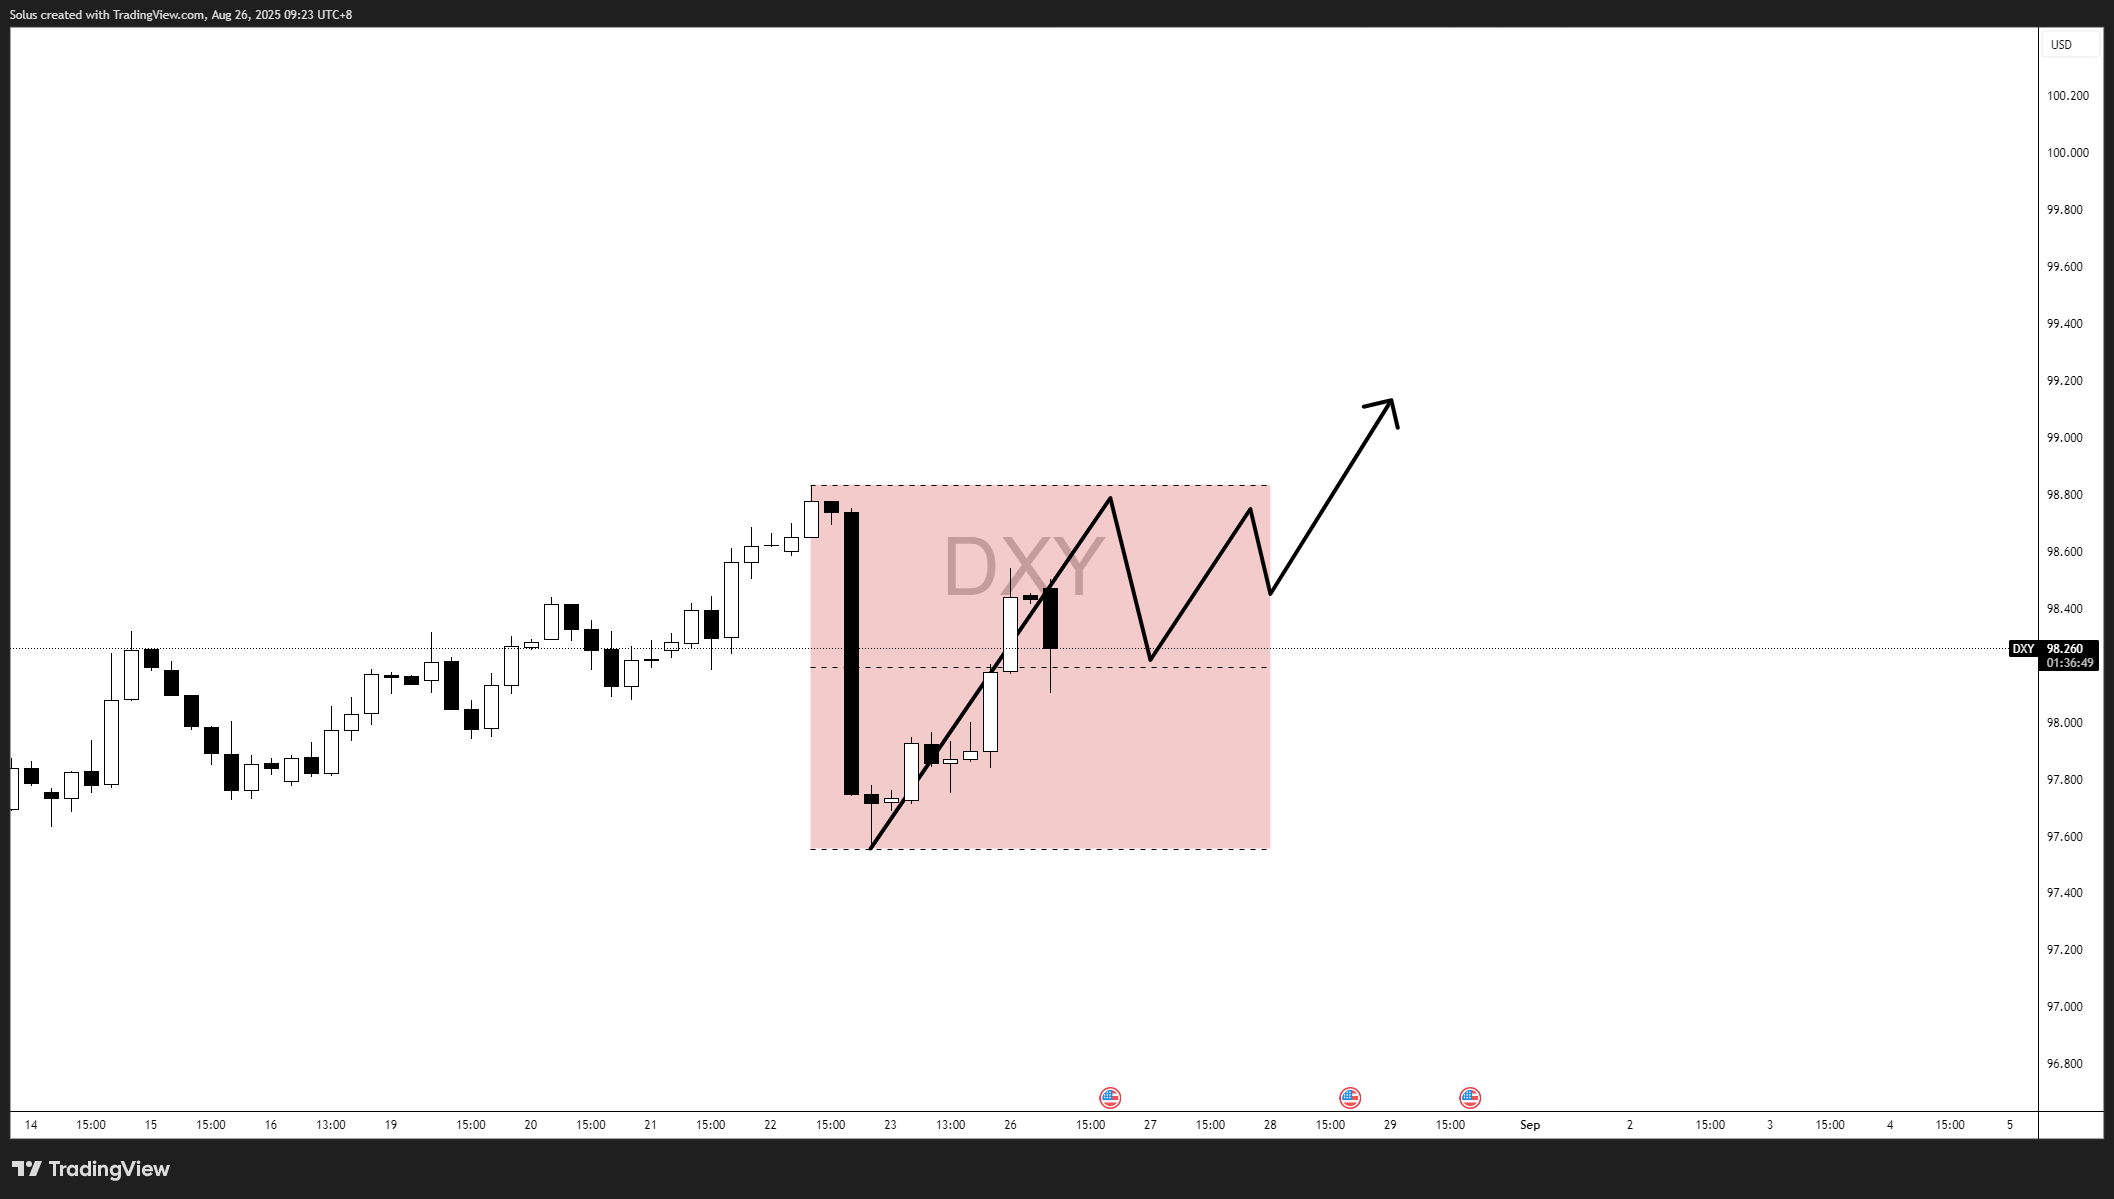
The DXY spent much of mid-August trapped in a 97.50–98.80 range, consolidating as markets digested Powell’s Jackson Hole speech.
Resistance: 98.80 is the critical ceiling. A confirmed breakout above here invites momentum toward 99.00–99.50.
Recent sessions show the dollar attempting to materialize the bullish scenario, with a breakout attempt beyond resistance supported by stronger momentum candles. This technical development contrasts the macro dovish bias, setting up a tug of war between fundamentals and price action.
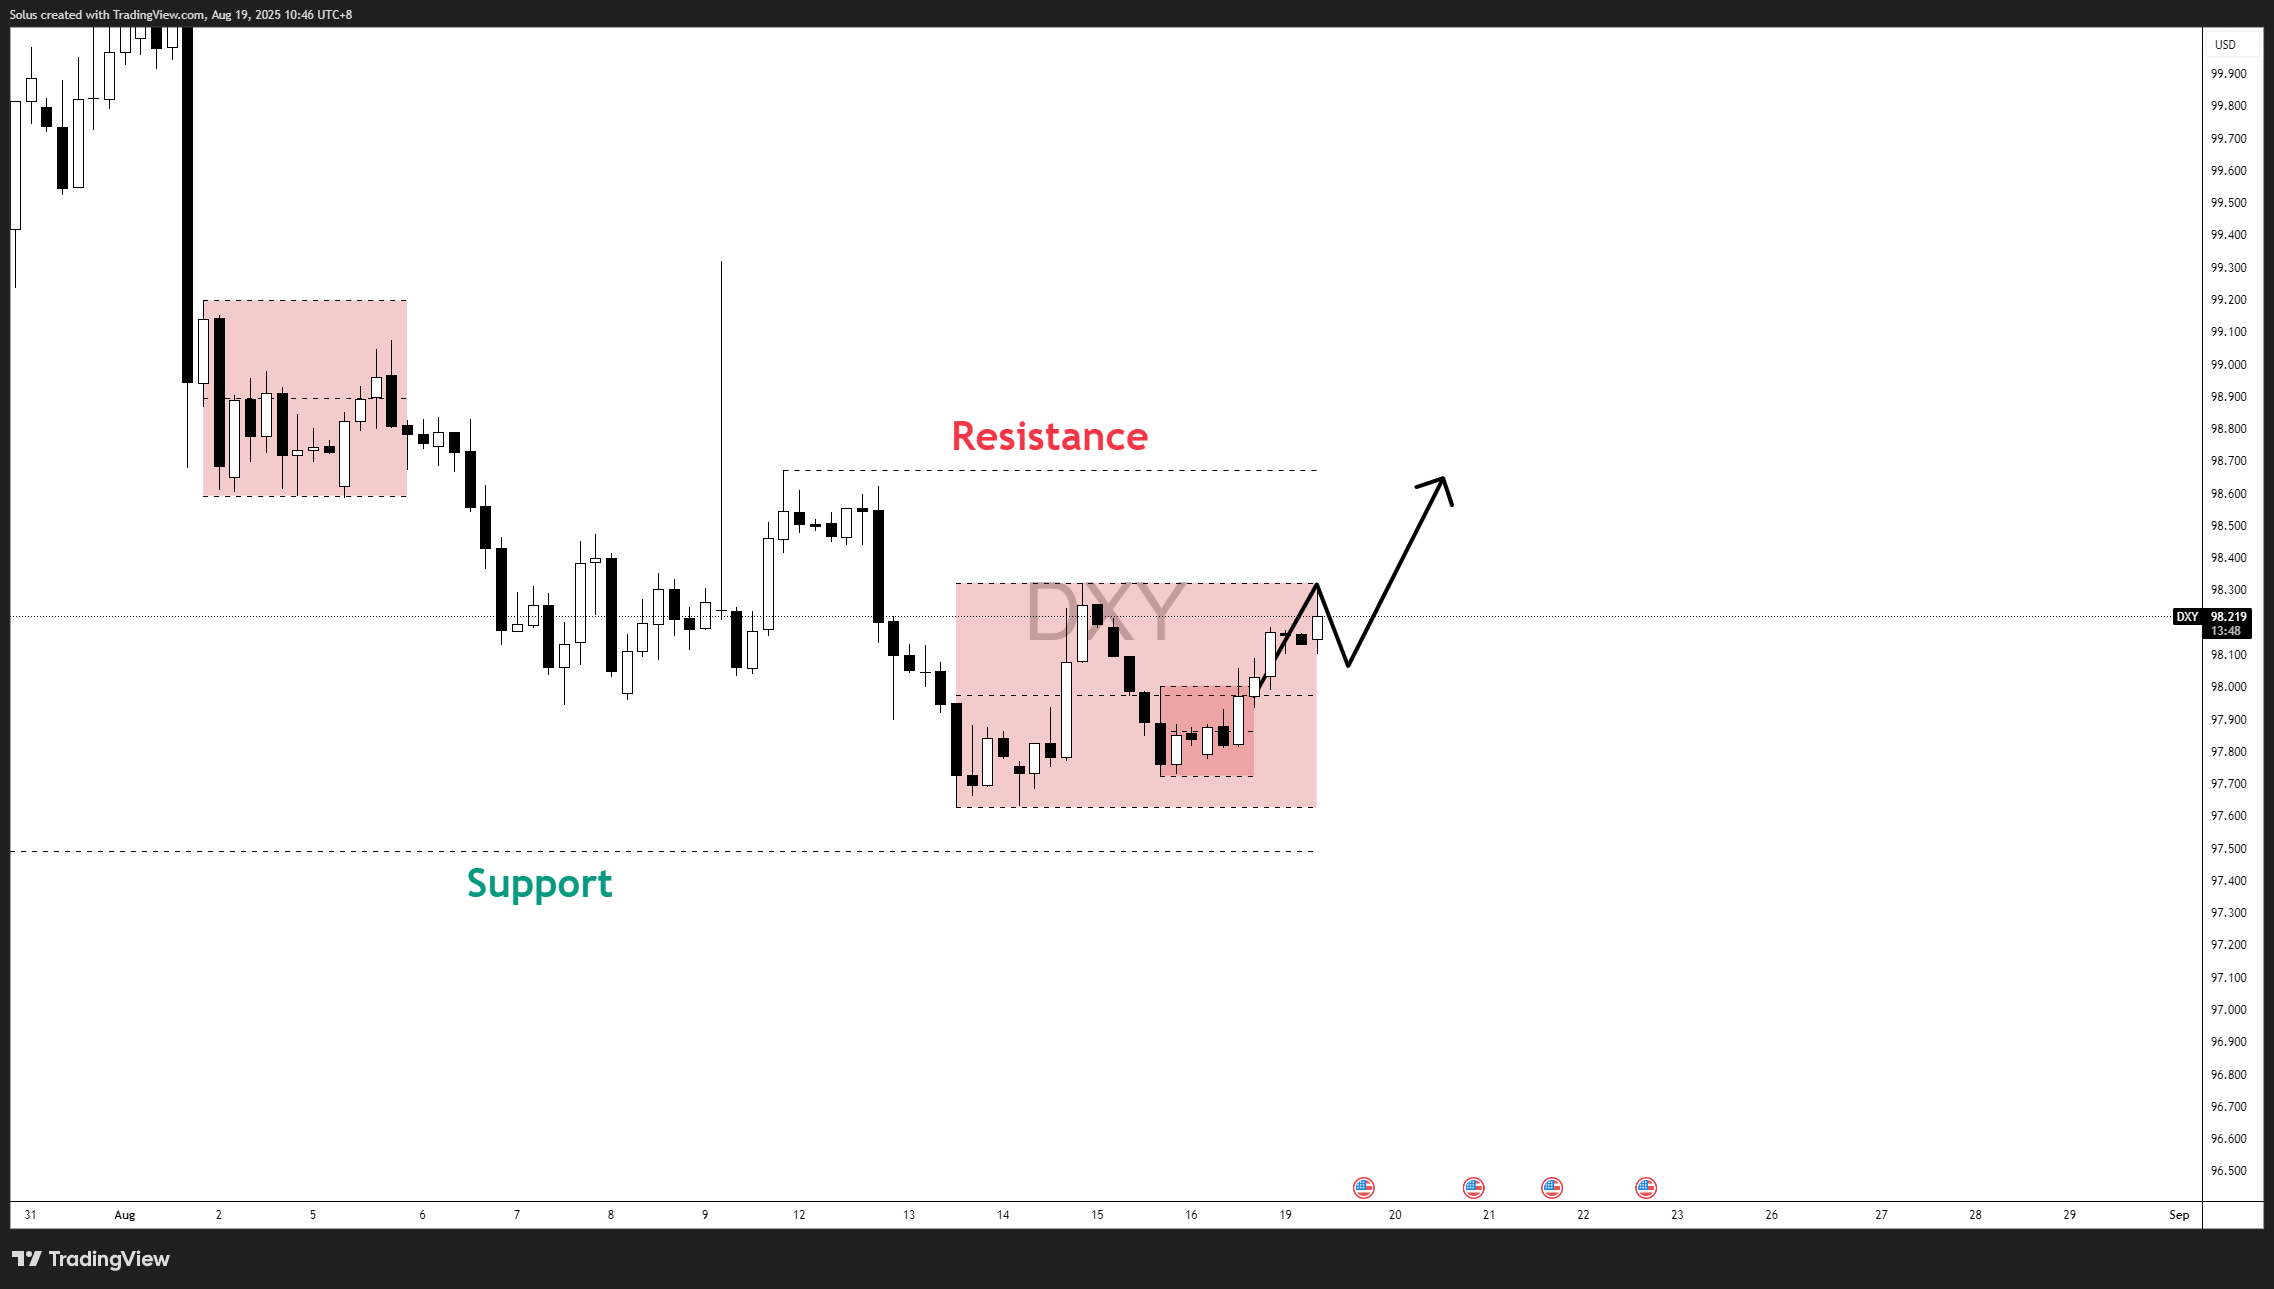
In our August 19 blog (USD Forecast: Dollar Range 97.60–98.30 with Bearish Bias), we highlighted that while the bias was tilted bearish, a bullish recovery would materialize if the DXY could defend support and reclaim resistance.
That path is now unfolding:
This scenario is particularly relevant as bearish macro positioning is crowded—creating room for sharp upside corrections if data or policy surprises counter market expectations.
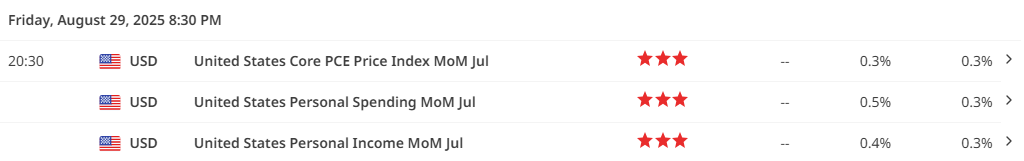
The market’s next major test comes on Friday, August 29 (20:30 PH time) with three high-impact releases:
Alongside these, Q2 GDP growth rate revisions are due, which could shift sentiment further.
Impact on USD:
This makes Friday’s data pivotal for the dollar’s next leg.
The bullish case for the U.S. dollar rests on the DXY holding above its consolidation range and breaking past 98.80 resistance with conviction. A stronger-than-expected GDP (Aug 28) and sticky Core PCE inflation (Aug 29) could be the catalysts that flip sentiment.
If growth and inflation data come in hotter, the Fed may be forced to adopt a less aggressive easing stance, sparking a repricing across futures markets. With 83% of a rate cut already priced in, even a modest shift in expectations could drive short covering and fuel a rally.
In this scenario, the dollar would not just hold its current levels but accelerate toward 99.80 and 100, confirming the bullish scenario outlined in the August 19 forecast.
Bullish Pathway:

The bearish case builds on the current dovish Fed bias and high cut probabilities. If Q2 GDP disappoints or Core PCE inflation comes in soft, markets will double down on expectations for September easing and possibly more cuts ahead.
In that event, the dollar’s recent rebound may prove a false breakout—failing to sustain above 98.80 and instead reversing back into the range. A rejection at resistance, followed by renewed selling pressure, would expose the 97.50 support zone. If this floor breaks, the DXY could slide further toward 96.25–96.55, in line with the macro dovish outlook.
This path would reinforce the view that the dollar’s upside is limited without policy support, keeping global flows tilted toward risk assets and emerging markets.
Bearish Pathway:
With GDP and Core PCE data on deck, the U.S. dollar is at an inflection point. Both bullish and bearish scenarios remain open, and the 98.50 level will be decisive in determining which path materializes.
Open a free demo account today and experience institutional-grade spreads, lightning-fast execution, and all the tools you need to grow as a trader.
It’s time to go from theory to execution - risk-free.
Create an Account. Start Your Free Demo!
How To Trade & Scalp Indices at the Open Using Smart Money Concepts (SMC)
How to Trade Breakouts Effectively in Day Trading with Smart Money Concepts
Complete Step-by-Step Guide to Day Trading Gold (XAU/USD) with Smart Money Concepts (SMC)
The Power of Multi-Timeframe Analysis in Smart Money Concepts (SMC)
Forex Trading Strategy for Beginners
Mastering Candlestick Pattern Analysis with the SMC Strategy for Day Trading
Mastering Risk Management: Stop Loss, Take Profit, and Position Sizing
How to Use Fibonacci to Set Targets & Stops (Complete Guide)
RSI Divergence Trading Strategy for Gold: How to Identify and Trade Trend Reversals
Stochastics Trading Secrets: How to Time Entries in Trending Markets using Stochastics
Gold Trading Stochastics Strategy: How to Trade Gold with 2R–3R Targets
RSI Hidden Divergence Explained: How to Spot Trend Continuations Like a Pro
The Ultimate Guide to Risk Management in Trading - A Complete Compilation for 2025
Moving Averages Trading Strategy Playbook
How to Think Like a Price Action Trader
Mastering Fibonacci Trading Psychology - Trusting the Levels, Managing the Mind
Why Smart Money Concepts Work in News-Driven Markets - CPI, NFP, and More
How to Trade NFP Using Smart Money Concepts (SMC)-A Proven Strategy for Forex Traders
How to Trade CPI Like Smart Money - A Step-by-Step Guide Using SMC
How to Start Trading Indices and Get into the Stock Market with Low Capital (2025 Guide)
Best Indices to Trade for Day Traders | NASDAQ, S&P 500, DAX + Best Times to Trade Them
How To Trade & Scalp Indices at the Open Using Smart Money Concepts (SMC)
NAS100 - How to Trade the Nasdaq Like a Pro (Smart Money Edition)
How to Trade CPI Like Smart Money - A Step-by-Step Guide Using SMC
Why Smart Money Concepts Work in News-Driven Markets - CPI, NFP, and More
How to Swing Trade Gold (XAU/USD) Using Smart Money Concepts: A Simple Guide for Traders
Complete Step-by-Step Guide to Day Trading Gold (XAU/USD) with Smart Money Concepts (SMC)
The Ultimate Guide to Backtesting and Trading Gold (XAU/USD) Using Smart Money Concepts (SMC)
Why Gold Remains the Ultimate Security in a Shifting World
How to Trade Candlestick Patterns with High Probability: A Complete Guide for Beginners
The Top Japanese Candlestick Guide: What is an Engulfing Pattern and How to Trade It?
Piercing Pattern Candlestick Explained: How to Trade It - Step-By-Step Guide
Morning & Evening Star Candlestick Patterns - How to Trade Market Reversals with Confidence
5 Steps to Start Day Trading: A Strategic Guide for Beginners
8 Steps How to Start Forex Day Trading in 2025: A Beginner’s Step-by-Step Guide
3 Steps to Build a Trading Routine for Consistency and Discipline - Day Trading Edition
The Ultimate Guide to Understanding Market Trends and Price Action
Trading with Momentum: The Best Trading Session to Trade Forex, Gold and Indices
How to Identify Risk-On and Risk-Off Market Sentiment: A Complete Trader’s Guide
How to Trade Risk-On and Risk-Off Sentiment - With Technical Confirmation
The Ultimate Guide to Understanding Market Trends and Price Action
Why Smart Money Concepts Work: The Truth Behind Liquidity and Price Action
Mastering the Market with Smart Money Concepts: 5 Strategic Approaches
Mastering Candlestick Pattern Analysis with the SMC Strategy for Day Trading
Understanding Liquidity Sweep: How Smart Money Trades Liquidity Zones in Forex, Gold, US Indices
The SMC Playbook Series Part 4: How to Confirm Trend Reversal & Direction using SMC
The SMC Playbook Series Part 5: The Power of Multi-Timeframe Analysis in Smart Money Concepts (SMC)
Fair Value Gaps Explained: How Smart Money Leaves Footprints in the Market
The Best Time to Use Smart Money Concepts (SMC): Why Timing Is Everything in Trading SMC
How to Trade the London Session Using Smart Money Concepts (SMC)
The Mental Game of Execution - Debunking the Common Trading Psychology
5 Steps to Backtest a Trading Strategy with AI: A Step-by-Step Guide
Managing Trading Losses: Why You Can Be Wrong and Still Win Big in Trading
The Hidden Threat in Trading: How Performance Anxiety Sabotages Your Edge
Why You Fail in Trading: You Don’t Have Enough Capital to Survive
Why 90% of Retail Traders Fail Even with Profitable Trading Strategies
The Top 10 Best Trading Books That Changed My Mindset, Strategy & Performance
Discovering Your Trader Profile: What Kind of Trader Are You?
Follow me for more daily market insights!
Jasper Osita - LinkedIn - FXStreet - YouTube
This content may have been written by a third party. ACY makes no representation or warranty and assumes no liability as to the accuracy or completeness of the information provided, nor any loss arising from any investment based on a recommendation, forecast or other information supplies by any third-party. This content is information only, and does not constitute financial, investment or other advice on which you can rely.
ACY Securities is one of Australia's fastest growing multi-asset online trading providers, offering ultra-low-cost trading, rock-solid execution, technologically superior account management and premium market analysis.
Select the categories and companies you wish to follow directly to your person rss feed.
Create Custom RSS FeedSign up and join over 5,000 professional members who receive personalized news alerts, curated professional connections, and more for free!
Index volatility is asleep while single stocks fight it out underneath, credit refuses to confirm the equity rally, and a bare macro calendar hands next week to oil.
Digital assets and FX brokerage GC Exchange FZE (GCEX) has appointed Mohammed A. Mulla as a Board Member of its Dubai-based entity, part of the wider GCEX Group.
Learn what Blockchain-as-a-Service is, how it works, and why businesses are using BaaS to build blockchain applications without managing infrastructure.
CFDs vs stocks compared on leverage, ownership, costs, dividends, taxes, and risk. Learn the differences between stocks and CFDs and discover which suits your investing or trading goals.
Want to master the markets? A winning trading mindset beats a perfect strategy. Learn how emotional discipline helps you conquer fear and avoid heavy losses.
Read our latest Gold price action forecast to see how a double top pattern triggered a massive XAU/USD selloff.
Wondering how the API weekly report impacts oil prices? Learn how U.S. crude stockpiles and voluntary surveys predict the official EIA report.
cTrader Mobile 5.9 introduces a dedicated charts tab, single-tap chart access, a draggable floating action panel and a new focus mode for positions and orders, following the platform's Best Mobile Trading App win at UF Awards Global 2026. Sergey Borisov of Spotware comments on the update.
BitPay B.V., the European arm of BitPay, has been authorised as a crypto-asset service provider under MiCA by the Dutch AFM, allowing it to offer regulated crypto and stablecoin payment services, cross-border payments, and consumer spending tools across the EU.
Spotex has appointed Joe Tuccio, previously Head of Digital Partnerships at Seabury Capital, as Head of Digital Assets. Tuccio brings 20 years of financial markets experience and will lead partnerships with liquidity providers and custodians as Spotex expands its institutional FX venue into digital assets.