
Explore Companies BySectors & Categories
Explore Companies ByUse Cases
Explore Companies ByProducts & Services
Explore Companies ByRankings & Reviews
Featured NewsCompaniesMarketsCryptoTechRegulatoryCommentaryUKUSWorldMore

    Latest Wires

      Daily Newsletter

      LF Daily News

      Daily industry focused newsletter giving you an overview for the financial & finTech industry.

      See All Newsletters
      By clicking "Sign Up" you are agreeing to our Terms of Service and Privacy Policy

      How Do U.S. Weekly Jobless Claims Impact Financial Markets and Trading Strategies?

      Published: just now

      How Do U.S. Weekly Jobless Claims Impact Financial Markets and Trading Strategies?

      What Is the Trader's Guide to Trading U.S. Weekly Jobless Claims and Labor Data?


      US Weekly Jobless Claims: The Ultimate Trader’s Guide to Labor Market Data


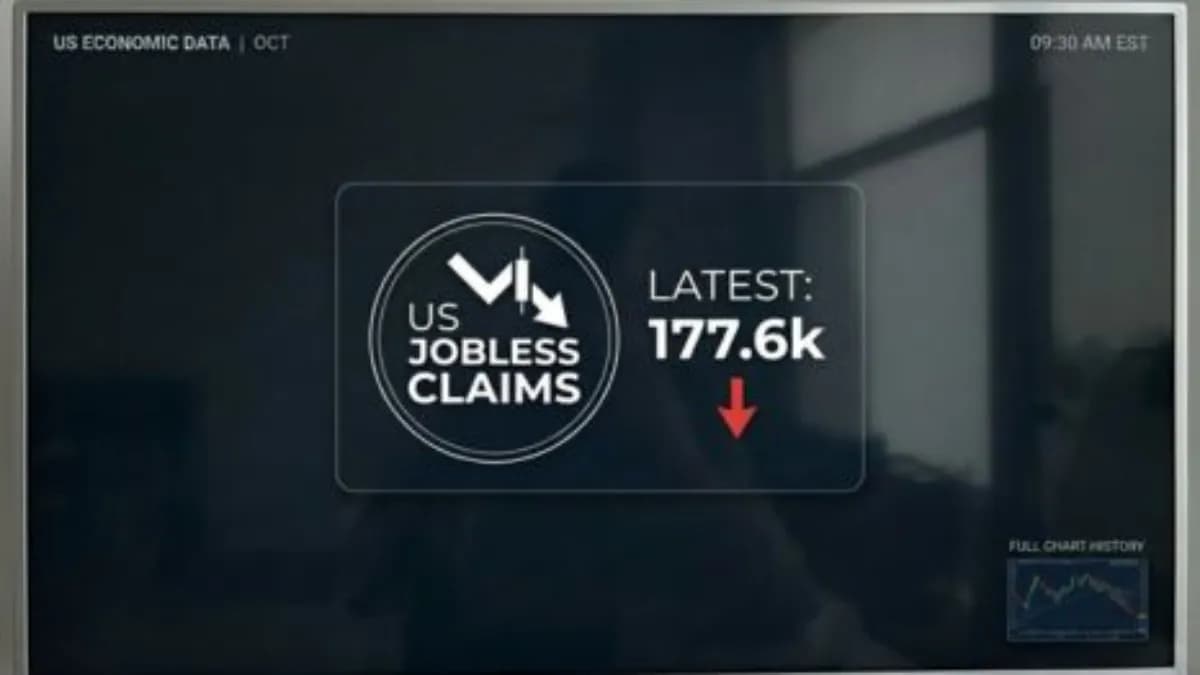
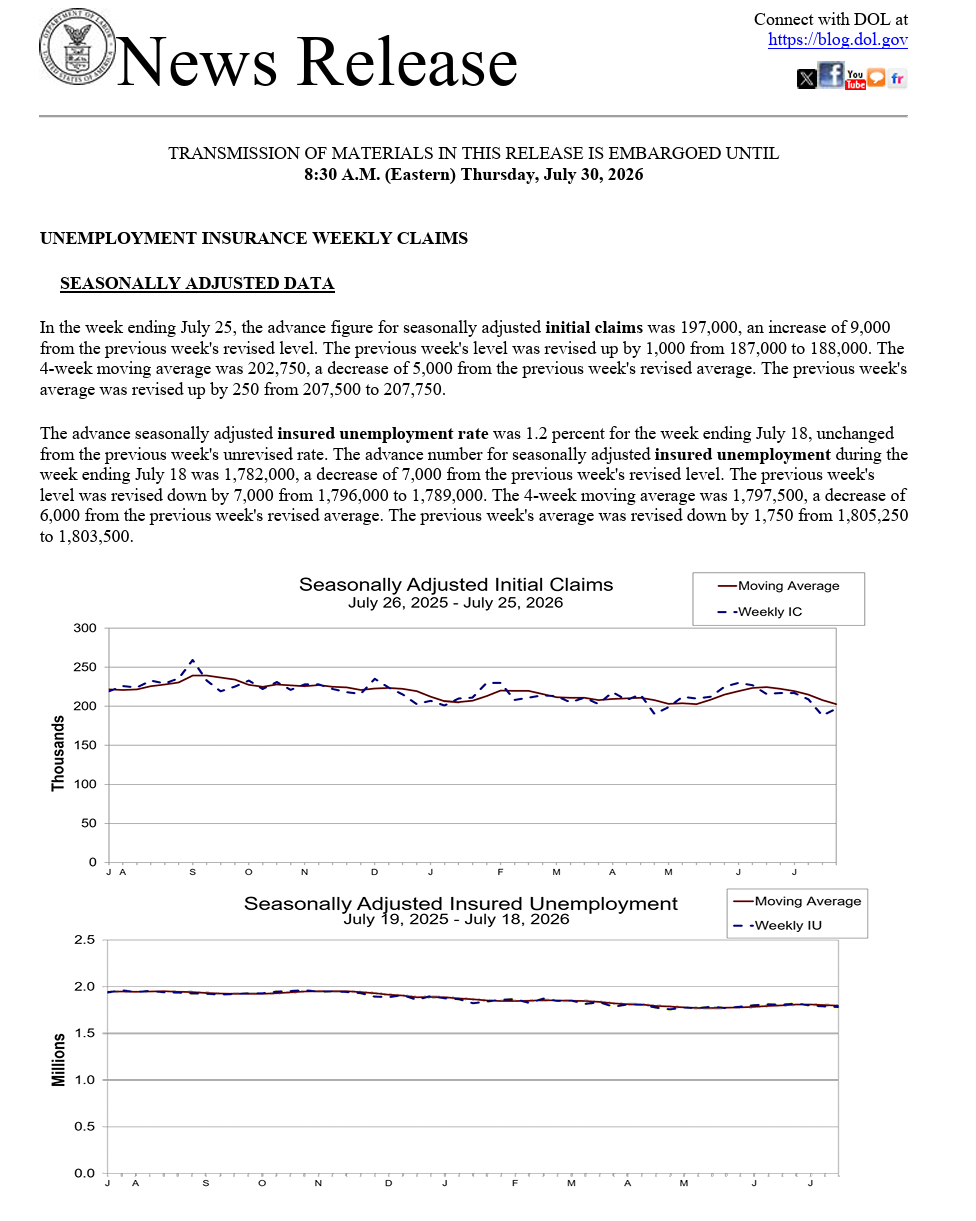
      Every Thursday at 8:30 AM Eastern Time, the U.S. Department of Labor releases the Weekly Jobless Claims report, which drive significant movements to global financial markets. And since it monitors state unemployment filings in real time, market participants and institutional investors utilize this to gauge recent corporate layoffs, business cycles, and overall economic status.


      Unlike monthly releases like Non-Farm Payrolls (NFP), this weekly claims report gives you an immediate vantage point into shifts in labor market health before market reacts.

      Post illustration

      Source: U.S. Department of Labor


      Core Components of the Report


      The Department of Labor tracks three primary metrics every weekly release:

      1. Initial Jobless Claims which counts first-time filers for state unemployment insurance over the previous week. Spikes signal corporate tightening and layoffs, while low figures indicate robust job security.
      2. Continuing Claims which measure the total number of individuals currently collecting ongoing unemployment benefits, tracking how quickly laid-off workers find new roles.
      3. 4-Week Moving Average as used by market professionals to filter out holiday spikes, seasonal shifts, weather disruptions, and statistical noise to reveal its true directional trends.


      Market Impact: How Jobless Claims Move Financial Assets

      Because employment data heavily dictates Federal Reserve monetary policy and interest rate trajectories, market participants watch this report closely across every major asset class:
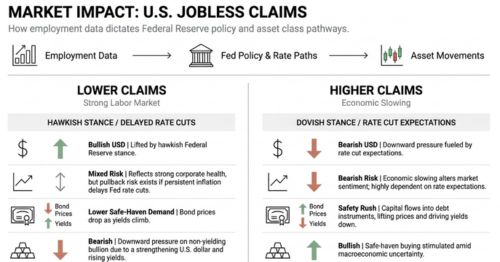

      1. For the Currencies or Forex such as U.S. Dollar or DXY with such as lower-than-expected claims support a hawkish Federal Reserve stance, creating a bullish environment for the U.S. Dollar. While higher claims fuel rate-cut expectations and put downward pressure on the currency.
      2. For the Equities (S&P 500 or Nasdaq) with low claims shows strong corporate health, though they can trigger stock market pullbacks if investors fear persistent inflation will delay Federal Reserve rate cuts. Rising claims signal economic slowing that may alter market sentiment depending on rate expectations.
      3. For the Fixed Income (Bonds & Yields) with low jobless claims reduce demand for safe-haven government bonds, causing bond prices to decline and yields to increase. Rising claims trigger a safety rush into debt instruments, lifting bond prices and driving yields down.
      4. For the Gold & Commodities as strong labor data with lower claims puts downward pressure on non-yielding bullion due to a strengthening U.S. dollar and rising yields. Spikes in jobless claims stimulate safe-haven buying amid macroeconomic uncertainty.


      Post illustration


      Technical Trading Framework for Jobless Claims


      Trading economic releases requires more than just looking at the headline number. Combine the data release with these technical tools to build a robust strategy:


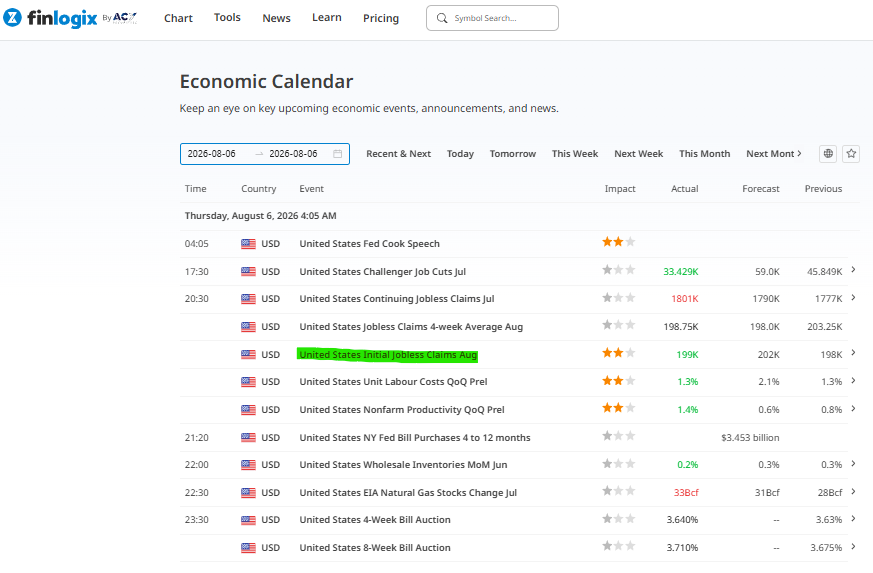
      The Economic Surprise Formula (Check the Difference)


      What it means-Measures how far off the actual report was from Wall Street consensus expectations.


      How to use it- Economic calendars

      Small difference- The market shrugs, and price action chops sideways.

      Big surprise- Triggers a strong trend. Trade in the direction of the surprise.

      Post illustration

      Source: Finlogix


      The RSI or Relative Strength Index Momentum Meter

      What it means- A momentum oscillator that runs from 0 to 100.

      How to use it- With above 50 signals buyers are in control and below 50 means sellers are in control.


      Never trade against a strong news trend just because the Relative Strength Index (RSI) looks overbought or oversold. Use it to confirm that momentum is backing your trade direction.


      Bollinger Bands Volatility Channels Usage


      What it means- An indicator featuring an upper, middle, and lower band that expands when volatility spikes.

      How to use it- When jobless claims drop at 8:30 AM, price will often violently shoot past the outer bands. It is frequently a fakeout. Let the initial spike calm down, wait for the price to pull back to the middle line (moving average), and this is where you should enter your trade.


      How to Utilize Employment Reports in Your Strategy


      1. US Weekly Jobless Claims- Use weekly momentum checks between major monthly reports.
      2. Non-Farm Payrolls (NFP)- Use for major, long-term structural trend shifts.
      3. ADP Employment Report- Use strictly as an early preview for what NFP might look like later that week.

      Understanding U.S. Employment Reports: Key Differences for Traders

      1. US Weekly Jobless Claims is published weekly every Thursday, tracking brand-new and ongoing state unemployment benefit filings. It serves as the fastest real-time economic indicator and early warning sign for corporate layoffs. In short, the picture of the labor market.
      2. Non-Farm Payrolls (NFP) is published monthly on the first Friday, measuring the total number of paid workers added or lost across the U.S. economy. It remains the gold standard of labor data, moving global forex and stock markets more than any other release.
      3. ADP Employment Report is released monthly on the Wednesday before the NFP, which tracks private-sector job creation based on ADP client payroll data.
      4. U.S. Unemployment Rate is released monthly alongside NFP, tracking the percentage of the total workforce actively looking for work. It functions as a lagging indicator that shifts only after the broader economy has already turned.


      Statistical Classification: How Economic Indicators Drive Macro Forecasting


      In quantitative macroeconomics and financial statistics, major employment reports are classified by their timing relationship to the business cycle:

      1. With Leading Economic Indicators- Predictive metrics (like US Weekly Jobless Claims) shift before the economy changes, allowing traders to forecast future trends like Gross Domestic Product (GDP) or Federal Reserve policy in advance.
      2. With Coincident Economic Indicators- Real-time metrics (like Non-Farm Payrolls) move alongside the economic cycle to offer an instant snapshot of current activity and labor market health.
      3. With Lagging Economic Indicators-Metrics that change after a trend is established (like the U.S. Unemployment Rate) are used historically to filter out noise and confirm structural shifts after the fact.


      Disclaimer: This content may have been written by a third party. ACY makes no representation or warranty and assumes no liability as to the accuracy or completeness of the information provided, nor any loss arising from any investment based on a recommendation, forecast or other information supplies by any third-party. This content is information only, and does not constitute financial, investment or other advice on which you can rely.

      ACY Securities is one of Australia's fastest growing multi-asset online trading providers, offering ultra-low-cost trading, rock-solid execution, technologically superior account management and premium market analysis.

      This content may have been written by a third party. LiquidityFinder makes no representation or warranty and assumes no liability as to the accuracy or completeness of the information provided, nor any loss arising from any investment based on a recommendation, forecast or other information supplies by any third-party. This content is information only, and does not constitute financial, investment or other advice on which you can rely.
      Comments
      Most Recent
      Written By
      Daily Newsletter

      LF Daily News

      Daily industry focused newsletter giving you an overview for the financial & finTech industry.

      See All Newsletters
      By clicking "Sign Up" you are agreeing to our Terms of Service and Privacy Policy
      RSS Feeds

      Create a custom RSS Feed

      Select the categories and companies you wish to follow directly to your person rss feed.

      Create Custom RSS Feed

      Related Categories:

      Related Tags:

      #ProviderNews#TradingPlatforms#MarketNews#TradingPlatform

      Related Articles:

      Find The Right Partners for
      Your Trading Business

      Sign up and join over 5,000 professional members who receive personalized news alerts, curated professional connections, and more for free!

      Create Your FREE Account
      Get access to latest news, updates, real-time data, brokerage and trading firm insights and customized information feeds.

      ATARIA CRM is a centralized platform designed for fintech teams to manage account operations, verification, fund management, and support in one place. With desktop and mobile access, it helps businesses stay connected, organized, and efficient.

      just now

      EUR/AUD hits the 1.60500 target after rejecting 1.61715–1.62300 resistance. Review the bearish price action setup and why trade confirmation mattered.

      just now

      Get an inside look at how rising Treasury yields and sector shifts into healthcare are impacting S&P 500 market dynamics, technical levels, and key economic drivers.

      just now

      Understand XAUUSD support and resistance with simple gold chart examples. Learn to identify key zones, assess price reactions, and avoid beginner mistakes.

      just now

      CMC Markets, a FTSE 250 multi-asset financial services firm, has launched a read-only ChatGPT integration for UK CFD clients, giving access to balances, positions, orders, pricing and historical market data through conversational prompts, as part of its ongoing investment in AI and cloud technology.

      just now

      DXtrade, the multi-asset trading platform from Devexperts, has integrated Notofin's trading performance intelligence solution, adding behaviour-first analysis, structured journaling and pattern recognition tools. Brokers licensing DXtrade can now offer Notofin's services to clients as part of the platform's open integration framework.

      just now

      KYC is essential for building trust, preventing fraud, and meeting regulatory requirements. A centralized system like ATARIA CRM helps compliance teams manage KYC requests, track pending documents, monitor approvals and rejections, and keep the entire verification process organized. By quickly identifying pending issues, businesses can reduce delays and provide customers with a smoother path from “Pending” to “Approved.”

      just now

      Build better trading habits with a trading journal. Learn how a trading memory bank helps you review mistakes, manage emotions, and develop confidence.

      just now

      GBP/USD has fallen to 3-month lows near 1.3200 due to strong US economic data and weakening UK consumer demand, though technical indicators like an RSI of 25.18 suggest the pair is now in oversold territory near key support at 1.3150.


      just now
      Feed