just now


Liquidity Finder Ltd is incorporated in England and Wales, company number 10610740, registered address 167-169 Great Portland Street, Fifth Floor, London W1W 5PF, United Kingdom.
Published: just now
Market dynamics present an instructive environment for traders examining fundamental indicators and technical price movements. Recent capital shifts across major US equities highlight a noticeable divergence between defensive sectors and growth-oriented stocks, while broader economic trends in Treasury yields continue to influence overall benchmark valuations.
Key Takeaways
Source: Bloomberg
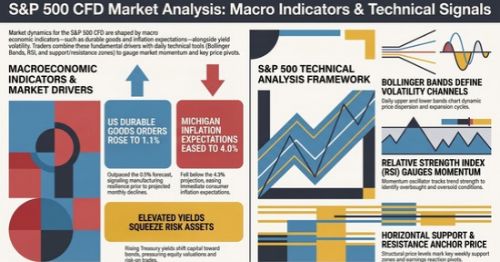
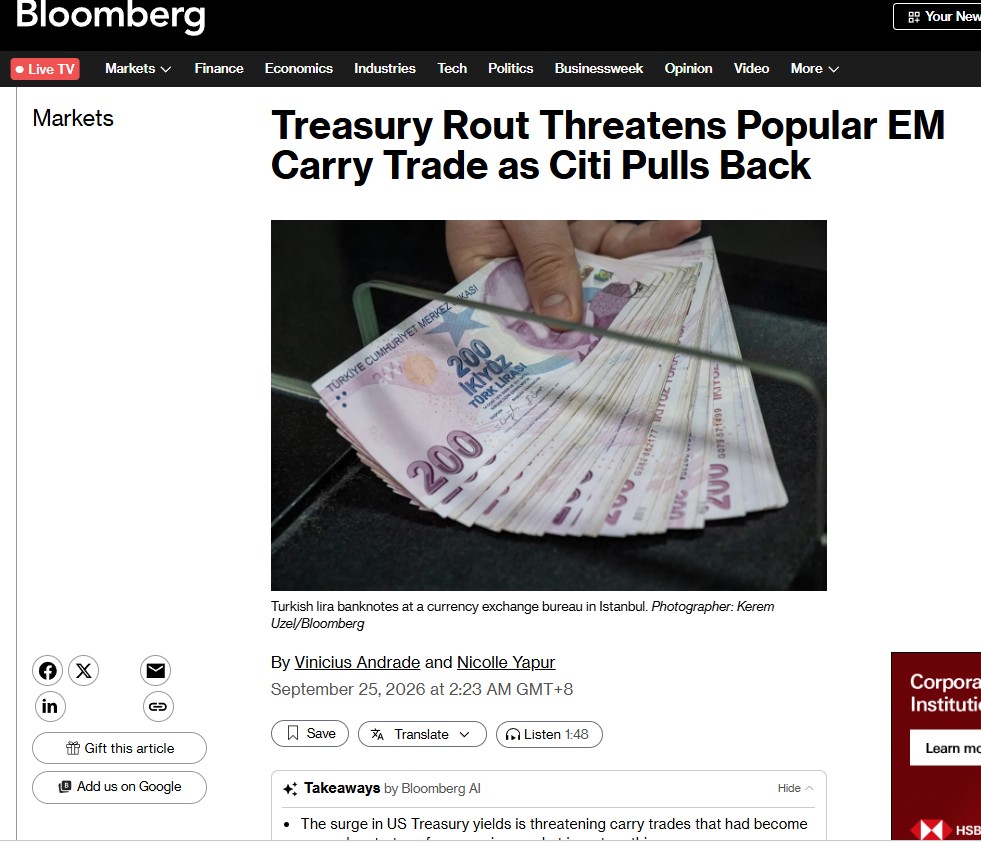
Fundamental drivers currently governing the stock index center on rising US Treasury yields and shifting corporate margin outlooks. Higher bond yields raise borrowing costs across the economy, impacting corporate earnings expectations and consumer spending power. Furthermore, elevated global market volatility has prompted major institutions like Citigroup to close speculative carry trade positions, reflecting a broader turn toward risk reduction.
Source: Barrons
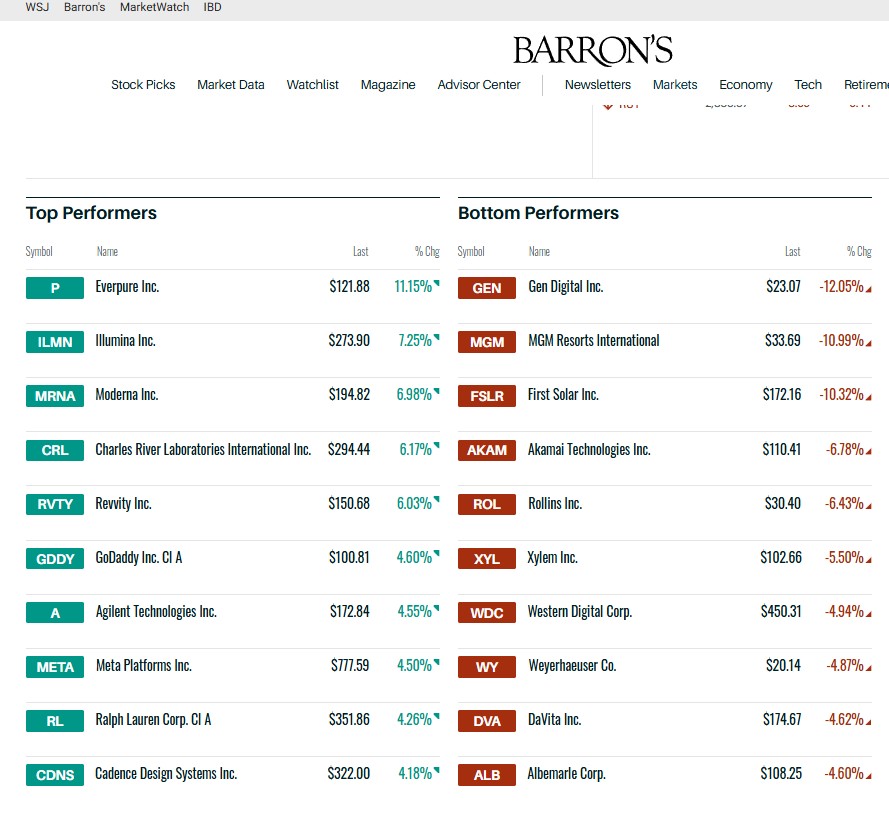
Inside the stock index, sector behavior reflects clear capital reallocation. Investors are leaning toward healthcare and life science equities, driving notable gains in Everpure (+11.15%), Illumina (+7.25%), Moderna (+6.98%), and Charles River Laboratories (+6.17%). On the other hand, technology, clean energy, and consumer cyclical stocks face downside pressure, led by declines in Gen Digital (-12.05%), MGM Resorts (-10.99%), and First Solar (-10.32%).
To navigate incoming fundamental developments, market participants often evaluate two core balanced scenarios:
Source: Finlogix
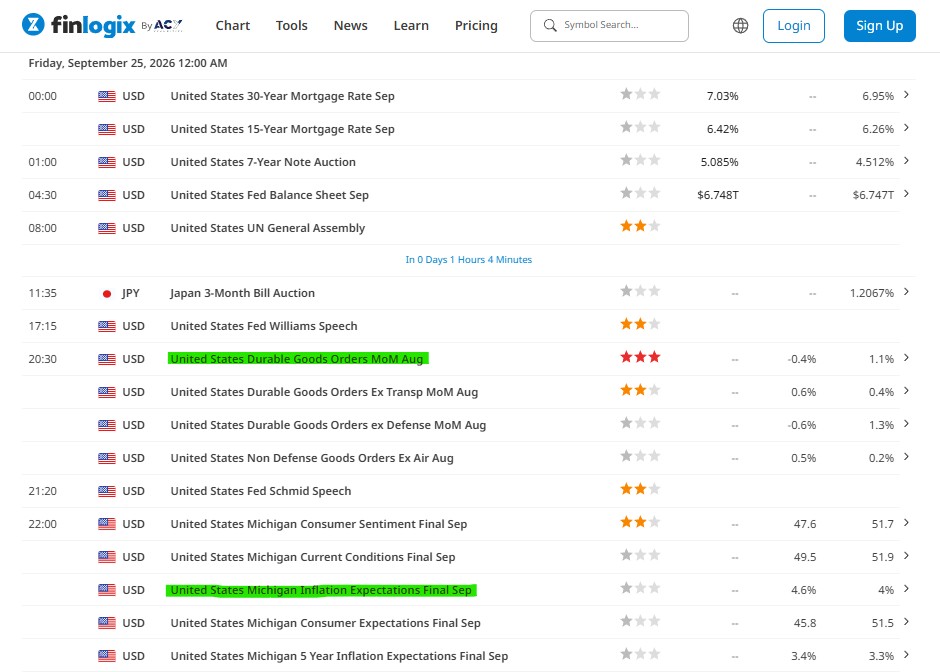
Key scheduled economic releases on the Finlogix economic calendar provide crucial insight into economic health and price trends. Traders monitor these data releases to gauge macroeconomic stability and central bank policy trajectories.
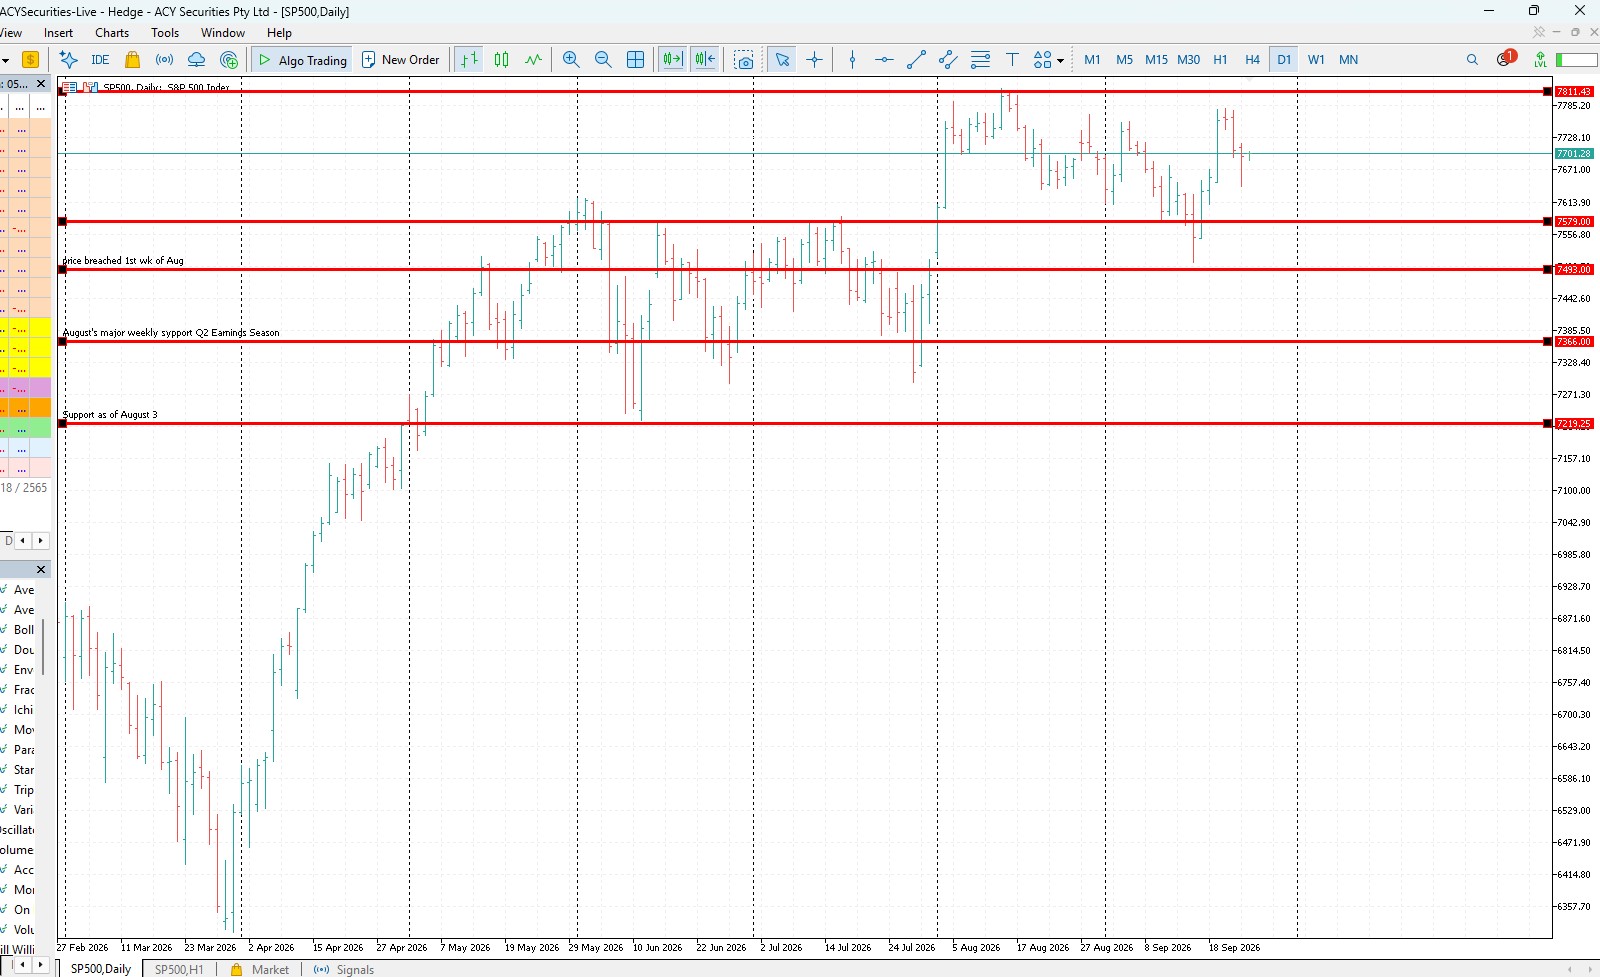
Technical analysis on the daily S&P 500 chart provides a structural framework when integrated with fundamental news drivers. The index is presently consolidating around the 7,701 level, situated between intermediate moving averages and key structural boundaries.
Source: ACY MetaTrader5
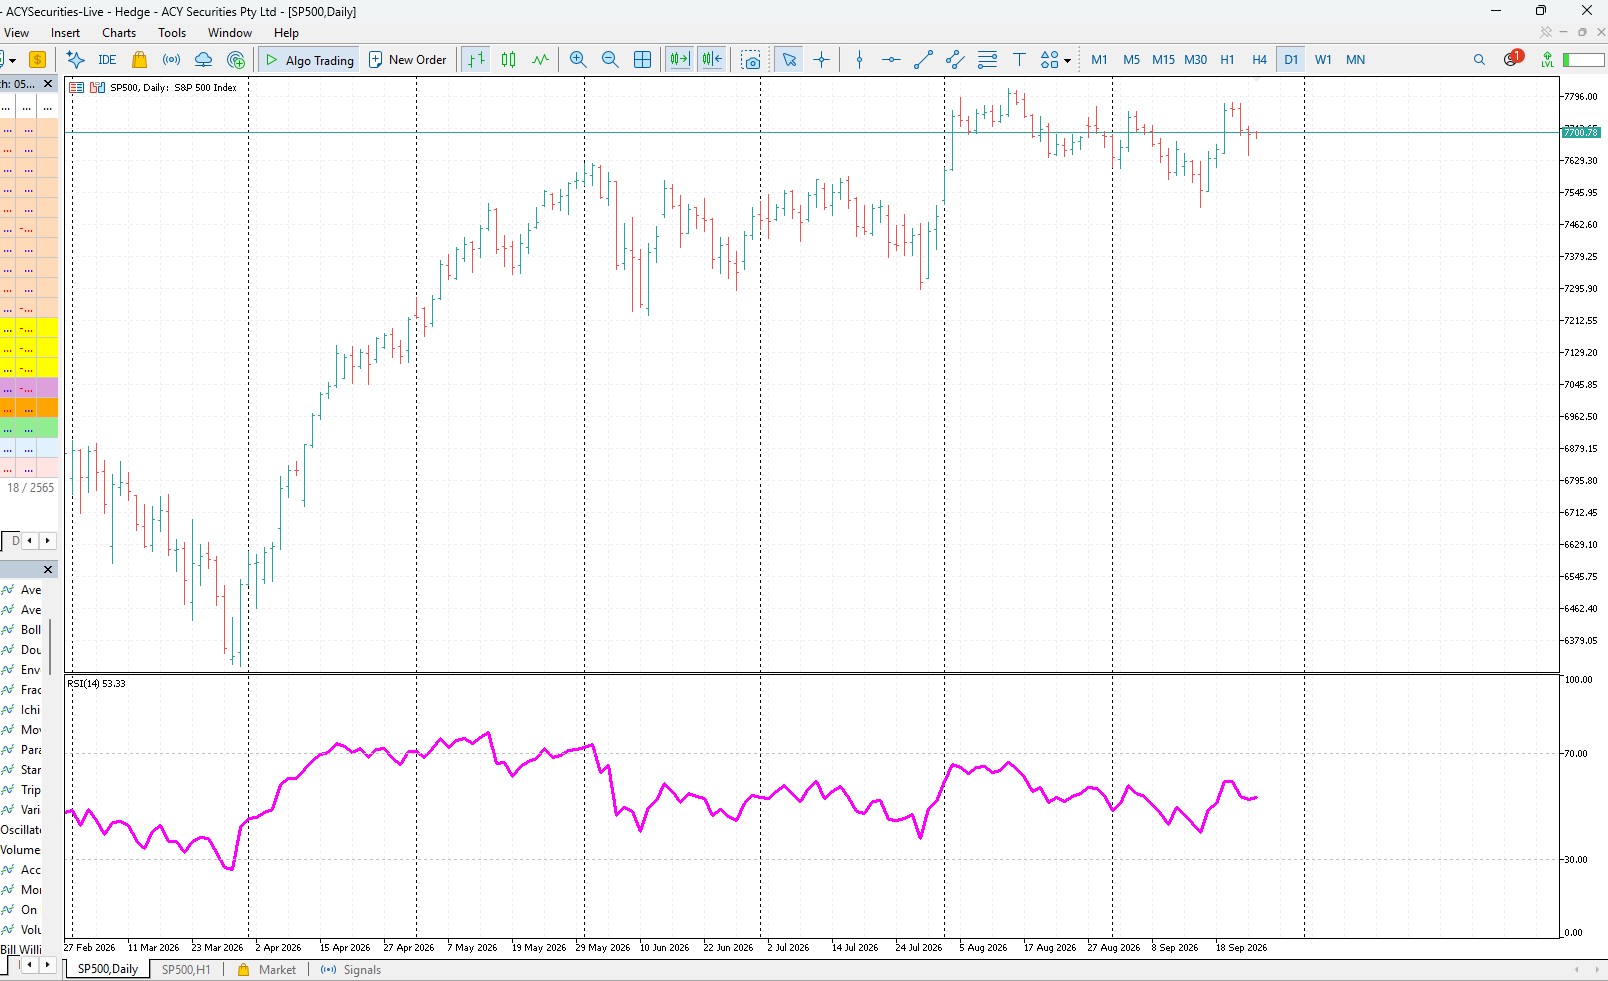
The Relative Strength Index (RSI) with a 14-period setting currently stands at 53.33, placing momentum squarely in neutral territory (neither overbought above 70 nor oversold below 30).
Source: ACY MetaTrader5
On the Bollinger Bands, price action rests near the middle moving average (~7,671), bounded by upper band resistance near 7,785 and lower band support near 7,556.
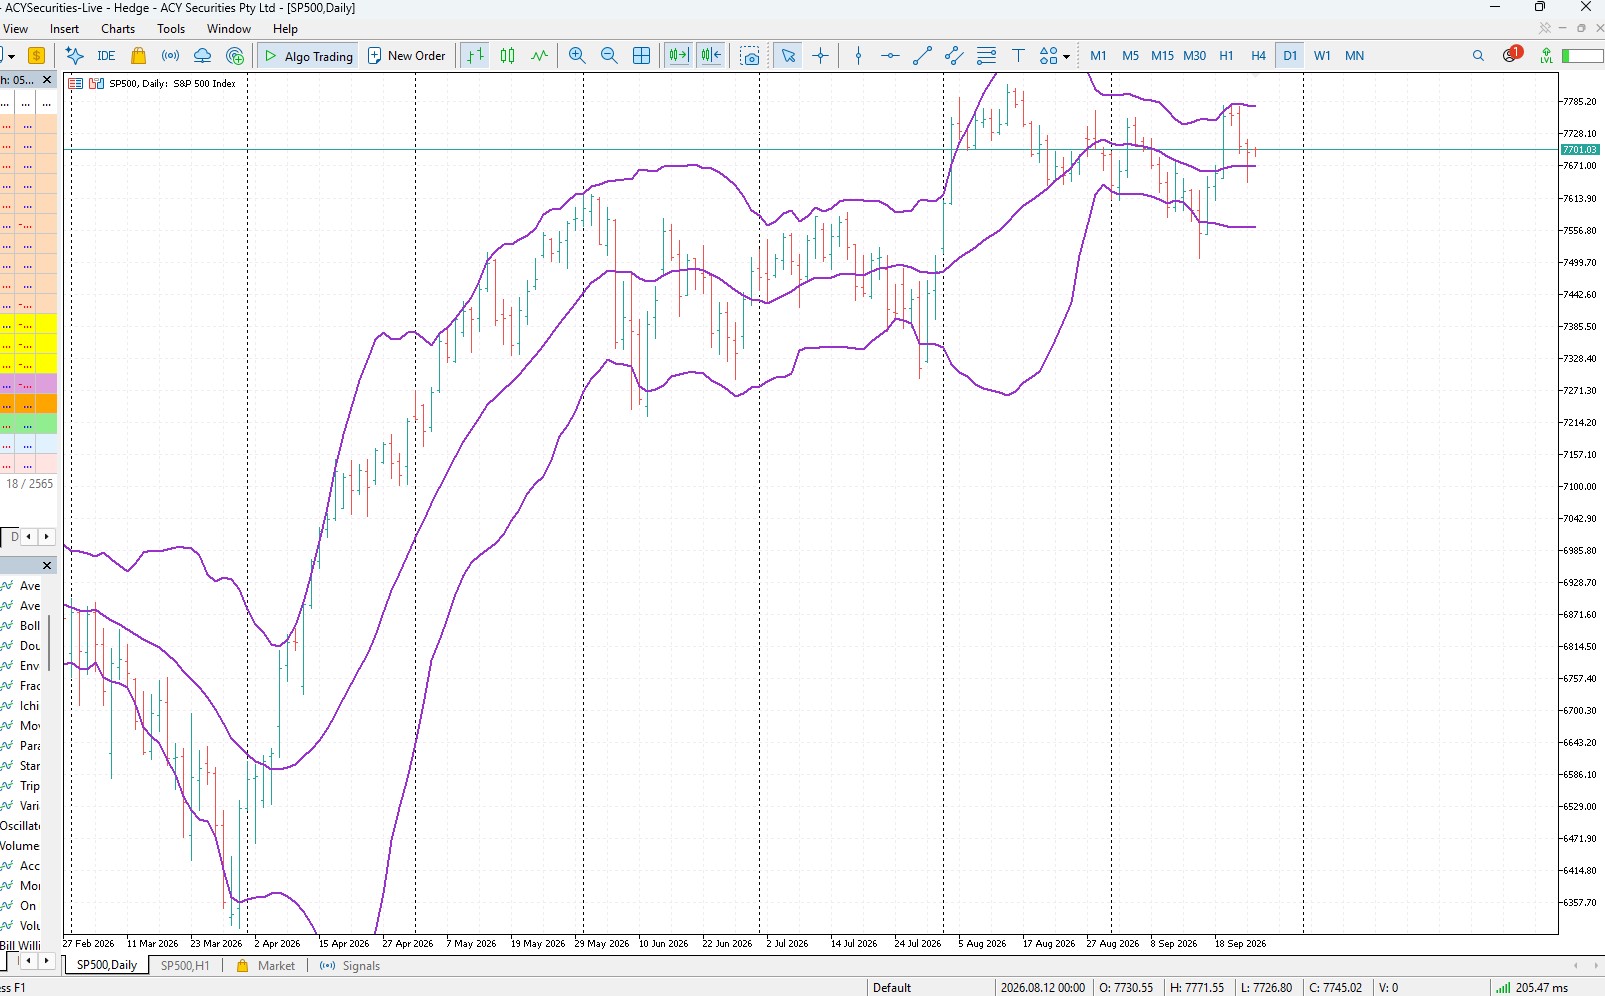
Source: ACY MetaTrader5
When major economic reports drop like unexpected durable goods figures or inflation shifts trading activity typically concentrates around these established technical boundaries.
Below is a technical snapshot outlining key price levels and indicator values:
| Indicator / Level Type | Price Level / Value | Technical Context & Interpretation |
| Primary Resistance | 7,811.43 | August chart high boundary |
| Upper Bollinger Band | ~7,785.00 | Upper volatility band resistance |
| Current Price Level | 7,701.03 | Current daily market quote |
| Middle Bollinger Band (20 MA) | ~7,671.00 | Dynamic baseline support level |
| Horizontal Support 1 | 7,579.00 | Early August breakout breached level |
| Lower Bollinger Band | ~7,556.00 | Lower volatility band boundary |
| Horizontal Support 2 | 7,493.00 | Major structural support floor |
| Relative Strength Index (RSI 14) | 53.33 | Neutral momentum reading |
Disclaimer: This content may have been written by a third party. ACY makes no representation or warranty and assumes no liability as to the accuracy or completeness of the information provided, nor any loss arising from any investment based on a recommendation, forecast or other information supplies by any third-party. This content is information only, and does not constitute financial, investment or other advice on which you can rely.
ACY Securities is one of Australia's fastest growing multi-asset online trading providers, offering ultra-low-cost trading, rock-solid execution, technologically superior account management and premium market analysis.

Select the categories and companies you wish to follow directly to your person rss feed.
Create Custom RSS FeedSign up and join over 5,000 professional members who receive personalized news alerts, curated professional connections, and more for free!
The SEC has approved Cboe's binary options tied to key performance indicators reported by 23 companies, covering more than 100 metrics such as iPhone revenue. The cash-settled contracts pay a fixed $1, Robinhood plans to be the first retail broker to offer them, and trading awaits clearing registration.
Gold is trading around $4,150, recovering sharply after falling to a recent low of $4,073.

Global semiconductor and technology stocks sold off sharply on Thursday, with South Korea’s SK Hynix plunging over 10% and Samsung Electronics falling more than 8%.
Learn gold market structure to identify bullish, bearish and ranging XAUUSD trends using higher highs, higher lows, lower highs and lower lows, support and resistance.
Axi has launched an MCP integration connecting eligible MT5 accounts to Claude, allowing clients to access live market data, track positions, execute trades and update risk parameters through the AI assistant developed by Anthropic. Available to eligible Axi clients with an active MT5 account. Setup runs via Claude.ai.
Movantis has selected Integral to extend its FX liquidity offering for institutional clients including banks, payment networks and digital asset operators, adding an institutional trading platform, direct-to-client API trading and API connectivity into a third-party multi-dealer venue, supporting regional expansion.
Running a venue around the clock is the easy part. Pricing risk when the market underneath it is shut is not. Lars Holst, CEO of GCEX explains how to manage risk in 24/7 markets.
ATFX has released its Q4 2026 Trader Magazine, offering a closer look at the macroeconomic and market forces that could shape trading conditions in the final quarter of the year.
LSEG has announced a collaboration with NVIDIA that lets financial institutions analyse years of LSEG Tick History data in seconds using NVIDIA cuDF on GPUs, without creating another full copy of the dataset. Tick History holds 110 trillion rows across 100 million instruments and more than 580 venues and contributors.
Standard Chartered has launched a cryptocurrency trading solution letting eligible affluent clients buy and sell Bitcoin and Ether through existing bank accounts. Built with Zodia Markets and regulated by VARA, it launches first for Professional Investor clients in the UAE, with other markets to follow over time.