just now


Liquidity Finder Ltd is incorporated in England and Wales, company number 10610740, registered address 167-169 Great Portland Street, Fifth Floor, London W1W 5PF, United Kingdom.
Published: just now

To successfully navigate the West Texas Intermediate or WTI crude oil trading, as a commodity asset, it needs a disciplined combination of macroeconomic fundamentals plus technical execution. And by a mixture of the API and EIA supply data reports with proven chart indicators like the EMA or Exponential Moving Average and Relative Strength Index or RSI, you can filter out the market noise, align with institutional momentum, and capture high-probability setups.
Before analyzing price charts, you must monitor three critical weekly data releases that dictate global supply and demand dynamics, we have
Crude Draw- If actual inventories drop more than expected, it is bullish (prices tend to rise).
Crude Build- If inventories rise more than expected, it is bearish (prices tend to fall).
Filter by Fundamentals to Establish Directional Bias
Never trade raw numbers reactively at the exact moment of a news release.
Instead, evaluate the EIA Crude Oil Inventories actual change versus market expectations using the inventory surprise
Combine Technical Indicators for Precise Entry
Once you have established your fundamental bias, wait for a post-news pullback onto a key technical level using these three core indicators
Trading Rule Only open long positions if price is above the 50 EMA. Only open short positions if price is below the 50 EMA.
Bullish Rule Look for the RSI (14) to pull back from near overbought down to support around the 50–40 zone.
Bearish Rule Look for the RSI (14) to pull up from oversold into the 50–60 resistance zone.
Trading Rule Look for prices bouncing off the Middle Band for trend continuation,or rejecting the Outer Bands for mean reversion.
Below 5-Minute Chart
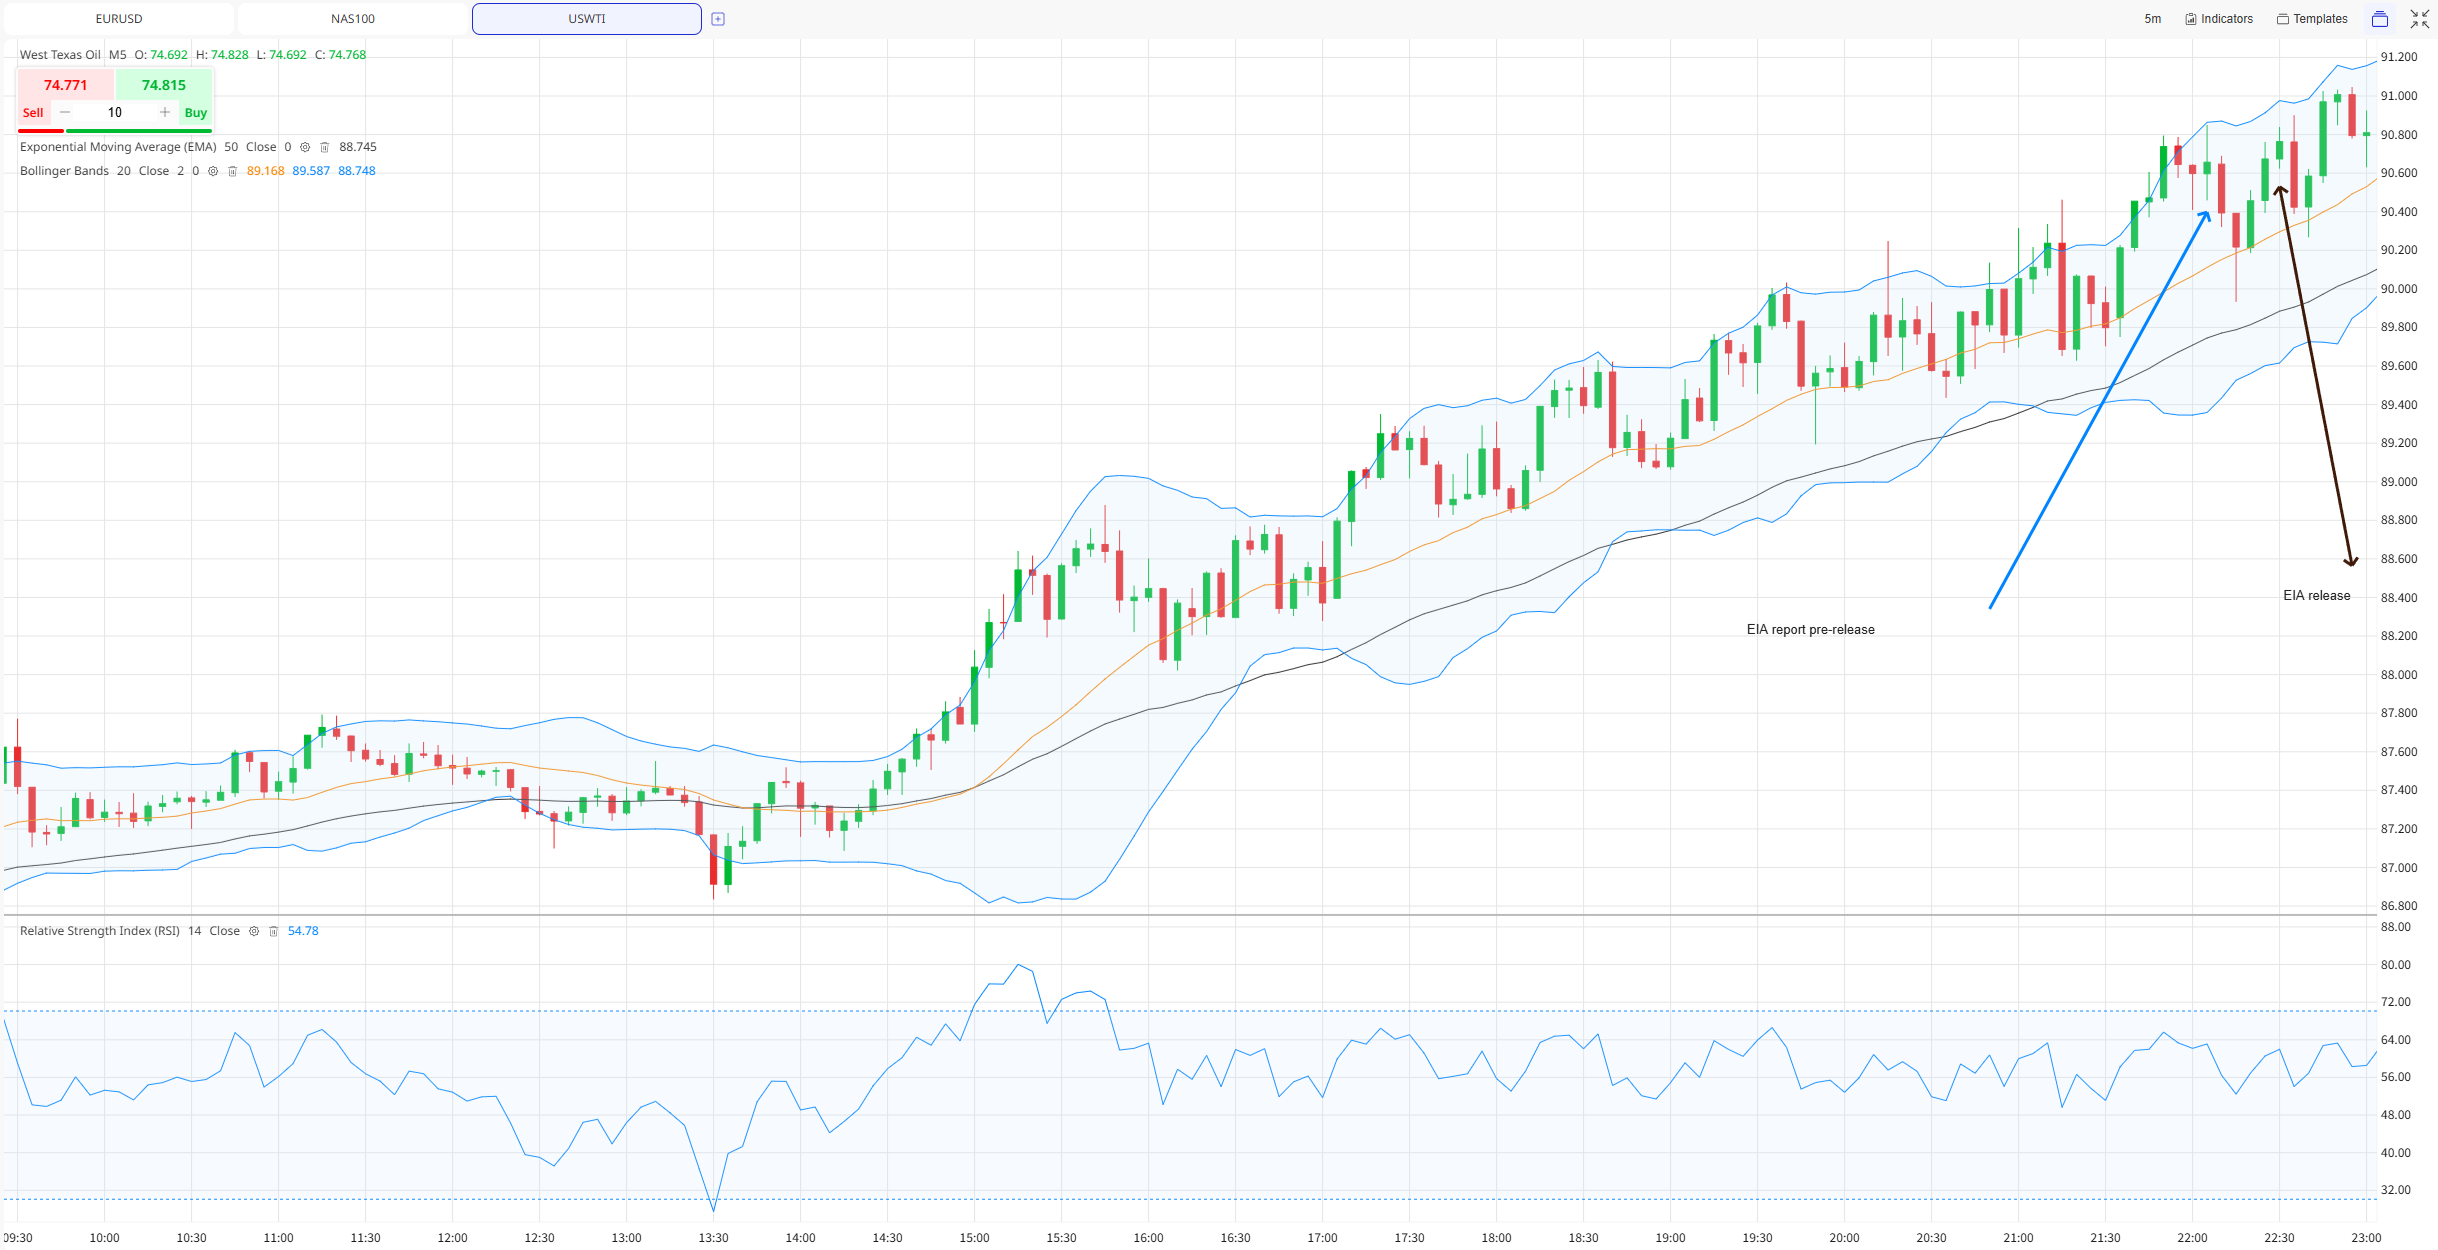
Source: ACY
To see how a combined fundamental and technical trading framework operates in live markets, let's examine the market reaction from the week ending July 17, 2026, with official data published by the U.S. Energy Information Administration (EIA) on July 22, 2026.
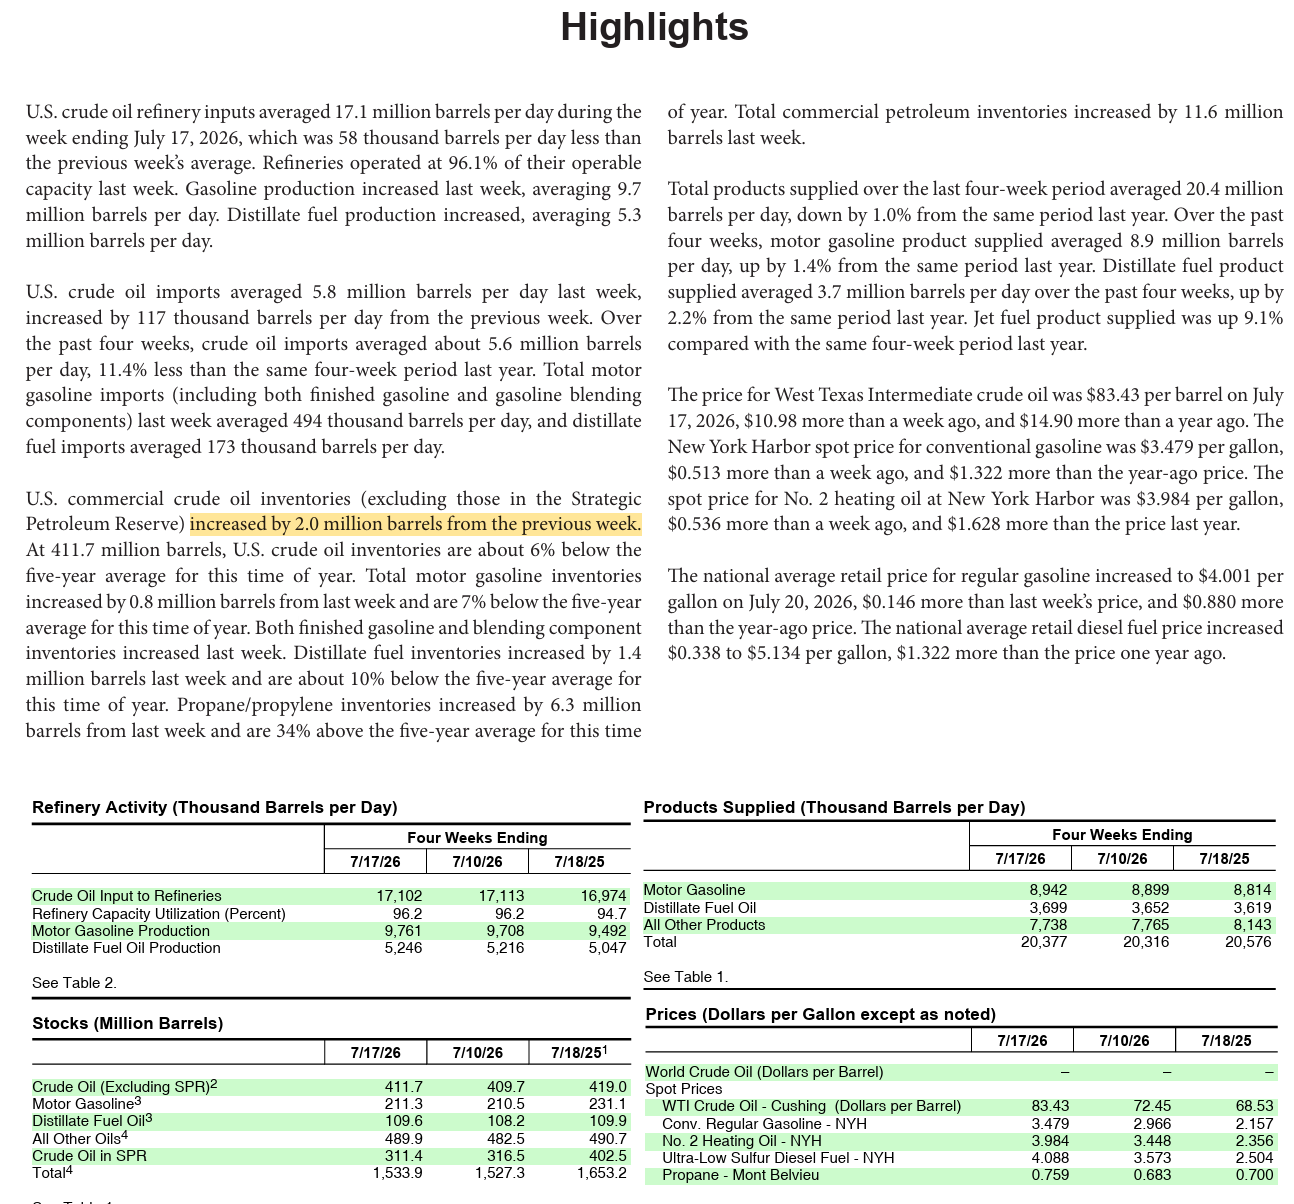
Source: Energy Information Administration
The Numbers & The Market Surprise
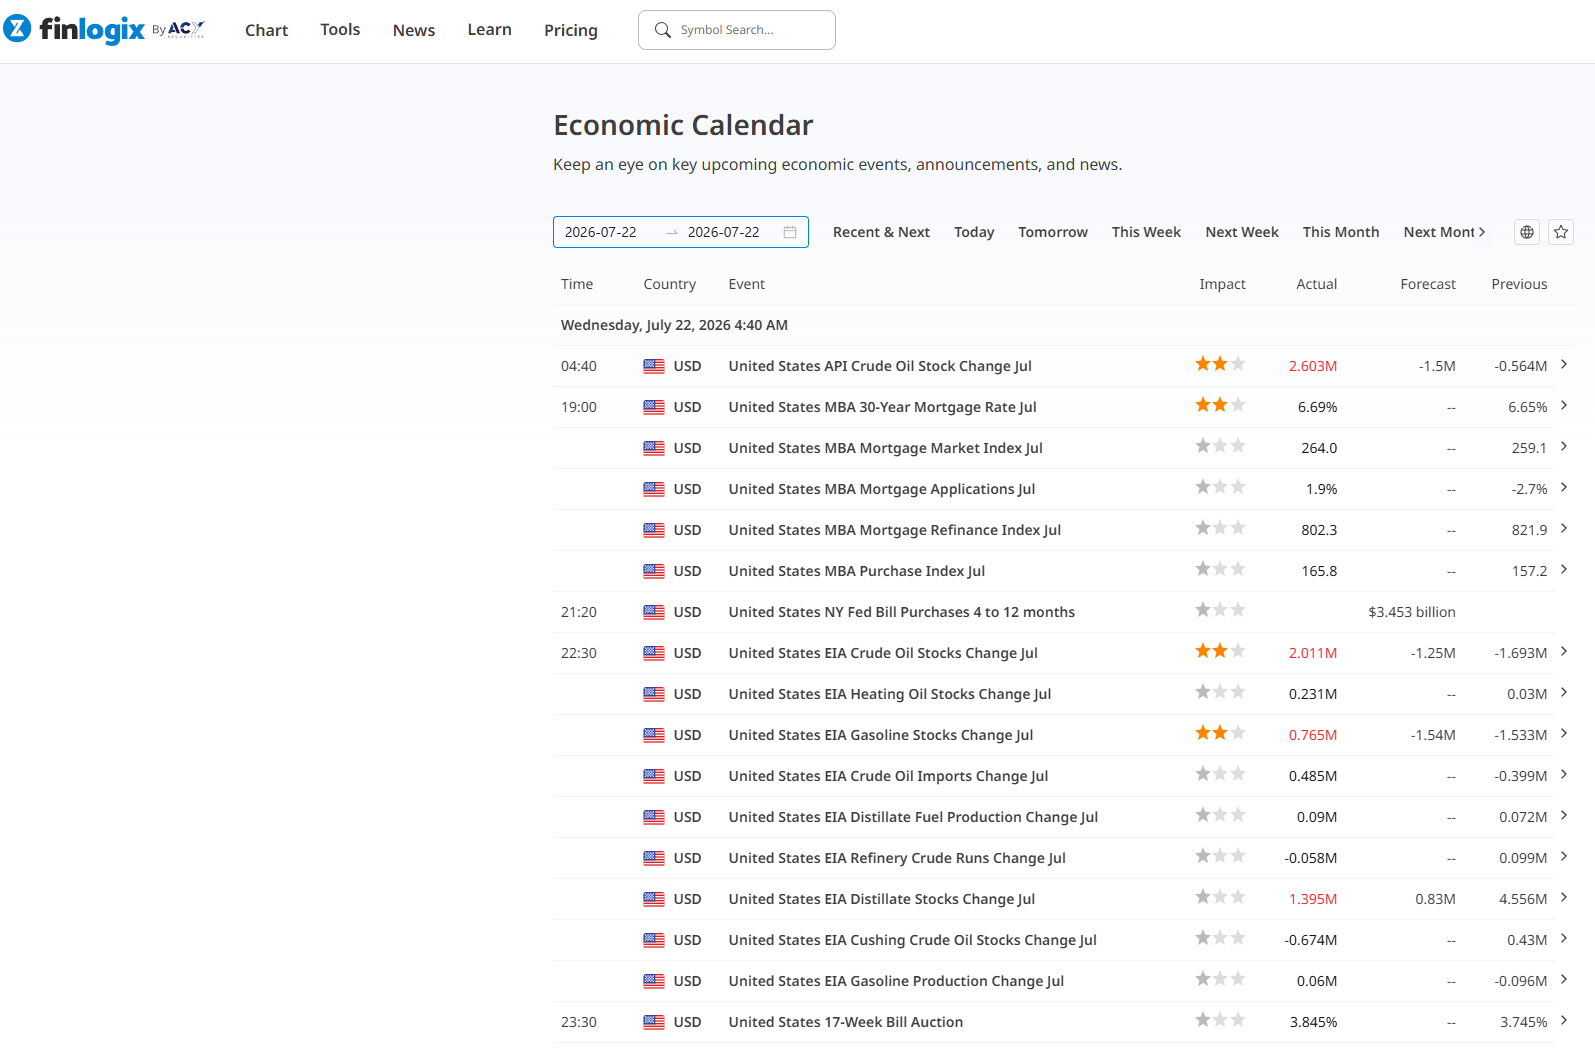
Source: Finlogix
Because expectations flipped from a projected drawdown to an actual surplus, the total data miss hit a cumulative 3.0 million barrels. This sharp divergence instantly invalidated bullish positions and established a dominant bearish fundamental bias across the energy complex.
Below Daily Chart
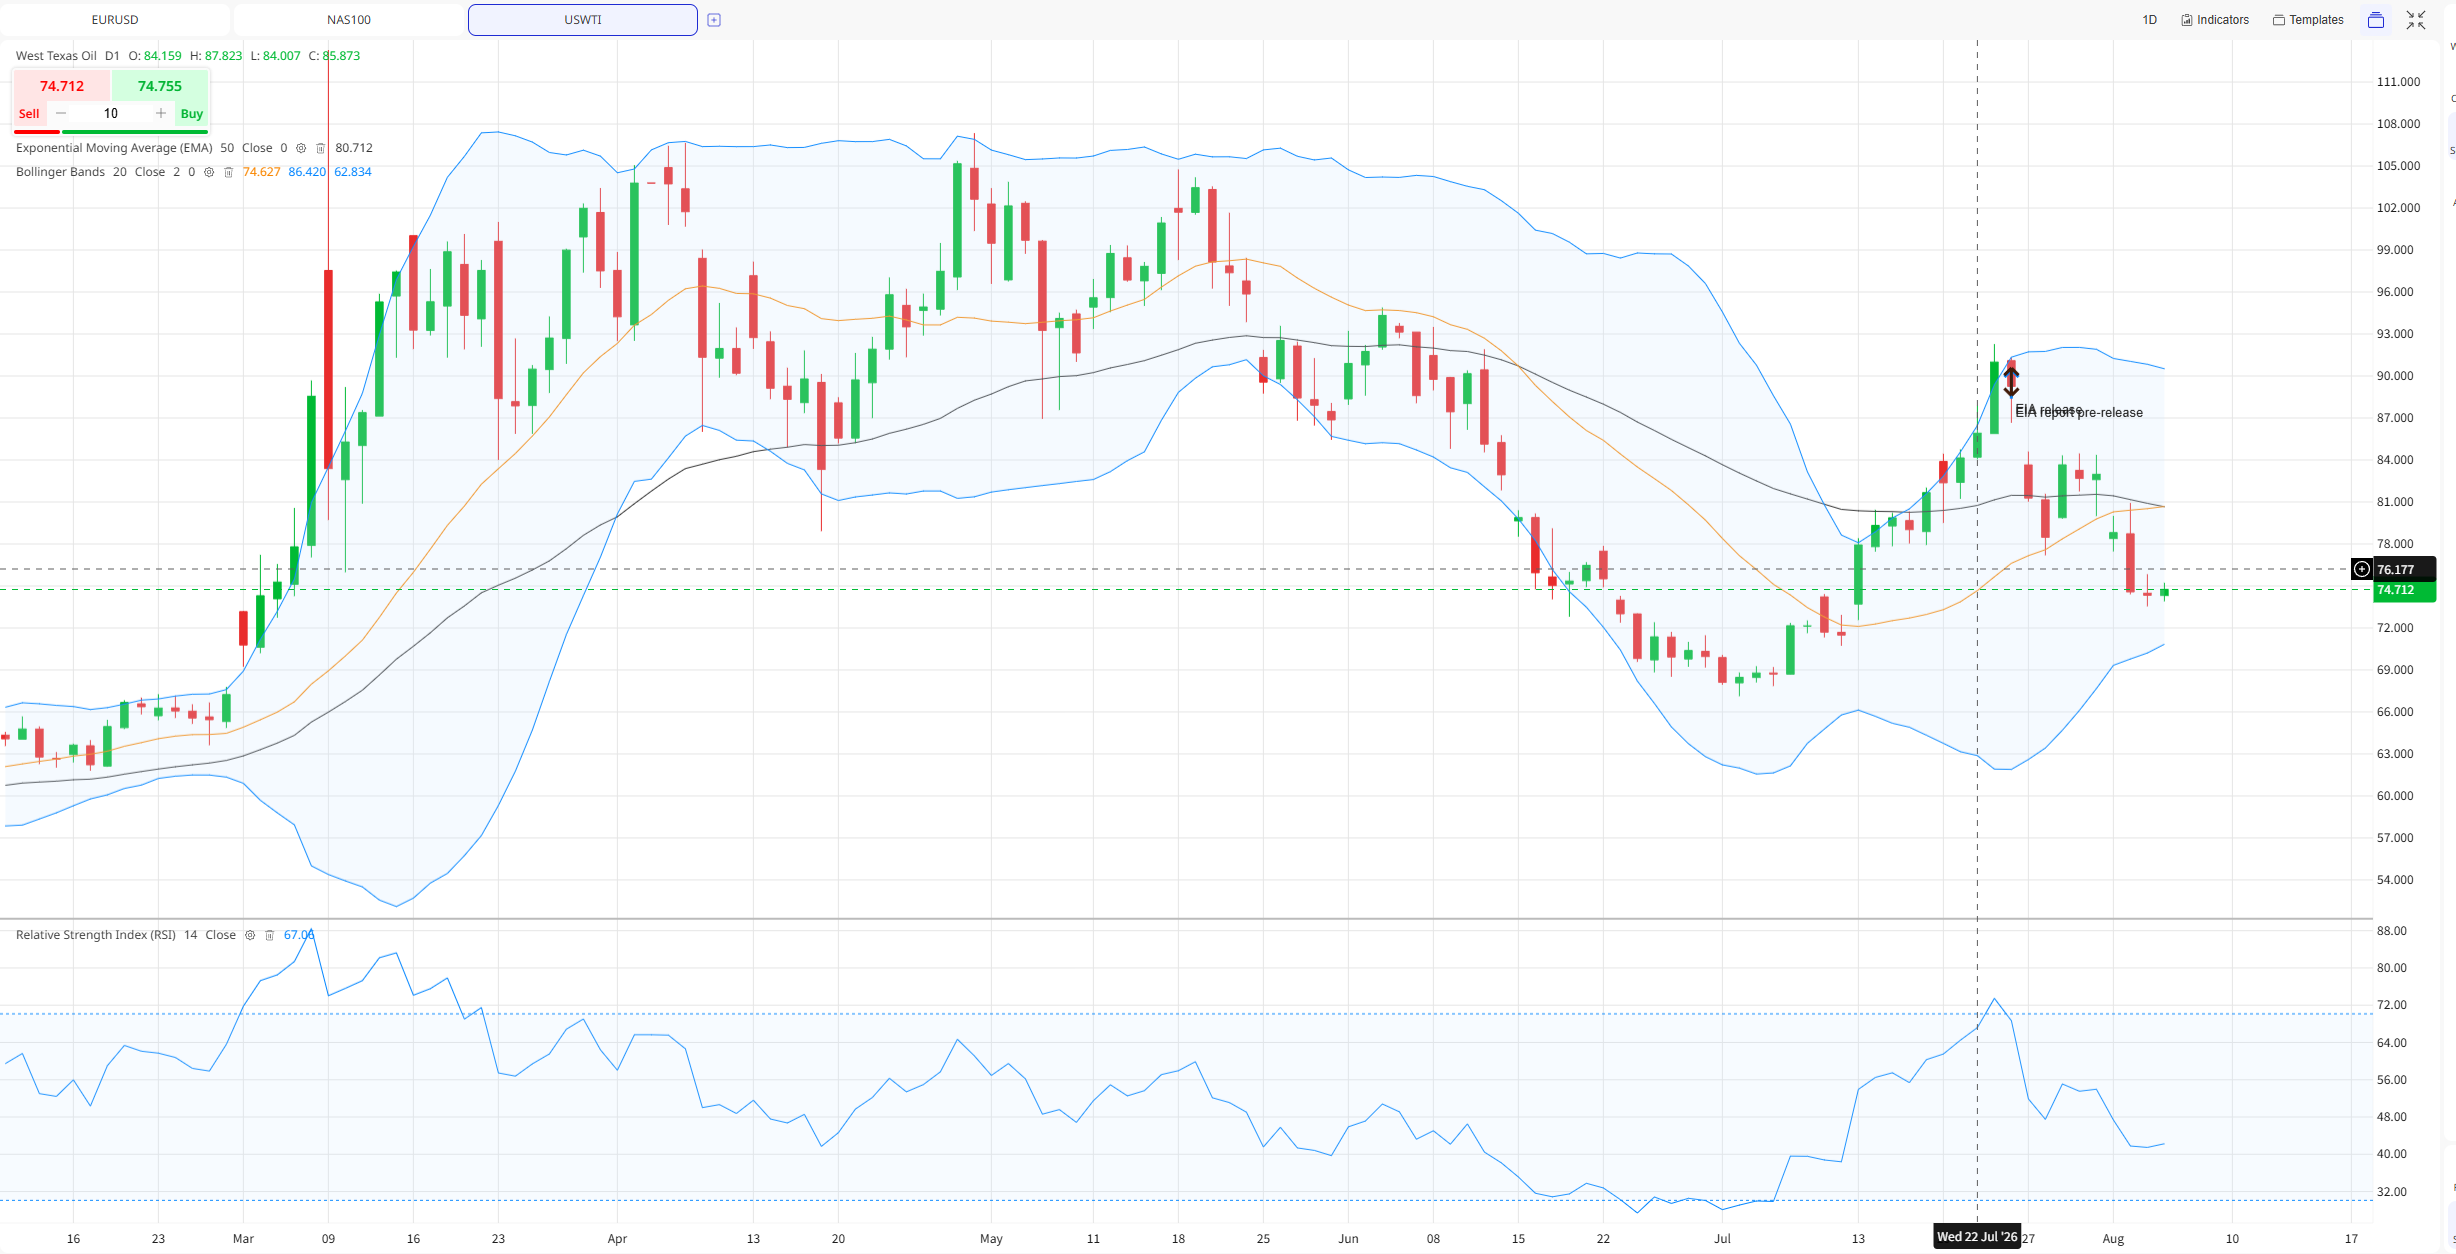
Source: ACY
With physical oversupply running well ahead of consensus estimates, the crude oil market faced immediate downside momentum.
The Inventory Surprise Formula
To calculate the inventory surprise and determine your fundamental trading bias in a single step, use this formula
Inventory Surprise=Actual Change-Analyst Forecast
How to Apply the Formula
Case Study Calculation
The positive result (+3.0) confirms an outright inventory build and a larger-than-expected supply surplus, triggering the rule to look exclusively for SHORT opportunities at key technical resistance levels.
What It Means for Trading:
Disclaimer: This content may have been written by a third party. ACY makes no representation or warranty and assumes no liability as to the accuracy or completeness of the information provided, nor any loss arising from any investment based on a recommendation, forecast or other information supplies by any third-party. This content is information only, and does not constitute financial, investment or other advice on which you can rely.
ACY Securities is one of Australia's fastest growing multi-asset online trading providers, offering ultra-low-cost trading, rock-solid execution, technologically superior account management and premium market analysis.

Select the categories and companies you wish to follow directly to your person rss feed.
Create Custom RSS FeedSign up and join over 5,000 professional members who receive personalized news alerts, curated professional connections, and more for free!
Theorem has integrated Symbiotic’s Liquid Lane RFQ network, letting holders of tokenised real-world assets trade against on-chain pool liquidity and market-maker quotes. The integration is live on Ethereum, with Midas’s yield-bearing mHYPER fund as the first supported asset. Holders can trade for the USDC stablecoin.
US equities were volatile with technology selloff erasing much of the earlier rebound.
FM Summit London 2026 returns to Old Billingsgate on 24 November for its 15th edition, with LMAX Group, Plus500 and oneZero among confirmed exhibitors. The one-day event adds Business Connect meetings and roundtables, and opens with a networking evening at The Folly on 23 November.
Finance Magnates Summit London returns to Old Billingsgate on 24 November 2026 for its 15th edition. The one-day event brings together brokers, liquidity providers, institutional firms, trading technology vendors, payments businesses and digital asset firms.
iSAM Securities Apex has integrated with Match-Prime, giving brokers access to liquidity across more than 2,000 instruments, with tailored pricing and up to 10 levels of market depth.
propfunding.com's free-entry instant funding changes the order of prop funding. Start trading first. Its free-entry instant funding model offers two qualification attempts without an upfront activation fee.
US stocks closed higher on Wednesday, with the Nasdaq gaining 1%, the S&P 500 rising 0.6%, and the Dow advancing 0.7%, as renewed enthusiasm for AI-related stocks lifted market sentiment.
SpaceX went public in June as a rocket company. On October 20 it reported as something else entirely: an AI infrastructure business, financed by a satellite broadband network, with a launch division attached. Rockets generated 12% of third quarter revenue and lost money. The AI segment generated 52% of revenue and consumed 84% of capital expenditure. Starlink generated 85% of operating profit.
Standard Chartered has signed definitive agreements to acquire 100% of Zodia Custody UK Limited, folding its regulated digital asset custody business into Securities Services. Zodia Solutions will be set up under SC Ventures with bank investors including Northern Trust, NAB Ventures, Emirates NBD and Investcorp.
Bybit Fintech FZE has secured a Virtual Asset Service Provider licence from Dubai’s Virtual Assets Regulatory Authority for Exchange Services, covering spot trading. Bybit’s Peter Loo said the firm hopes to add derivatives, subject to regulatory approvals. Its international Dubai headquarters opened in 2022.