just now

Liquidity Finder Ltd is incorporated in England and Wales, company number 10610740, registered address 167-169 Great Portland Street, Fifth Floor, London W1W 5PF, United Kingdom.
Published: just now

Oil and gas markets sold off aggressively on Wednesday after reports emerged that Iran is considering a new US proposal aimed at easing tensions and restoring flows through the Strait of Hormuz.
Brent crude briefly fell below $100/bbl, while WTI crude dropped sharply as traders priced out some of the geopolitical risk premium that had built into the market over recent weeks. European natural gas prices also declined as fears of a prolonged disruption to Middle Eastern energy exports eased.
By Thursday morning, however, oil prices had stabilised near the $100 level after an almost 8% one-day decline, highlighting that traders remain cautious despite improving headlines.
The proposed framework reportedly includes a phased reopening of Hormuz and the easing of US restrictions on Iranian port access. While no agreement has been finalised, the market is beginning to price in the possibility of additional supply returning to global markets over the coming months.
Still, this remains a headline-driven environment, and volatility is likely to stay elevated.
The latest EIA inventory report showed US crude stockpiles fell by 2.3 million barrels last week. While supportive on the surface, the draw was slightly smaller than market expectations and far below the API’s earlier estimate of an 8.1 million barrel decline.
A key reason for the smaller draw was a sharp drop in exports, which fell by 1.7 million barrels per day week-on-week after hitting record highs previously.
Additional highlights from the report included:
Overall, the data suggests underlying US demand remains relatively firm, although elevated fuel prices could eventually begin weighing on consumption.
Despite the market sell-off, supply conditions remain historically tight.
According to Bloomberg’s latest OPEC survey, cartel production fell by 420k b/d month-on-month to 20.55m b/d — the lowest level since 1990.
The largest declines came from:
War-related disruptions and constrained export routes through Hormuz continue to impact production and shipping flows across the region.
This is one reason traders remain hesitant to fully unwind bullish positioning despite improving diplomatic headlines.
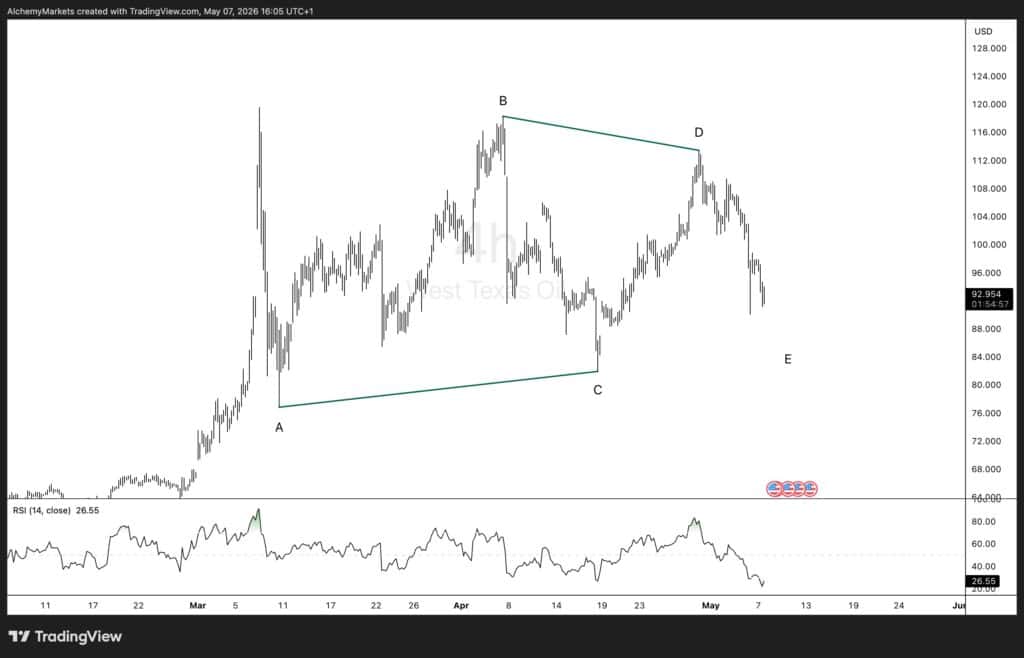
From a technical perspective, one bullish interpretation is that WTI crude may be completing a large Elliott Wave triangle pattern.
The structure appears to show a contracting ABCDE formation, with price respecting converging trendlines over the past several weeks. Under this scenario, the recent sell-off into wave E could represent the final shakeout before a directional breakout higher.
RSI has also moved toward oversold territory on the 4-hour timeframe, which may suggest downside momentum is becoming exhausted.
If buyers regain control, traders will likely watch for:
A confirmed breakout from the triangle could open the door toward a retest of the April highs near the $115-$118 region.
In Elliott Wave theory, triangle patterns often occur before the final impulsive move in the direction of the broader trend, meaning bulls will argue the larger uptrend remains intact unless support decisively breaks.
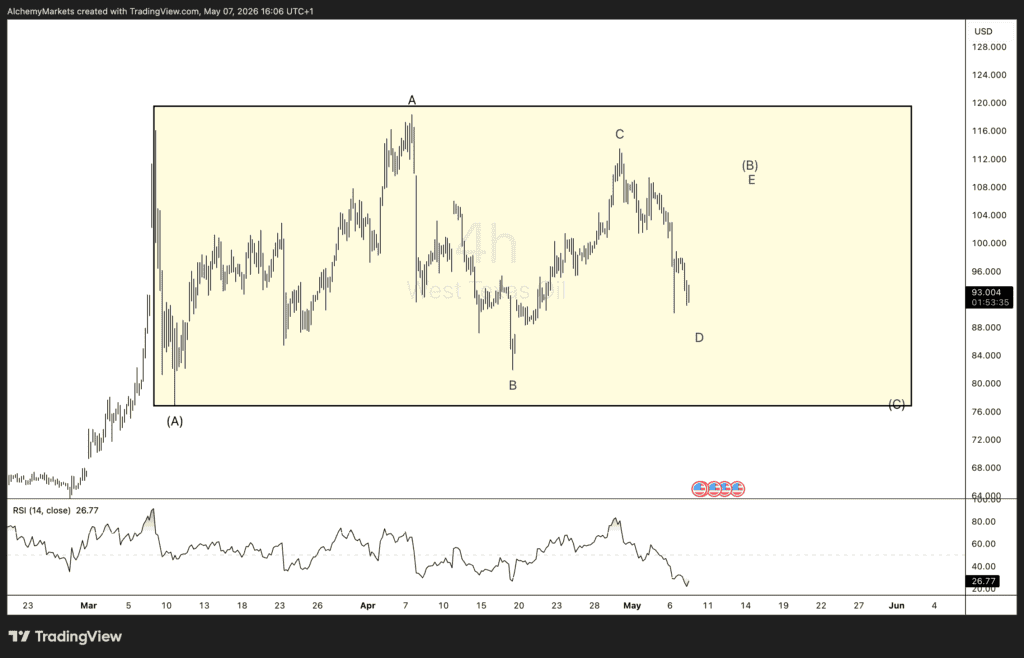
The alternative interpretation is that oil may simply be transitioning into a broader sideways corrective structure rather than preparing for an immediate breakout.
Under this scenario, the recent highs and lows could form part of a larger flat correction, where price continues chopping within a wide range before establishing clearer direction.
This view gains credibility if:
A prolonged consolidation phase could keep WTI trapped between roughly $76 and $118 while traders wait for stronger fundamental catalysts.
The recent drop also broke short-term momentum structure, suggesting buyers may need time to rebuild positioning before any sustained trend continuation occurs.
For swing traders, this environment may favour range-trading strategies rather than aggressive breakout positioning until clearer confirmation develops.
US natural gas prices also remain weak, with Henry Hub hovering near $2.7/MMBtu.
Markets continue to be pressured by:
The market currently expects another sizeable storage build in the upcoming EIA release, reinforcing the bearish near-term outlook for gas prices.
Energy markets remain highly reactive to geopolitical headlines, and the next move in crude oil could depend heavily on developments surrounding US-Iran negotiations.
For now, traders are balancing two competing narratives:
From a chart perspective, WTI sits at an important technical crossroads. Whether this resolves into a bullish Elliott Wave triangle breakout or a prolonged sideways flat correction will likely shape trading conditions over the coming weeks.
As always in volatile commodity markets, confirmation matters more than prediction.
Alchemy Markets is a multi-asset brokerage providing retail traders with the same elite trading conditions, tools, and transparency typically reserved for institutions.
Select the categories and companies you wish to follow directly to your person rss feed.
Create Custom RSS Feed
just now
Sign up and join over 5,000 professional members who receive personalized news alerts, curated professional connections, and more for free!
Retail futures trading leader NinjaTrader Group has appointed Mark Omens as Senior Vice President, Commercial Strategy, bringing a 25-year veteran of derivatives marketplace CME Group into a newly created role focused on exchange partnerships and enterprise growth.
Gold Price Action Forecast: Will XAU/USD Drop to $3930? Meta Description: Read our Gold price action forecast to see if XAU/USD will drop to $3930.
BitDelta Securities Financial Services LLC (“BitDelta Securities”) today announced that it has received full regulatory approval from the Capital Market Authority (“CMA”) of the United Arab Emirates under the Category 5 — Arrangement and Advice license framework (License No. 20200000439). The approval follows the firm's receipt of In-Principal Approval earlier this year and represents the successful conclusion of the CMA's full licensing process, including the satisfaction of capital requirements, governance appointments, and operational setup.
Crypto.com has received a $400 million strategic investment from Citadel Securities, valuing the firm at $20 billion. It marks the first institutional funding round in the company's history, aimed at accelerating its expansion into tokenised securities, derivatives and other asset classes.
WTI’s pullback into $79–82 is the first major test of the bullish Elliott Wave count, with buyers targeting a renewed break above $85.

BitDelta Securities has secured a full CMA Category 5 licence in the UAE and opened a regulated office in Business Bay, Dubai. The firm operates as an introducing broker, connecting investors with licensed international brokers across multiple asset classes, with CEO Dr. Demetrios Zamboglou commenting on the milestone.
Index volatility is asleep while single stocks fight it out underneath, credit refuses to confirm the equity rally, and a bare macro calendar hands next week to oil.
Digital assets and FX brokerage GC Exchange FZE (GCEX) has appointed Mohammed A. Mulla as a Board Member of its Dubai-based entity, part of the wider GCEX Group.
Learn what Blockchain-as-a-Service is, how it works, and why businesses are using BaaS to build blockchain applications without managing infrastructure.
CFDs vs stocks compared on leverage, ownership, costs, dividends, taxes, and risk. Learn the differences between stocks and CFDs and discover which suits your investing or trading goals.