10-Qs are filled with numbers. Going through them and seeing how they relate to one another takes time and effort.
What would you make out of the numbers in the table below?
| Net Income | Operating Income |
|---|---|
77 | 11 |
149 | 113 |
136 | 105 |
106 | 81 |
97 | 66 |
73 | 40 |
28 | 10 |
19 | 4.1 |
33 | -18 |
-124 | -62 |
-179 | -42 |
-101 | -39 |
-156 | -59 |
-102 | -91 |
-138 | -146 |
-123 | -114 |
-148 | -156 |
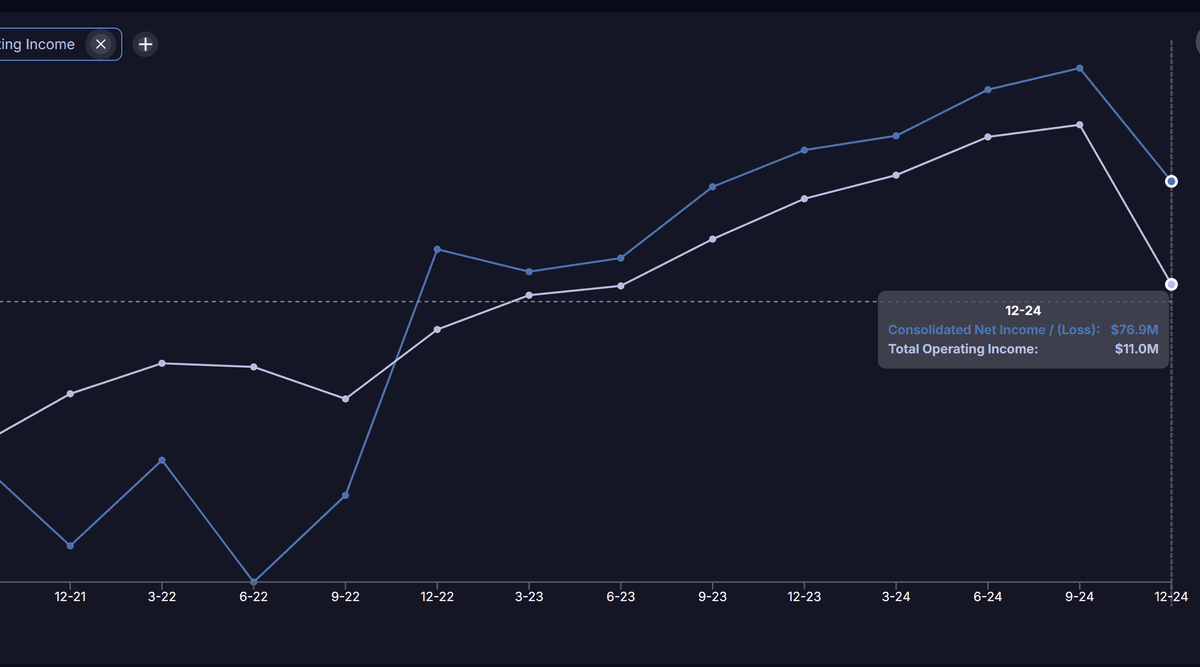
Visualization tools provides an instant understanding.
The understanding jumps after seeing the numbers above in one graph - Since turning profitable, the Net Income is higher than Operating Income… makes on wonder…
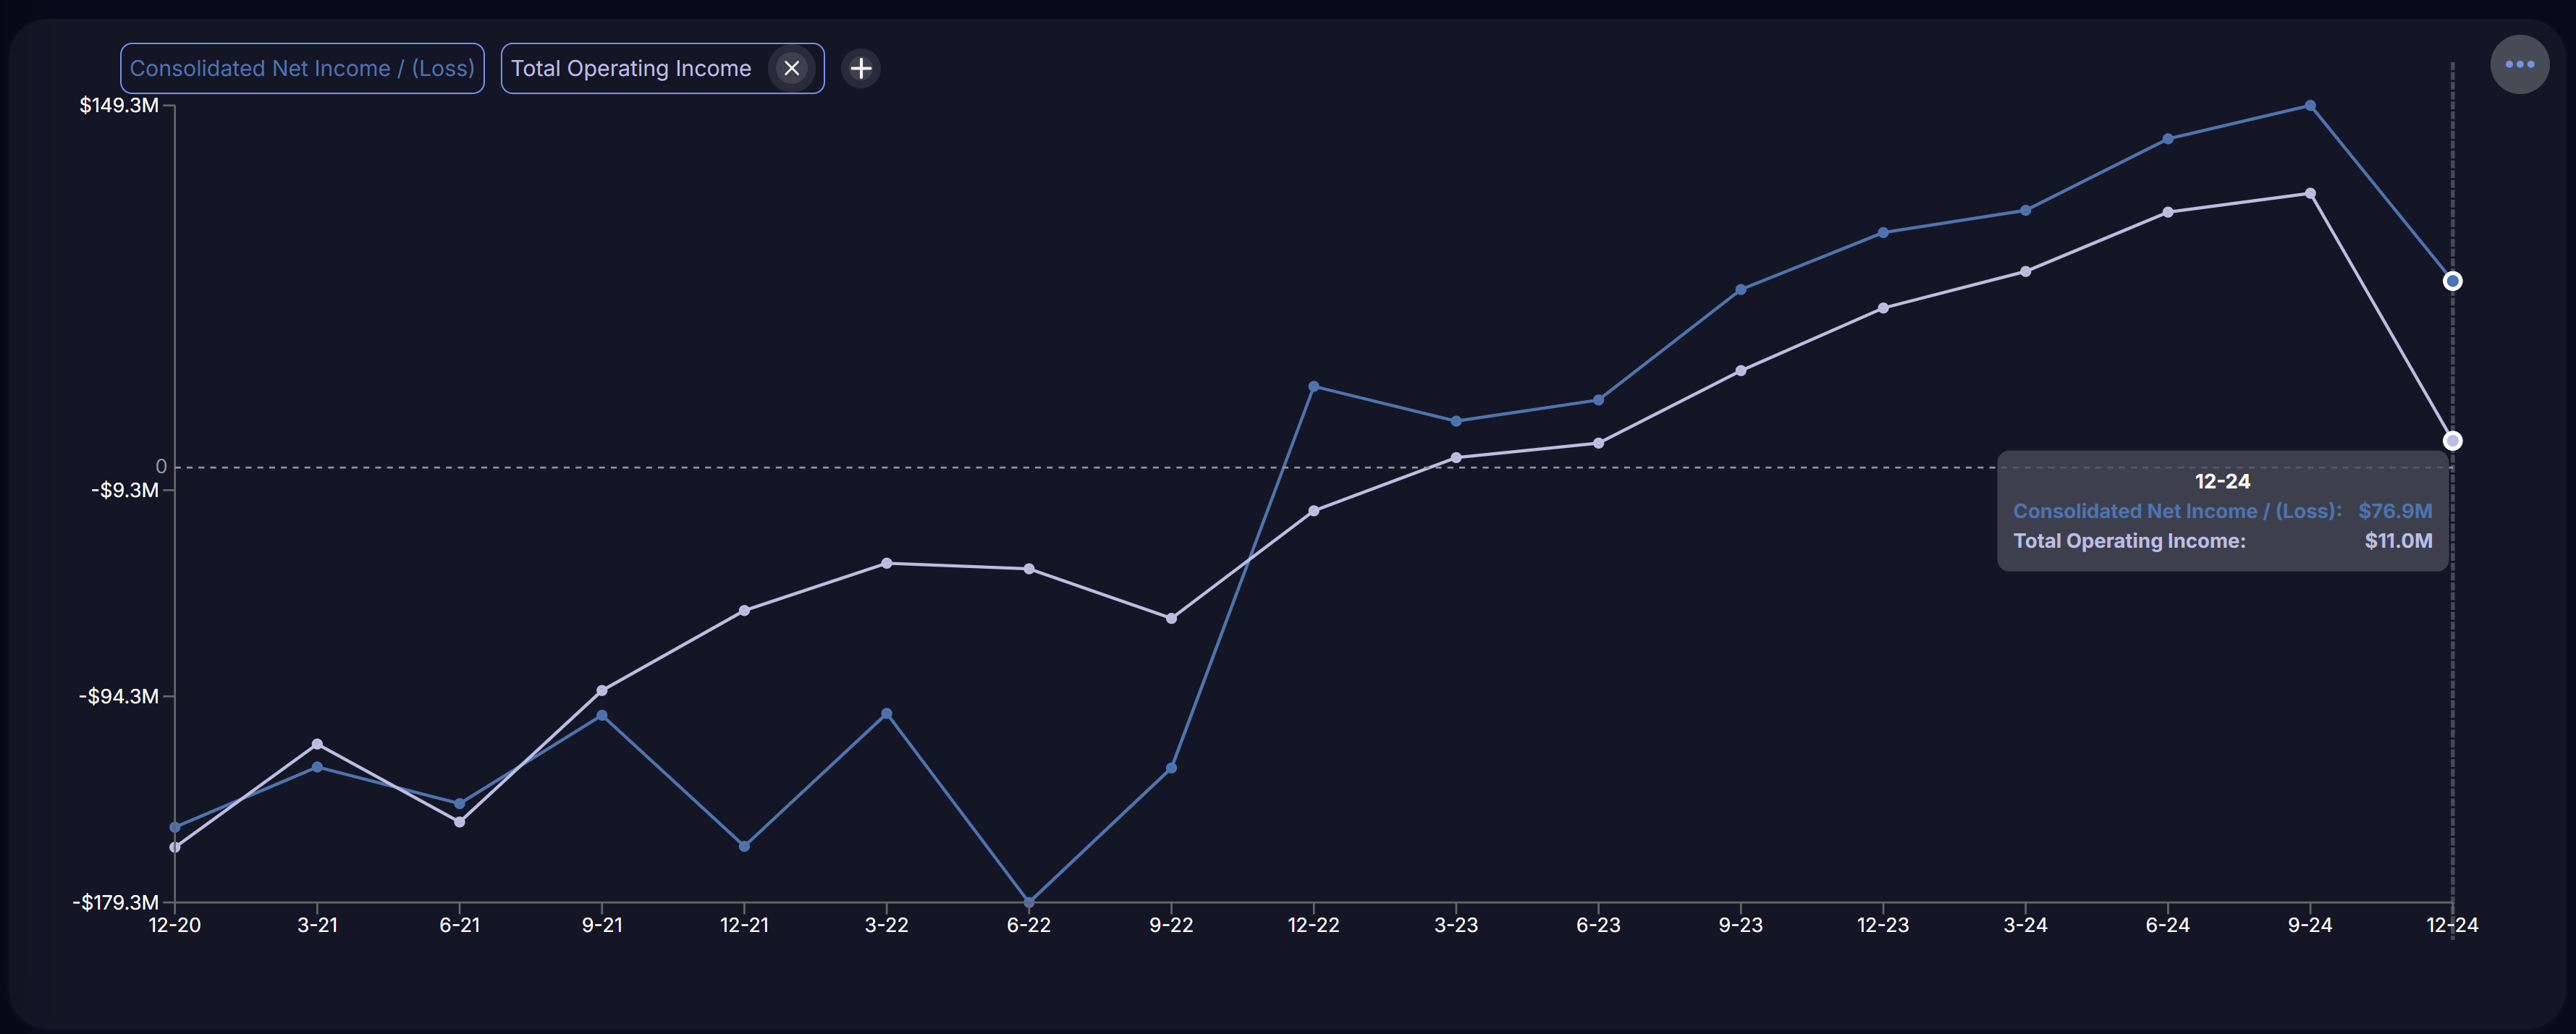
Create your own graphs dashboard to your stock of interest, start with seeing the above graph here - https://bigger-fish.com/research?ticker=PLTR&income_statement=netincome&fromQuarter=12-20&chart_netincome=netincome%2Ctotaloperatingincome
(only US companies for now),