
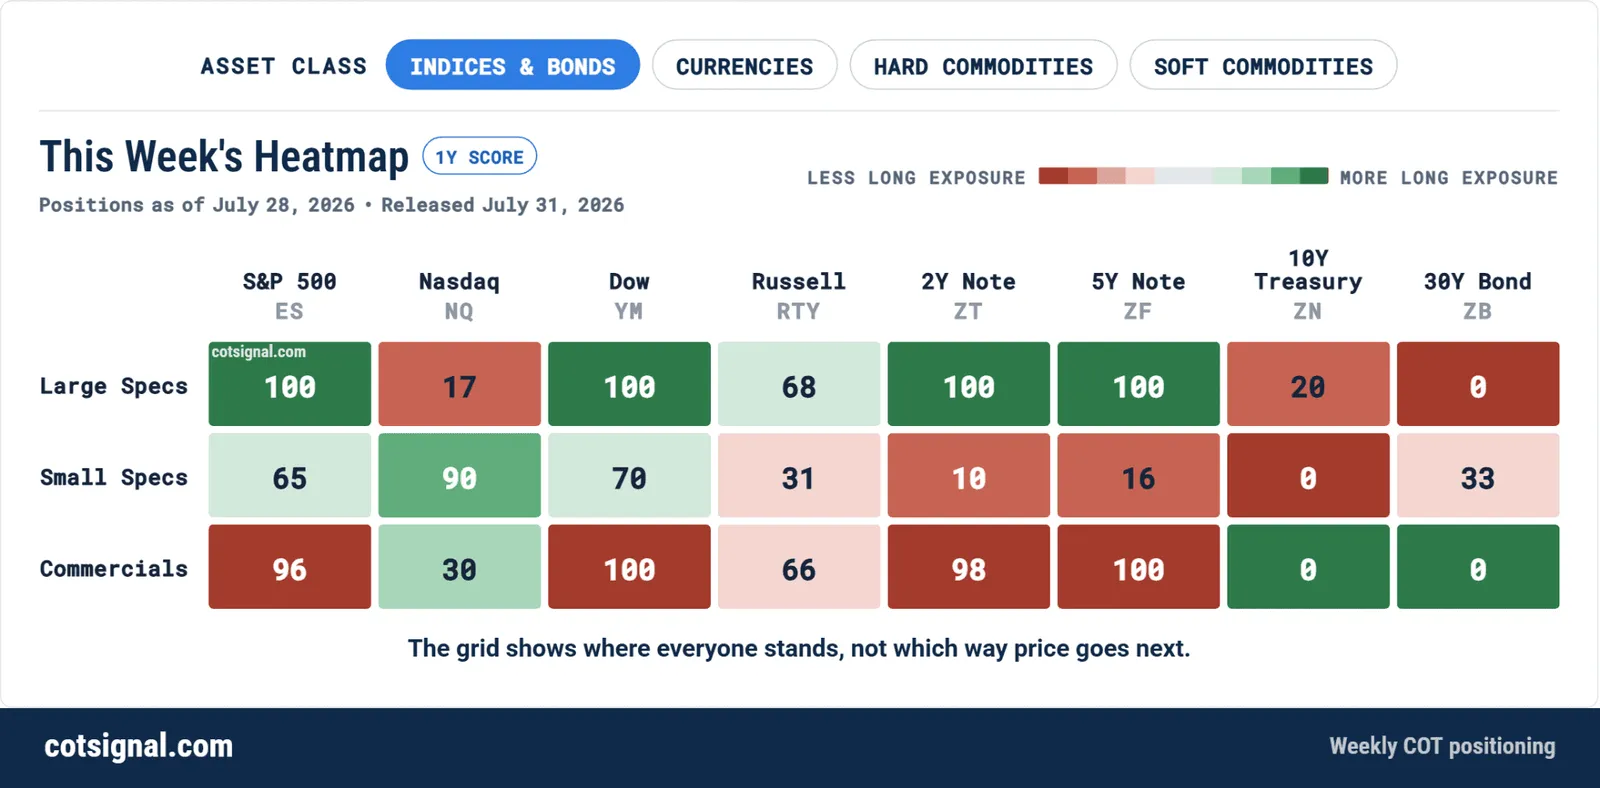
According to COT data released on 31 July, large specs (short for speculative traders) are heavily long 2-year and 5-year Treasury futures.
Large specs are professional market participants such as hedge funds, commodity trading advisers and other large money managers. Their positions are tracked because they can offer a useful view of how bigger traders are leaning.
By going long Treasury futures, these big players are positioning for note prices to rise. Since note prices and yields move in opposite directions, which tells me that they are leaning towards lower 2-year and 5-year yields.
These are historically great conditions for Gold and Silver.
Earlier this year, one of the biggest pressures on the metals was the fear that sticky inflation would force the Fed to stay hawkish. Short-term yields pushed higher, and gold began losing momentum.
But now, the script may be flipping.
Take a look at the chart below. It compares gold with the 2-year minus 30-year Treasury yield spread.
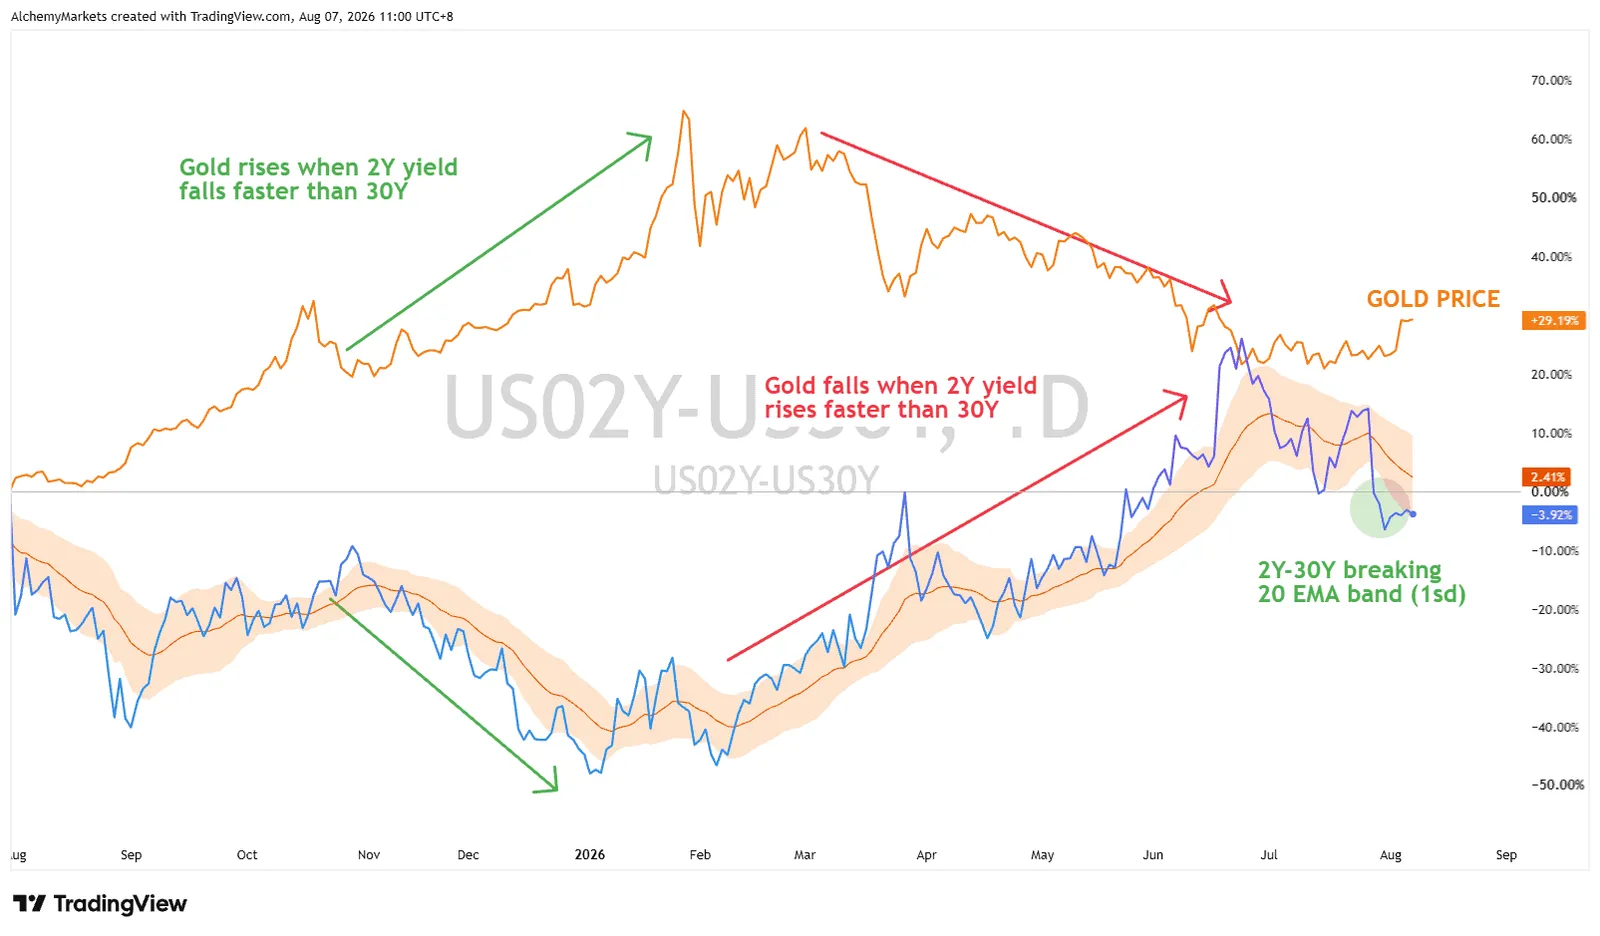
The blue line shows how the 2-year yield is moving against the 30-year yield. When the line trends higher, the 2-year yield is rising faster, or falling more slowly, than the 30-year yield.
That usually points to stronger pressure from near-term Fed policy. Gold tends to struggle during those periods.
But notice how we may have just flipped into the reverse situation, where US02Y is losing value faster than US30Y.
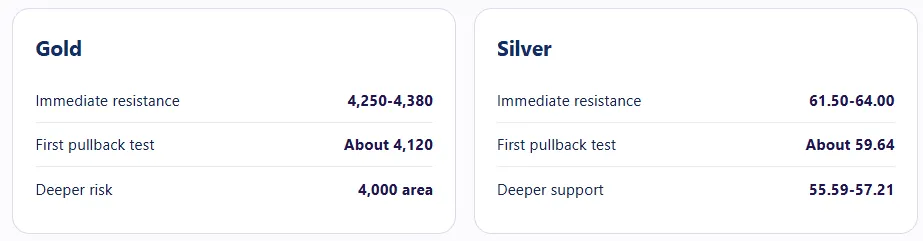
This isn't an immediate reversal signal, but it does indicate that conditions for Gold & Silver is potentially shifting from suppressive, to supportive.
Read more on alchemymarkets.com for Silver and Gold chart price level breakdowns