
The same weaker-dollar backdrop is producing two different-looking charts.
GBPUSD has closed above its descending trendline, while EURUSD is still capped beneath its own. EURGBP has also broken below its recent range, giving the clearest cross-market signal that GBP is currently outperforming EUR.
US CPI now decides how that relative-strength view is best expressed. UK GDP then tests whether sterling can keep the advantage on its own fundamentals.
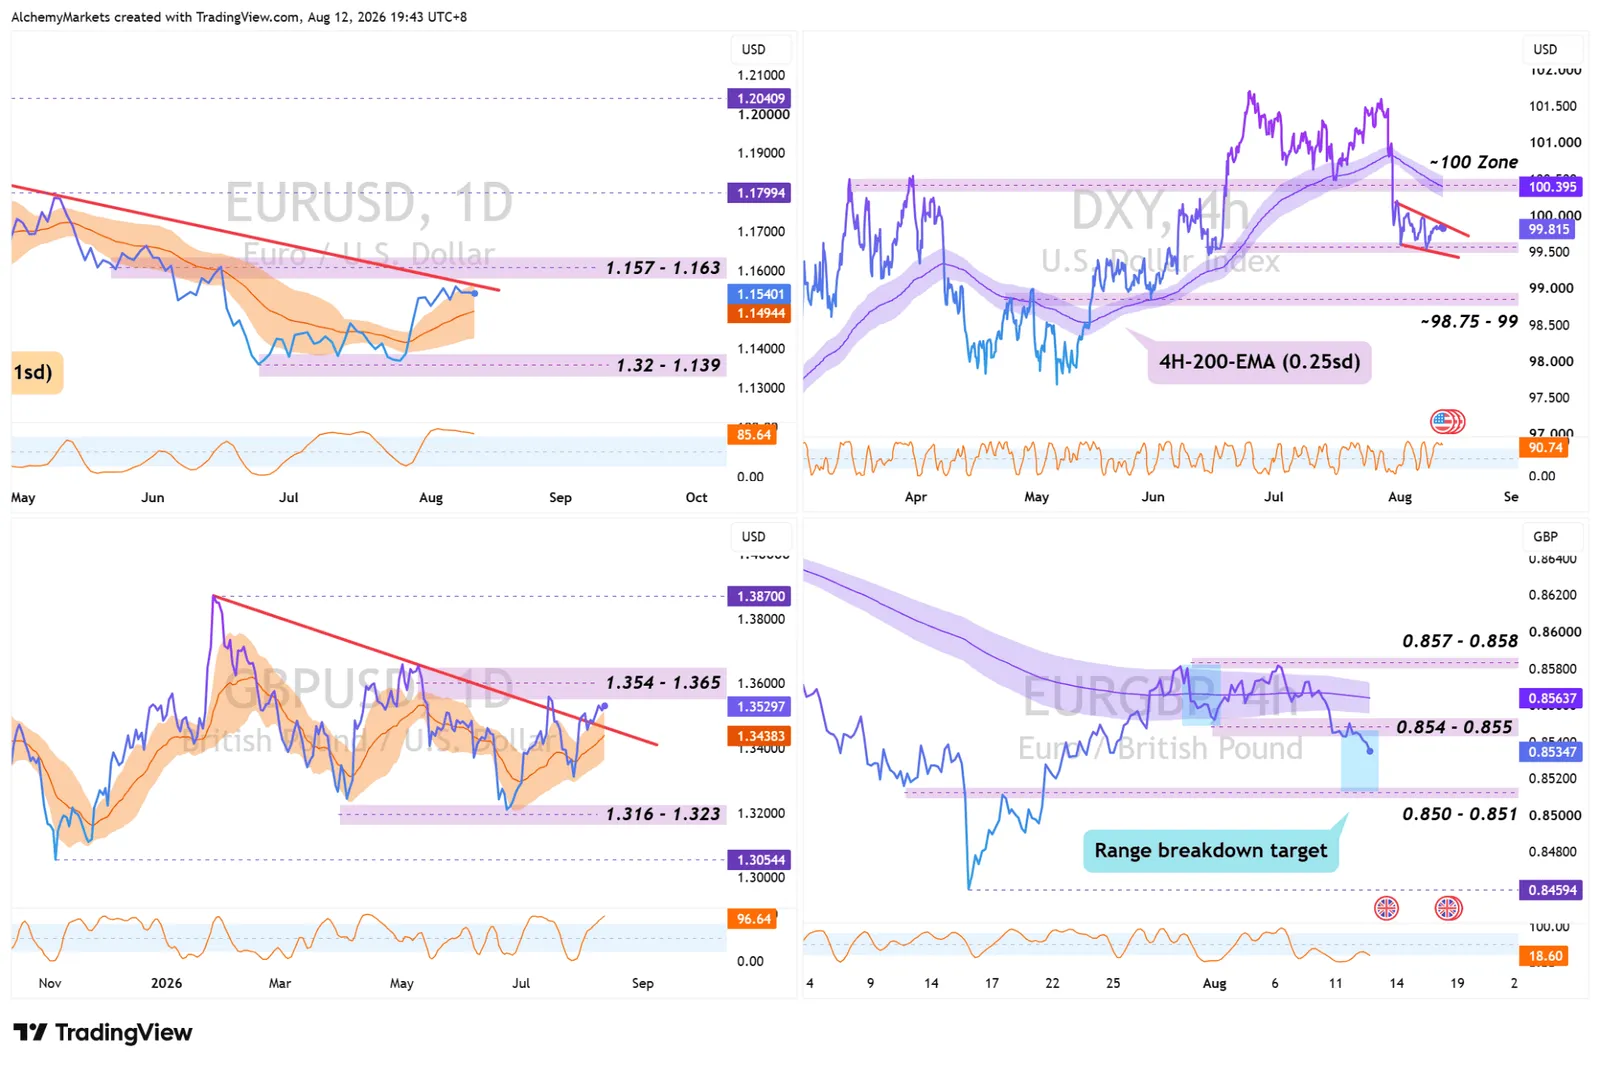
GBPUSD Has the Cleaner Breakout
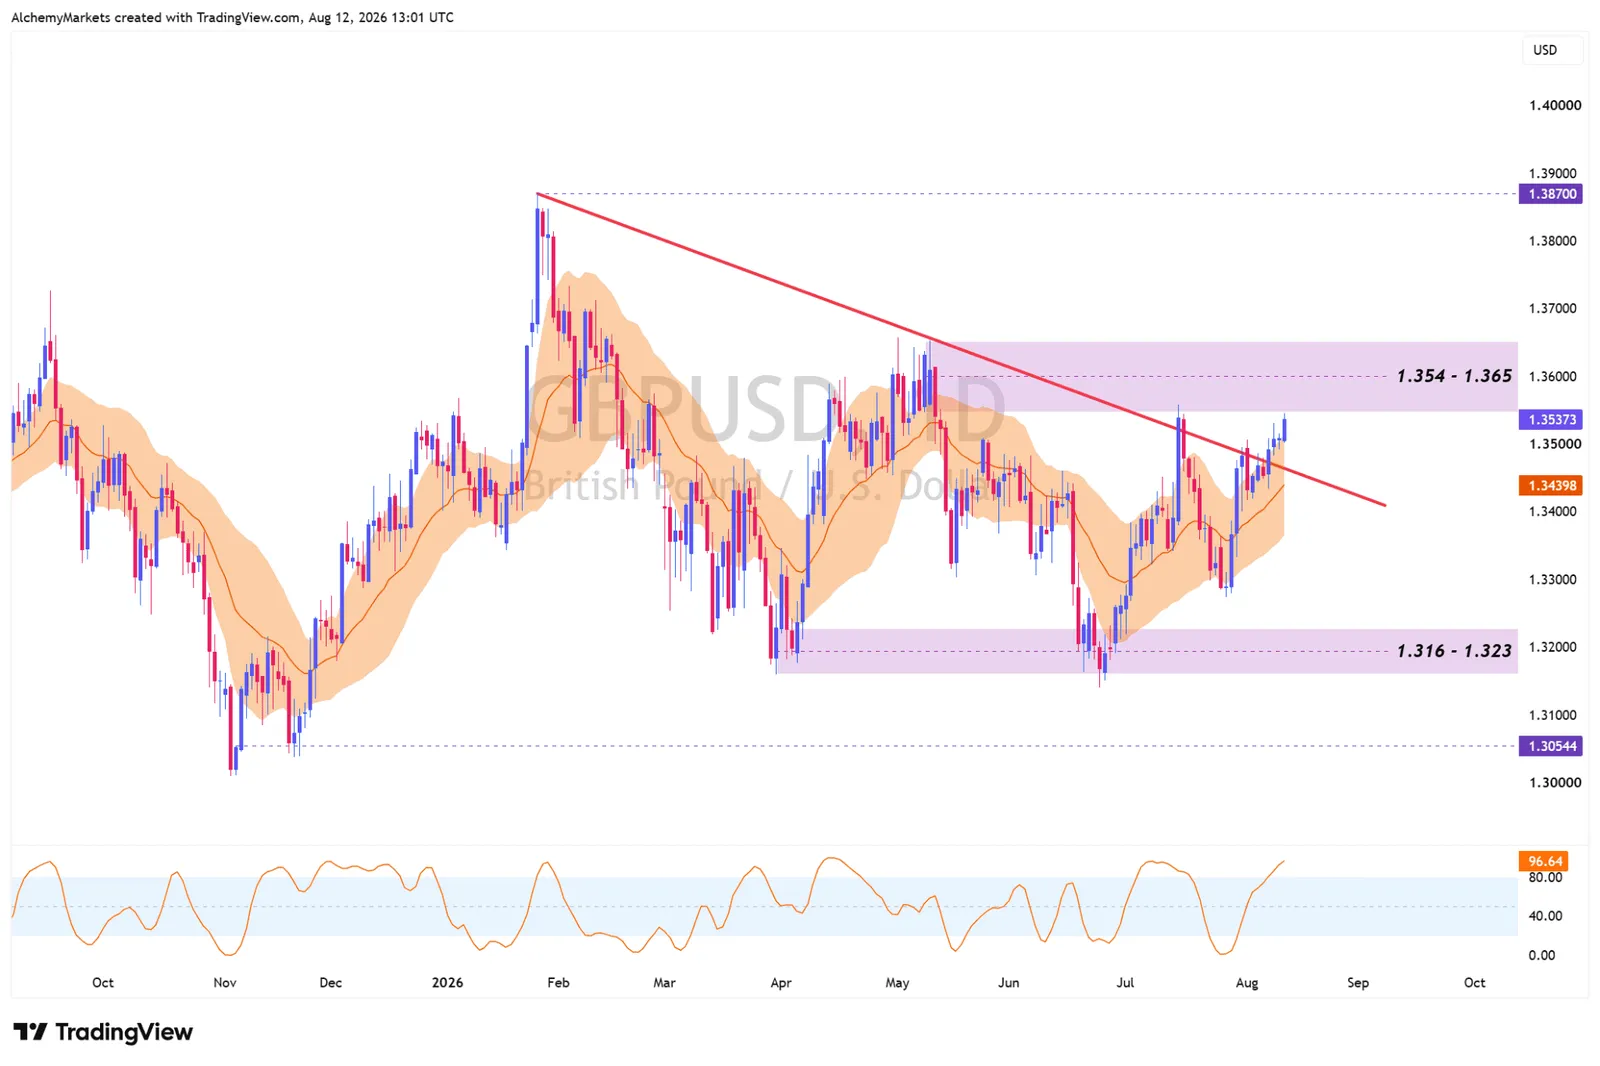
Both GBPUSD and EURUSD are trading above their daily 20-EMA one-standard-deviation bands. Under this band logic, a break above the envelope shows bullish momentum, while a retracement into the band should initially be treated as a support zone until price decisively breaks through it.
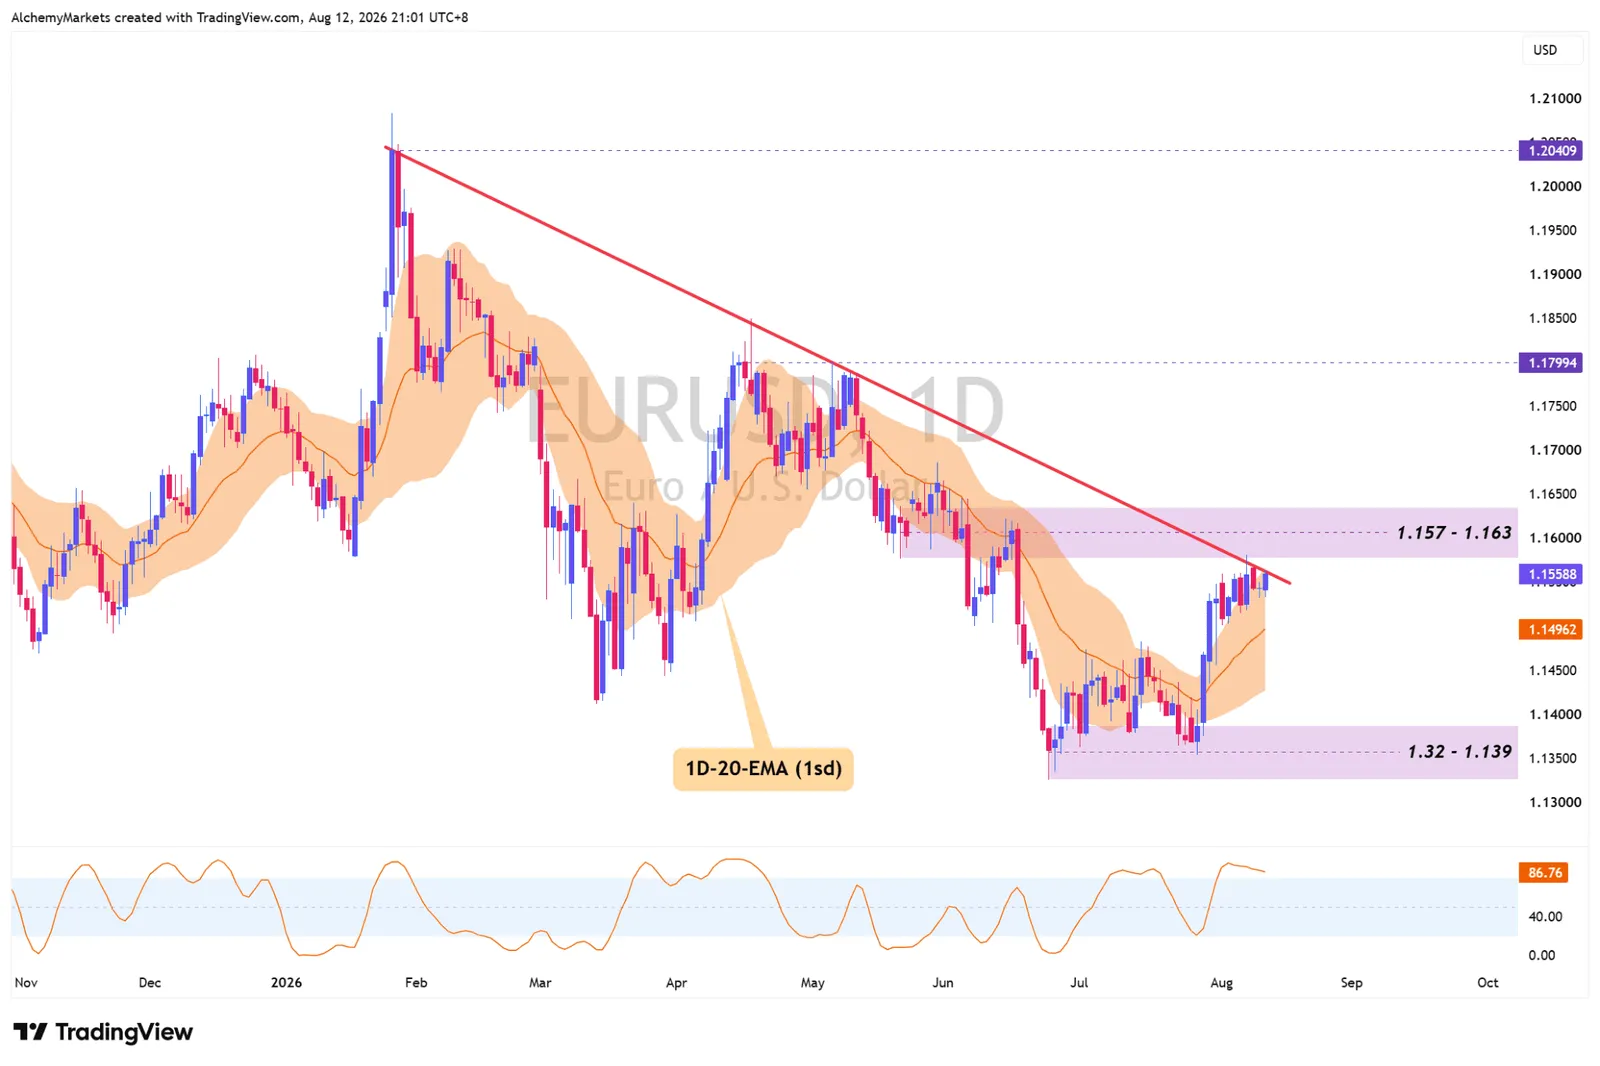
The difference is the larger structure. GBPUSD has already closed above its downtrend and could retest that broken trendline or EMA band before trying higher, while EURUSD is still pressing into its own downtrend.
GBPUSD is not a clean chase here.
Price is approaching 1.354-1.365 resistance and daily Stochastic RSI is near 97, so a pullback or consolidation would be normal rather than automatically bearish.
EURGBP Is the Better Relative-Strength Confirmation
EURGBP is more direct because it removes the dollar from the equation. The pair has broken beneath 0.854-0.855 support and its 4H 200-EMA band after spending late July and early August inside a narrow range.