
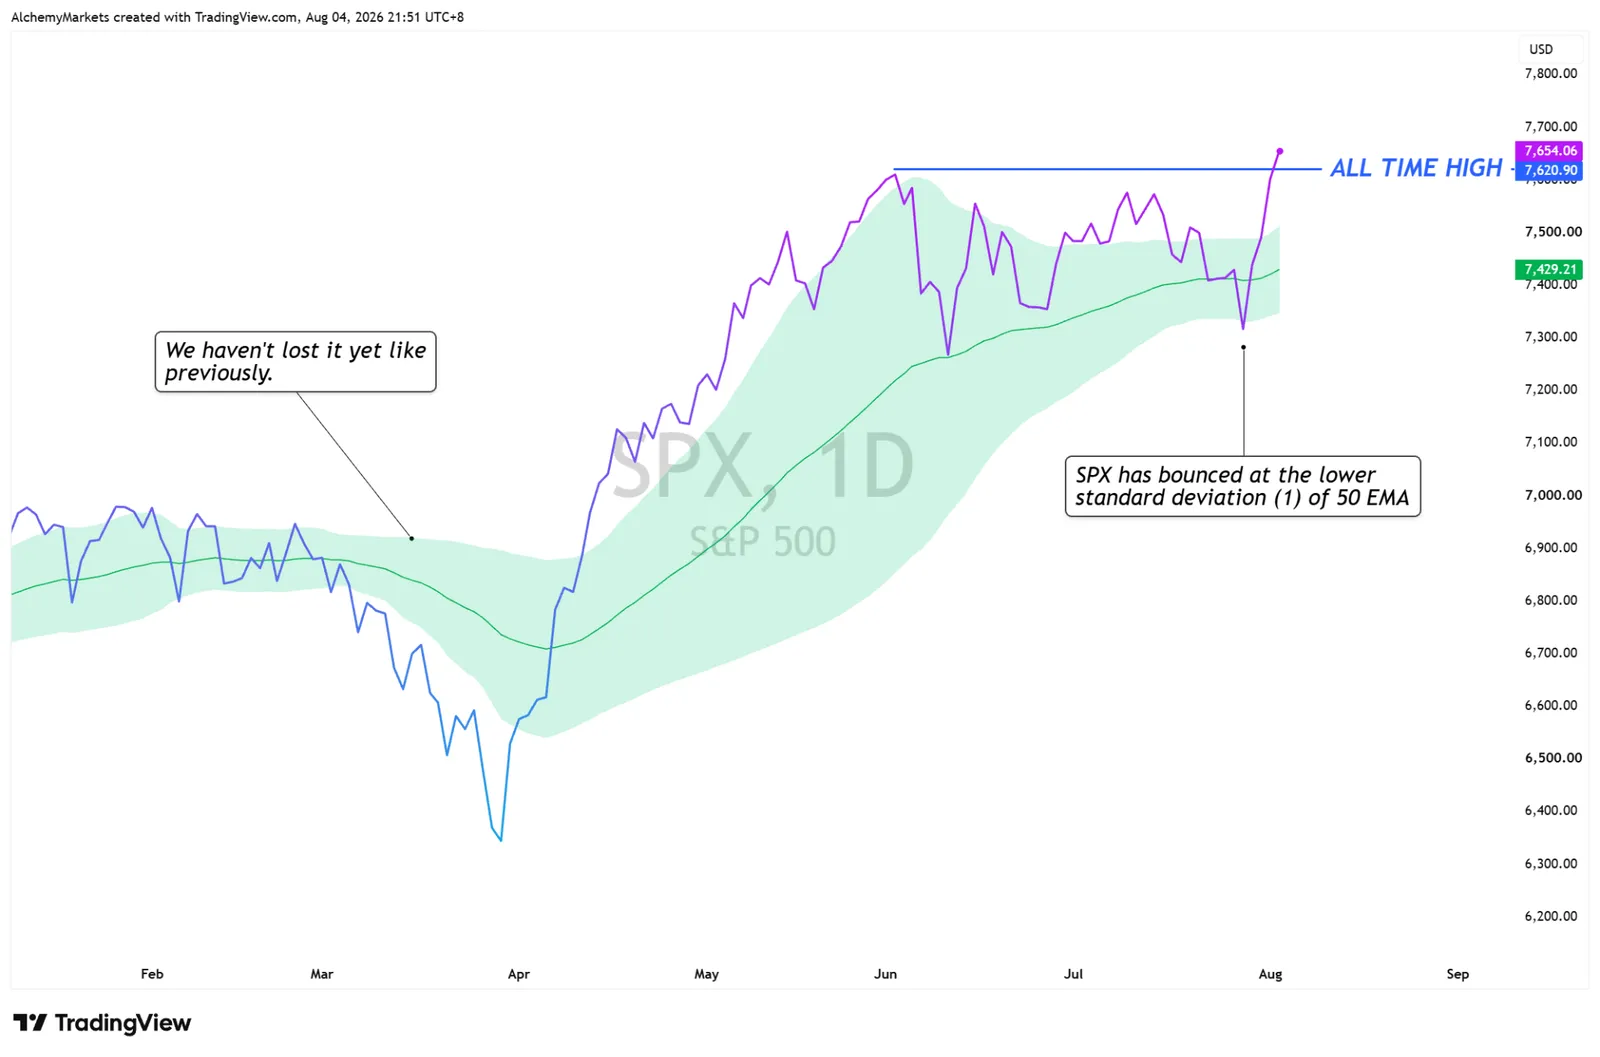
from its June high, while the S&P 500 remained close to record levels and has now briefly pushed to a fresh high.
The latest charts point to a support test rather than a confirmed global unwind.
USDJPY, AUDJPY and GBPJPY are all testing their daily 200 EMA bands, while the Nikkei is holding around its previous low and daily 100 EMA band.
Why Japan sold off while US stocks held up
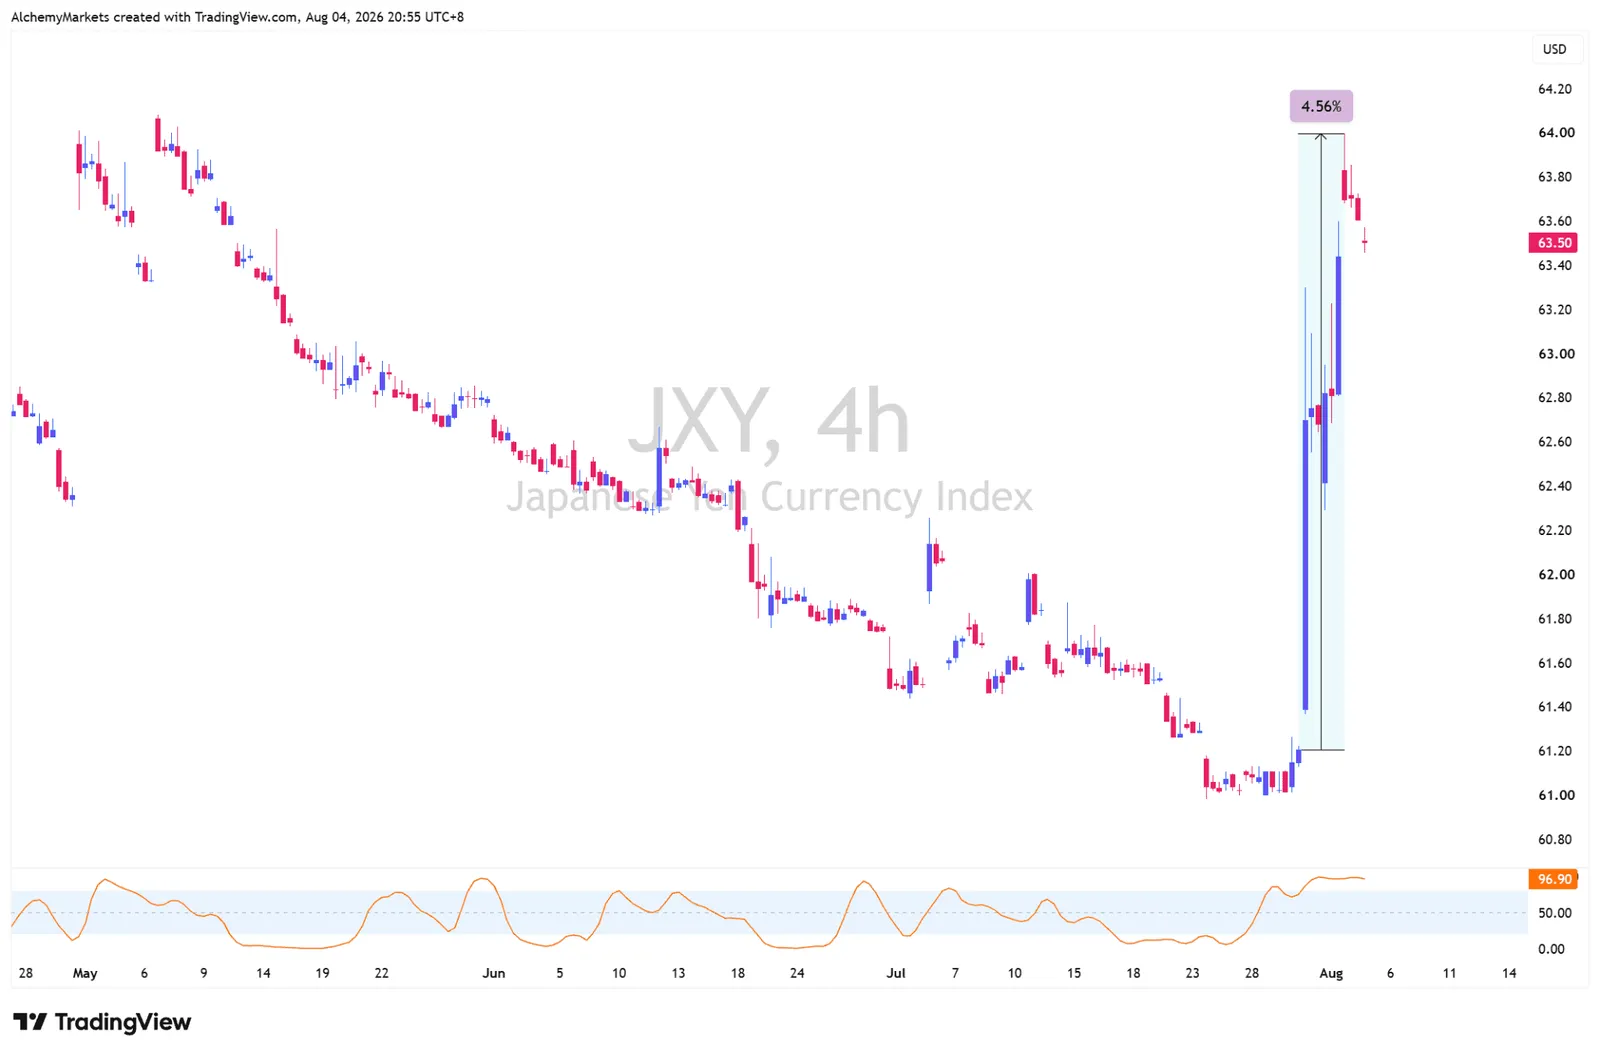
Following the intervention, the yen strengthened by roughly 4.5% from Thursday’s low. That created an immediate headwind for Japanese exporters because overseas earnings become less valuable when converted back into yen.
A stronger yen can also reduce the appeal of yen-funded carry trades. However, the S&P 500 has so far treated the move as a Japan-specific shock, helped by a softer US dollar and continued demand for US equities.
USDJPY is sitting on the main decision zone
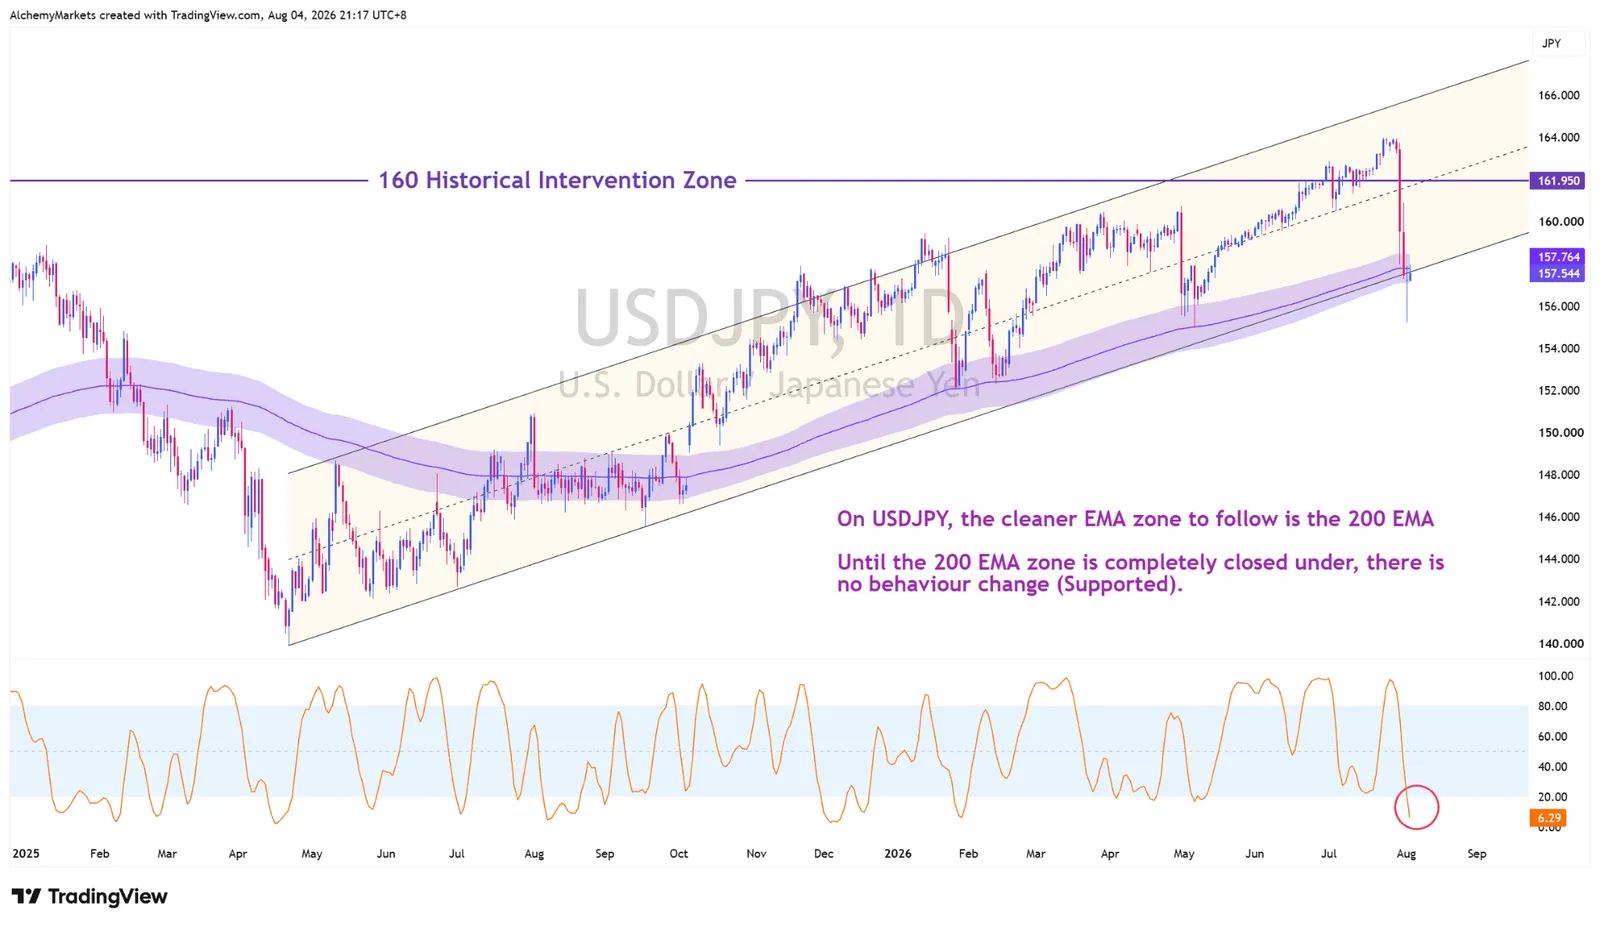
USDJPY is testing the daily 200 EMA band, which also sits close to the lower edge of its rising channel.
Daily stochastic RSI is also flashing oversold, so a pause or rebound from this area would be normal.
A daily close beneath the band would matter more. It would combine a loss of dynamic support with a channel break, raising the risk that the move has shifted from intervention shock to a broader trend change.
AUDJPY and GBPJPY Are Also Flashing Bounce Signals
Just like the USDJPY, the AUDJPY and Dragon pair are both sitting at their 200 EMA supports with oversold signals.
AUDJPY, the risk on sentiment proxy, is the useful risk gauge because both sides of the pair can weaken during a sell-off. It is testing the daily 200 EMA band and remains oversold.