Understanding daily market cycles is crucial for traders, and by integrating Candlestick Pattern Analysis with the Smart Money Concepts (SMC) strategy, traders can pinpoint high-probability setups driven by institutional order flow and liquidity manipulation.
The Daily Chart is a significant element that we could refer to in navigating our trade decisions during the day. This is mostly relevant to those who are trading the markets on daily basis. Don’t worry, we will also have a segment that covers a much higher timeframe in analyzing the Weekly Candle Stick Anatomy and determining the Weekly Market Cycles.
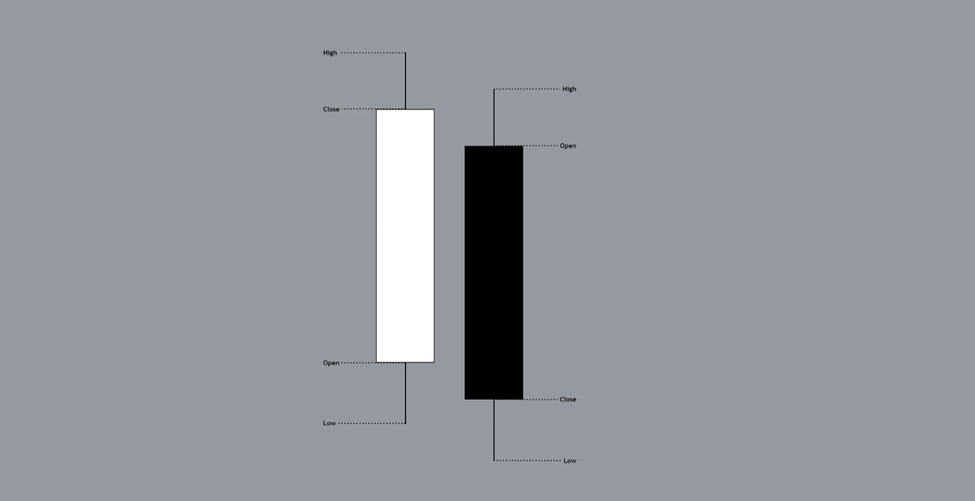
A candle stick usually composes of what we call the “OHLC” or Open High Low Close. These 4 are not just there to tell us where price open, how high and low price reached during the day and where it closed. There’s something more beyond that. We could analyze the market cycles during the day by just checking out the OHLC.
The market composes of 3 cycles:
- Accumulation
- Manipulation
- Distribution
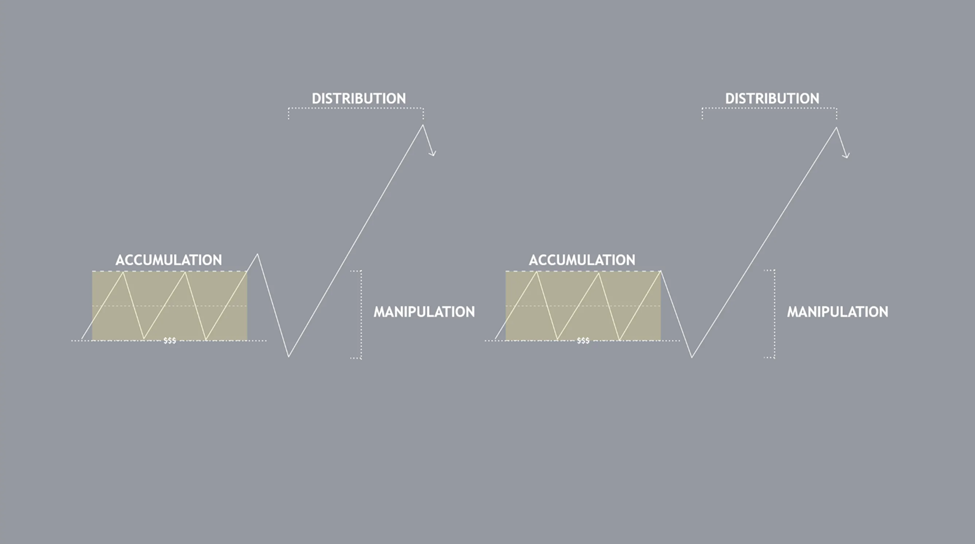
This cycles can be observed during the day at a specific time period. It does not happen all the time at those periods but once opportunity presents itself with these cycles, you could reap a handsome profit.
1. Accumulation - Usually happens near the Opening Price
- Volume usually accumulates during the Asian Session from the Open up to 00:00 New York.
- It also makes sense that the market is accumulating this time since volume is not high due to the 2 major markets, European and US market, are still close.
2. Manipulation - Usually happens near the Opening Price, and suspected Low/High of the Day
- Usually occurs during the London session.
- Either price breaks out to the upside if long, then goes to the lows then goes back up again the breakout level or;
- Price does not break out of the range but goes the opposite of the on-going higher timeframe direction, taking out the lows, if bullish, then goes up, creating a fakeout on the lows as shown above.
3. Distribution - Usually happens in the middle of the day until Closing near the Potential Low/High of the Day
- Momentum can happen from London until the US session.
- After taking the stops/liquidity at or below the opening, price now has the ability or power to go up since it now has volume.
- Levels where there’s a buying interest like previous day highs and lows, old highs and old lows.
This can also be referred to as the AMD Concept or the more familiar term, the Power of 3.
Before utilizing and taking advantage of this concept, there must be a premise or a bias in the higher timeframes, particularly the Daily timeframe.
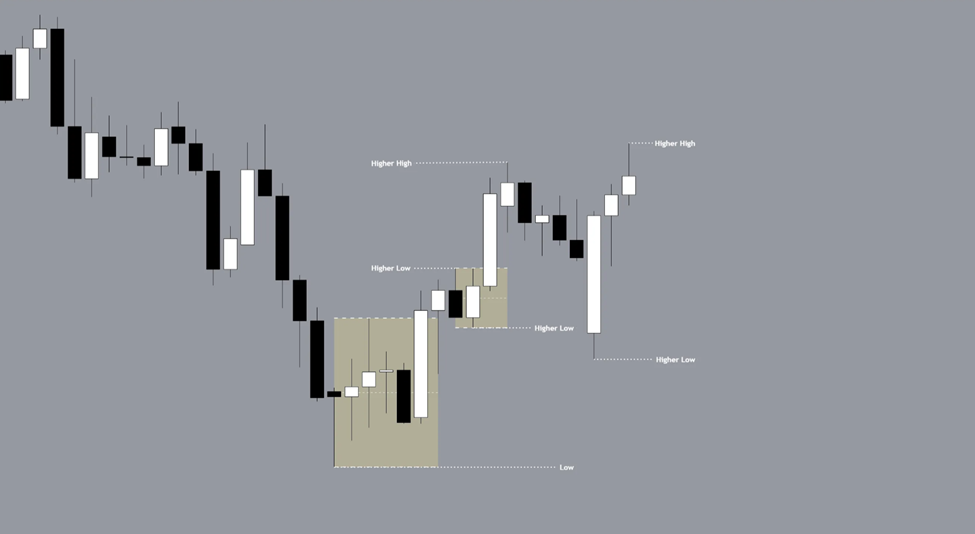
In this situation, we are seeing a bullish sequence by creating higher highs and lows. The premise of our AMD is bullish and we can look for bullish opportunities, intraday.
Timeframes that we can use in the lower timeframes is the H1 or M15 Timeframe as our Higher Timeframe inside the Daily candle.
In the H1 timeframe, we can see an obvious accumulation during the Asian session that we can refer to. At this point, its best that we wait for price to do something first either the support or the resistance line as we don’t want to enter yet since there’s still no manipulation.
What’s the idea behind the Manipulation phase and why are we anticipating it?

We need to understand that:
- We are not the only players in the market.
- There are bigger entities present in the market that have cutting-edge technologies to manipulate the market.
This was the playground of the big boys until the markets became public, available, and accessible to anyone Post-1970.
Since there are other entities present in the market, entities with big pockets, we’d like to play around with their footprints.
These footprints can be found during the Manipulation phase.
Where do we look for these concepts intraday?
Accumulation
This happens during the Asian session where we are in a sideways move.
This happens because institutions are engineering liquidity. It allows orders to accumulate wherein there are both stops above and below that range.
The accumulation range we look for is until 12:00NN PHT or 00:00 New York Time.
Reasons Why 00:00 New York Time Matters for Institutional Algos:
- Daily Trading Session Reset:
- Institutional trading desks and algorithms often align with midnight ET for the start of a new trading day as it's considered the "server time" for many financial markets.
- Price data aggregation (daily candlestick open, high, low, close) resets at this time, creating technical reference points.
- Global Market Overlap:
- Midnight ET coincides with early trading hours in Asian markets (Tokyo) and post-market activity in Australia, making it a natural point for liquidity adjustments.
- Algos often rebalance based on cross-border market flows and time-sensitive data releases.
- Portfolio and Risk Management:
- Large financial institutions may rebalance or adjust positions based on end-of-day analytics, which are finalized by midnight ET.
- Hedge funds and asset managers often run reallocation strategies after market-close analytics, typically executed around this time.
- Liquidity Algorithms:
- Midnight ET serves as a liquidity recalibration time when market orders may be executed to balance books, offset positions, or manage carry trades in forex.
- Forex Market Dynamics:
- The forex market, being decentralized, uses 00:00 ET as the daily open for most platforms. This aligns with the new daily swap calculation period for various currencies.
- Manipulation
The support and resistance level is a key area that is very attractive where algos might take interest in since this is where most Stop Loss orders are place.
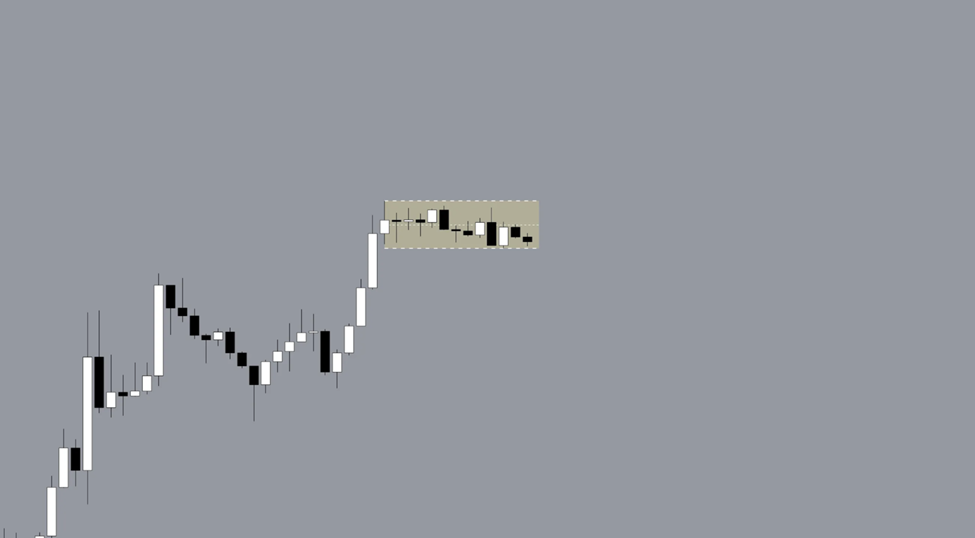
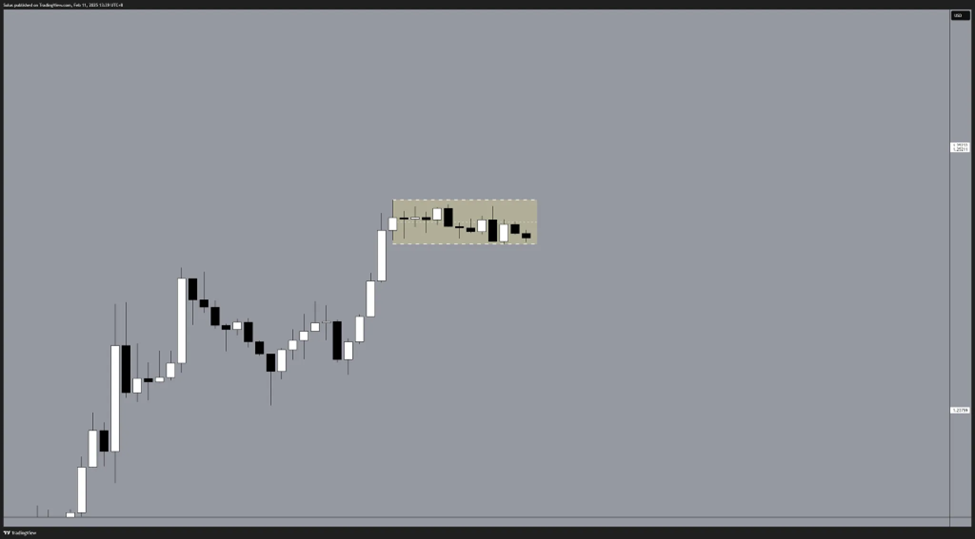
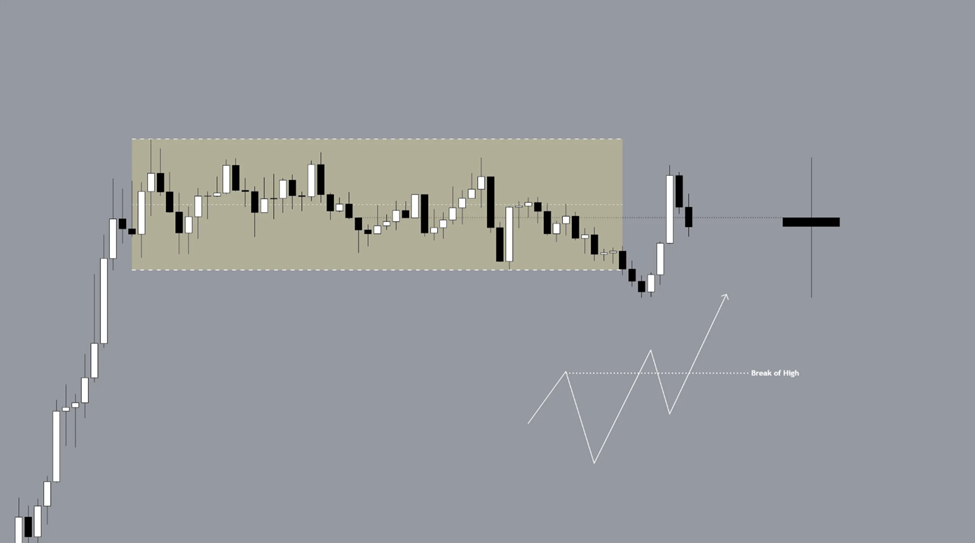
Going back to the example above, we can see an obvious range during the Asian session.
Since the other premise is that liquidity has now been engineered by making a range bound price action, we wait for the high or low to be taken out. We’d like price to do something with the high and low during the London session.
During this time, the look of the Daily candle here is bearish and we are below the opening price of the day where we are looking for an opportunity to go long.
The key here is to be patient and wait how price will react on the support and/or resistance level.
If we are looking for a bullish opportunity, we can anticipate either of these to happen in favor of the bullish side:
Price Breaks Out First
- Price breaks out then retraces inside the range but does not take out the low of the range.
- Price breaks out then goes below the lows and quickly goes up.
Price Breaks Down First
- Price breaks down but there’s no follow-through.
- Price breaks down but only wicks the lows then goes on the upside move.
Note that we are looking for a bullish opportunity on intraday since the premise of our daily chart is bullish but it doesn’t necessarily mean we won’t adjust to bearish if given the opportunity. Our methodology in approaching the market must not be rigid but we are to be flexible on what the market will show us.
There are still other scenarios like it will go on a long sideways or will finally breakdown. The key here is to wait and observe what price will do and how it will react at the SnR (Support and Resistance) levels before anything else.
- Distribution
This is the phase where want price to react at a certain level with a momentum.

We can go down the lower timeframes like M15 and M5 to see signs of momentum and reversal patterns.
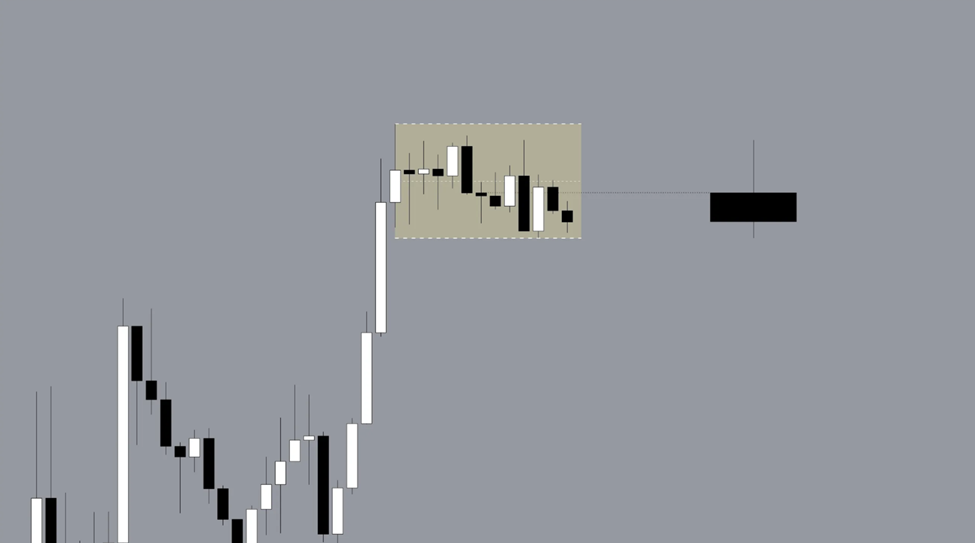
In this case, there’s significant move to the upside. Price have also broken the previous high for an upside potential.
If we are indeed bearish, we’d want price to have a bearish follow-through but in this case, we have not seen any significant bearish move.
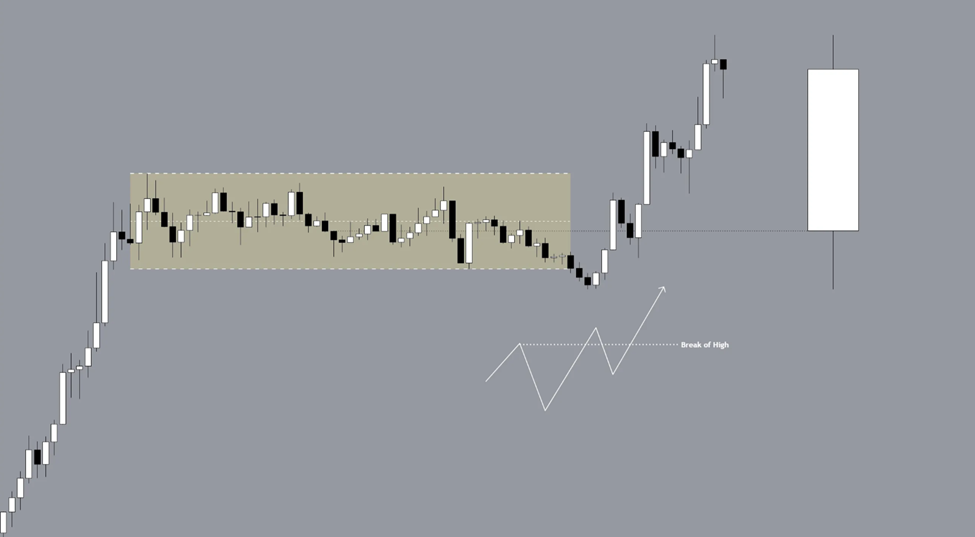
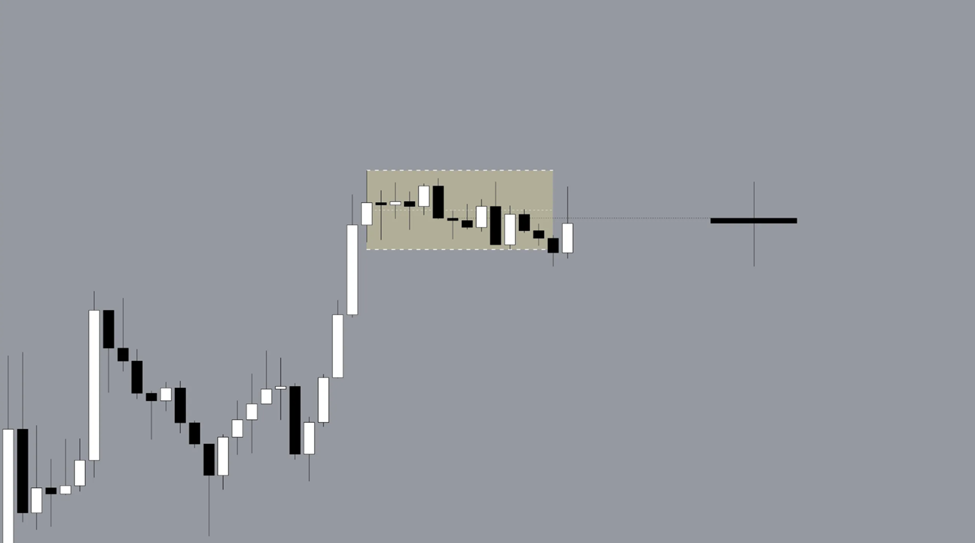
If all goes well, and price goes in our favor, this is what the Daily candle we are anticipating to build.
Note that there are times the market during Asian is still on distribution and London will be on accumulation and at New York, the manipulation will occur.
The cycles may vary depending on the catalysts like interest rates, and other significant red folder news.
Summary:
This content covers the daily candlestick structure and its significance in identifying market cycles for intraday trading. The concept is based on the AMD (Accumulation, Manipulation, Distribution) or Power of 3 framework, emphasizing a structured approach to navigating market phases.
Core Concepts
1. Daily Candlestick (OHLC Analysis)
The daily candlestick structure (Open, High, Low, Close) provides essential data to understand market behavior. Traders can interpret market cycles during the day using these points.
2. Market Cycles
- Accumulation: Typically occurs near the daily open during the Asian session when market volume is lower. Liquidity is engineered within a range.
- Manipulation: Often during the London session, price takes out key levels (highs/lows) before reversing, creating fakeouts.
- Distribution: Happens from London to the US session. Price moves with momentum after stops are taken, targeting key levels such as previous highs or lows.
Key Phases Breakdown
Accumulation (Asian Session - Until 00:00 New York Time)
- Institutional liquidity is built within a range.
- Both stops above and below the range are engineered for manipulation.
Manipulation (London Session)
- Price often breaks out or fakes out of the range.
- Look for liquidity sweeps or reversals at key support/resistance levels.
Two Possible Scenarios:
- Breakout First: Price retraces but doesn’t take out the low.
- Breakdown First: Price wicks the low and reverses upward.
Distribution (Midday to Close)
- Price reacts at key levels with momentum.
- Lower timeframes (M15/M5) can reveal signs of reversals or continuation patterns.
Approach for Trading the AMD Concept
- Wait for accumulation (sideways buildup) during the Asian session.
- Look for manipulation through liquidity sweeps during the London session.
- Enter trades on reversal patterns during manipulation.
- Follow the momentum in the distribution phase.
- Place stop-loss below reversal structures and set objective take-profits.