just now


Liquidity Finder Ltd is incorporated in England and Wales, company number 10610740, registered address 167-169 Great Portland Street, Fifth Floor, London W1W 5PF, United Kingdom.
Published: just now

Key Takeaways:
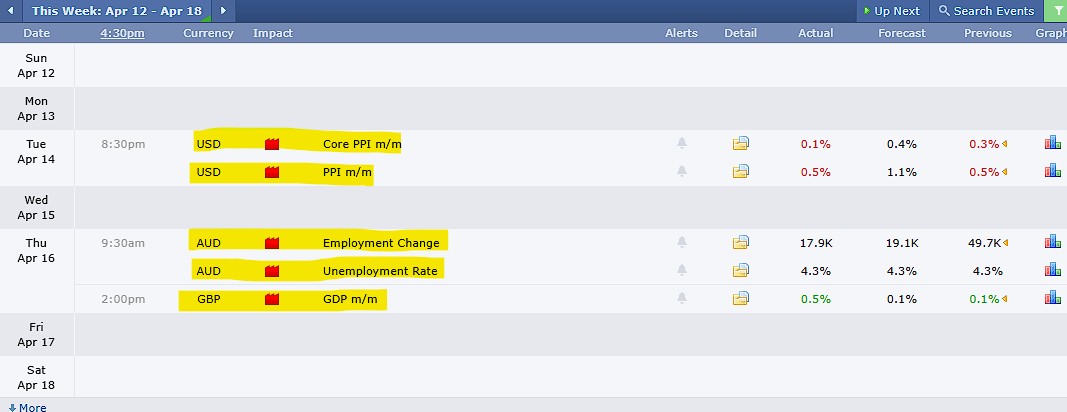
Overall, mixed data but risk sentiment supported CAD/JPY strength with temporary volatility in between.
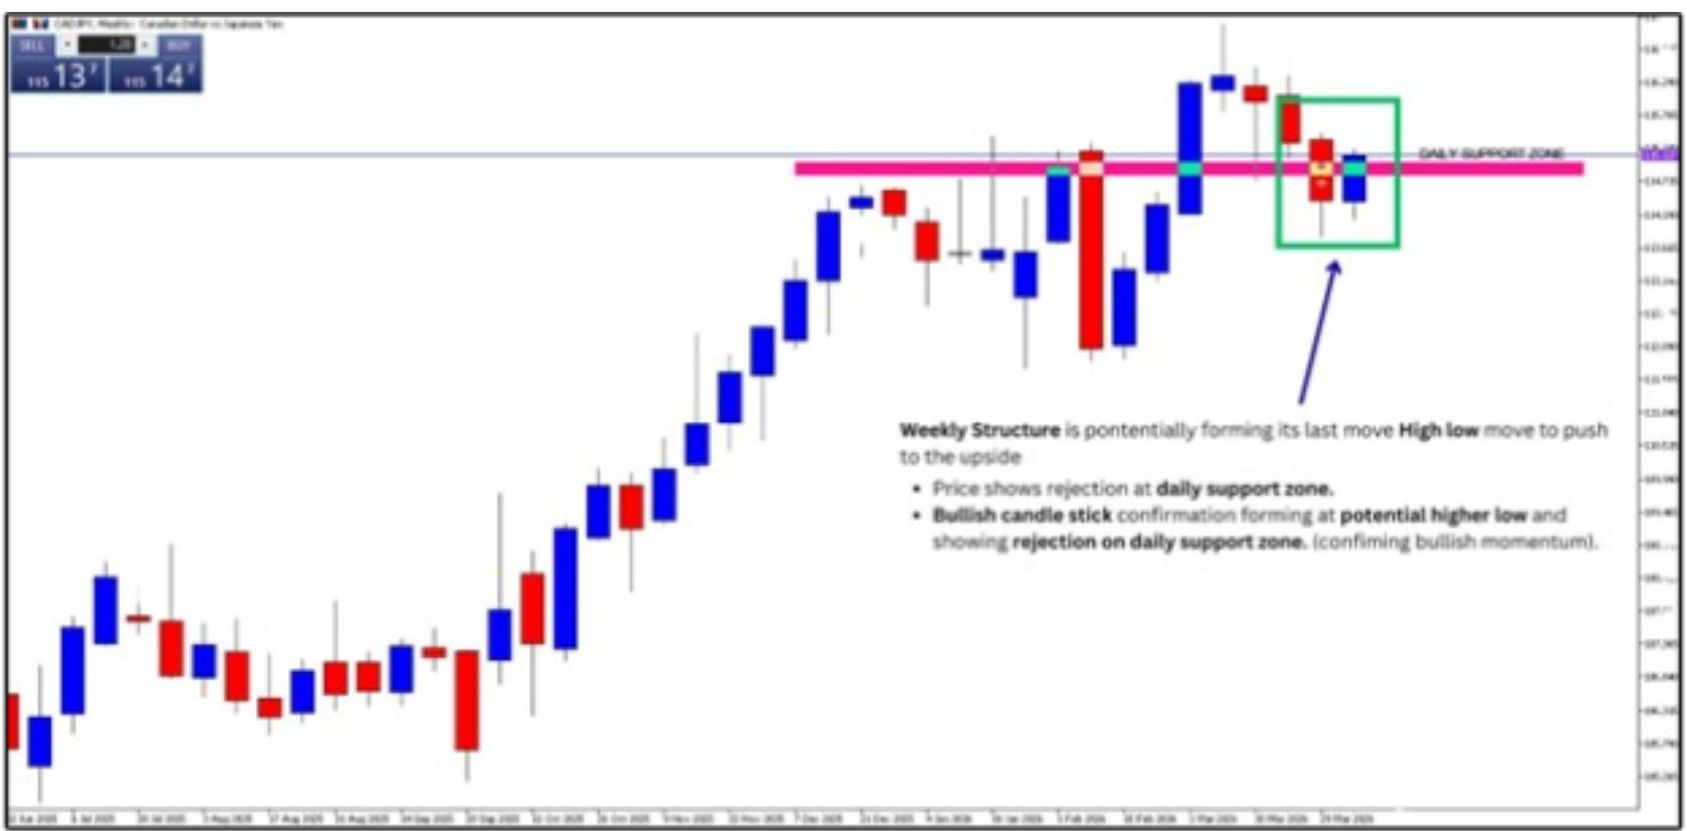
Looking back at the weekly chart reveals a strong and well-defined setup. In a previous blog post titled “Simple Price Action Trade on CAD/JPY: 115.000 the Key Floor for CAD/JPY” it was noted that the pair was forming a potential final higher low.
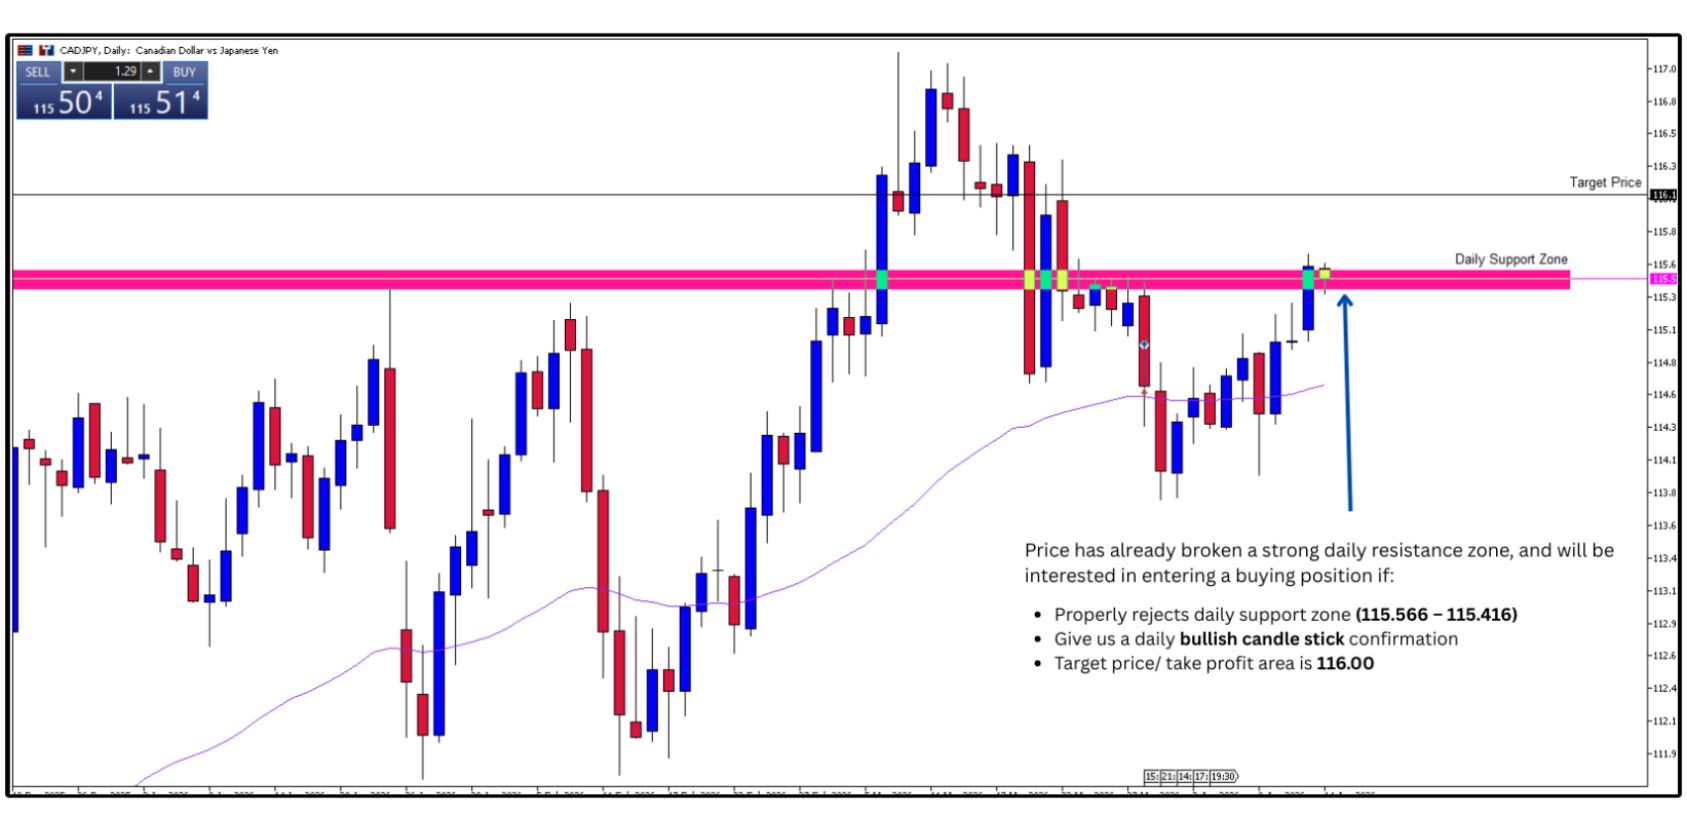
Last week’s CAD/JPY daily chart analysis focused on the broader market structure across both the weekly and daily timeframes. Price action was monitored for a potential higher low at the key support zone (115.017 – 114.800).
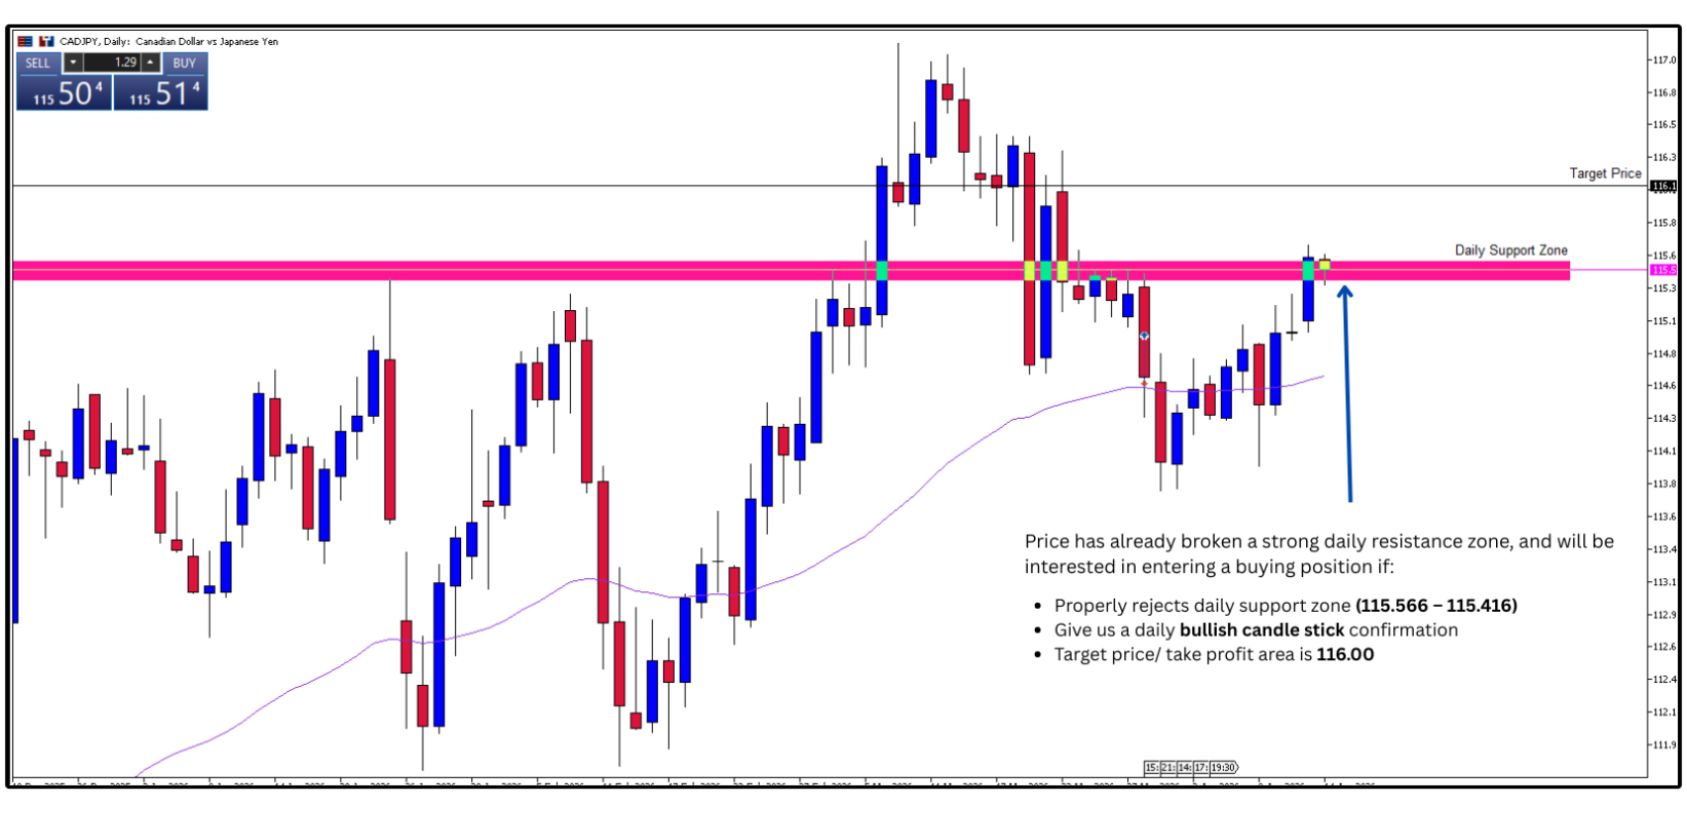
This move aligns with the previous anticipated scenario. Price has broken a key daily resistance, and the overall bias remains bullish as long as support holds.
Buy interest was considered if:
Overall, price action is following the expected structure after the breakout.
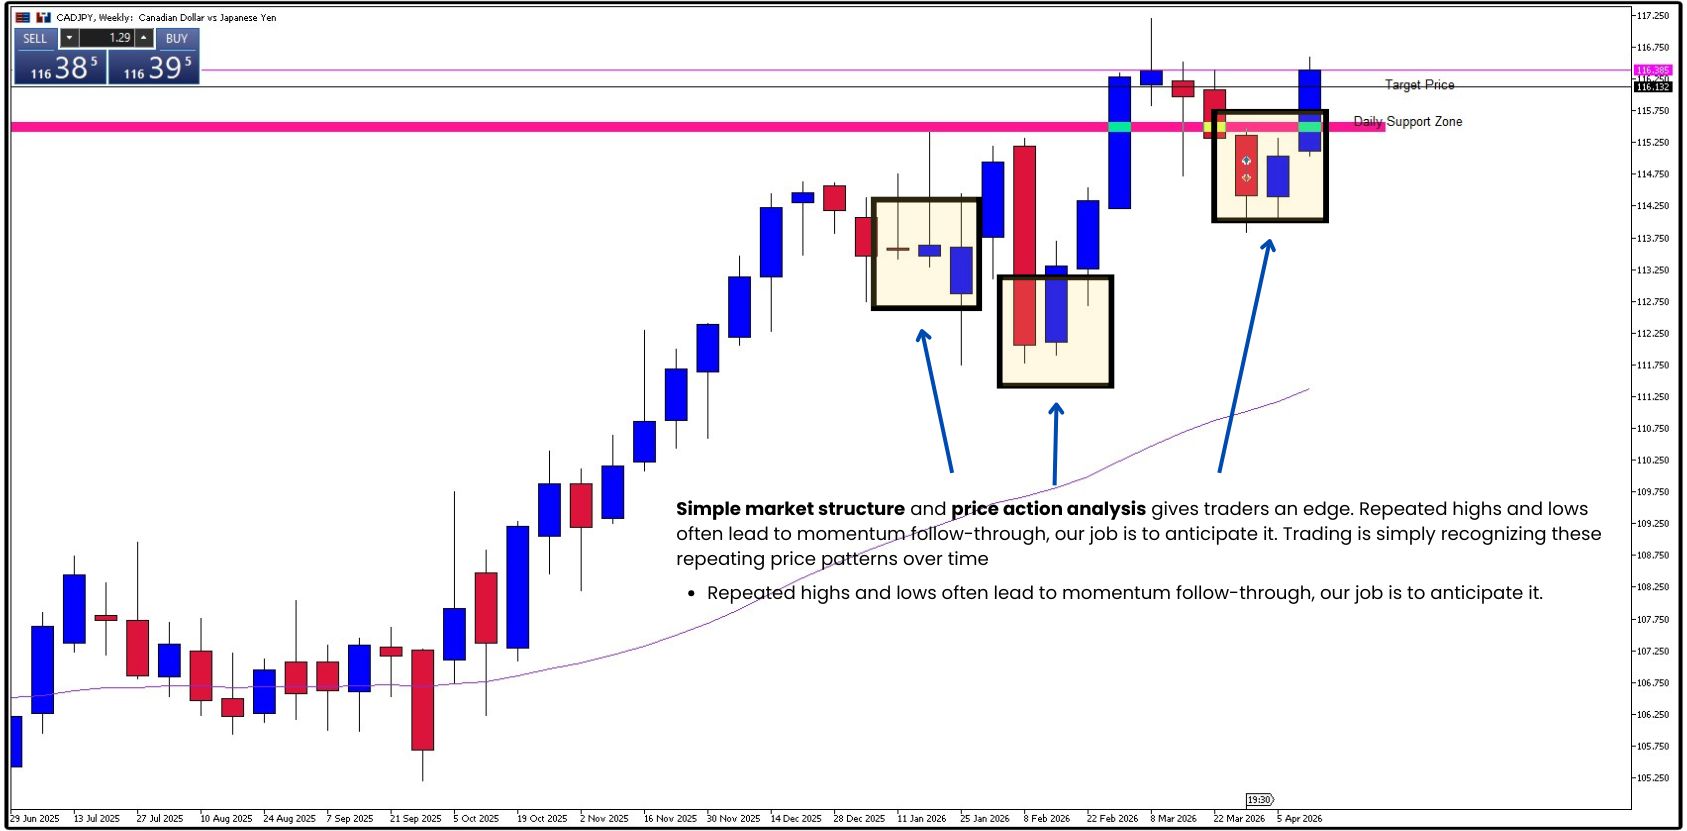
On the weekly chart, simple structure provides traders with a clear advantage. Repeated highs and lows signal momentum. Trading is essentially the process of identifying and understanding these repeating market patterns over a long period of time. You must learn the rhythm.
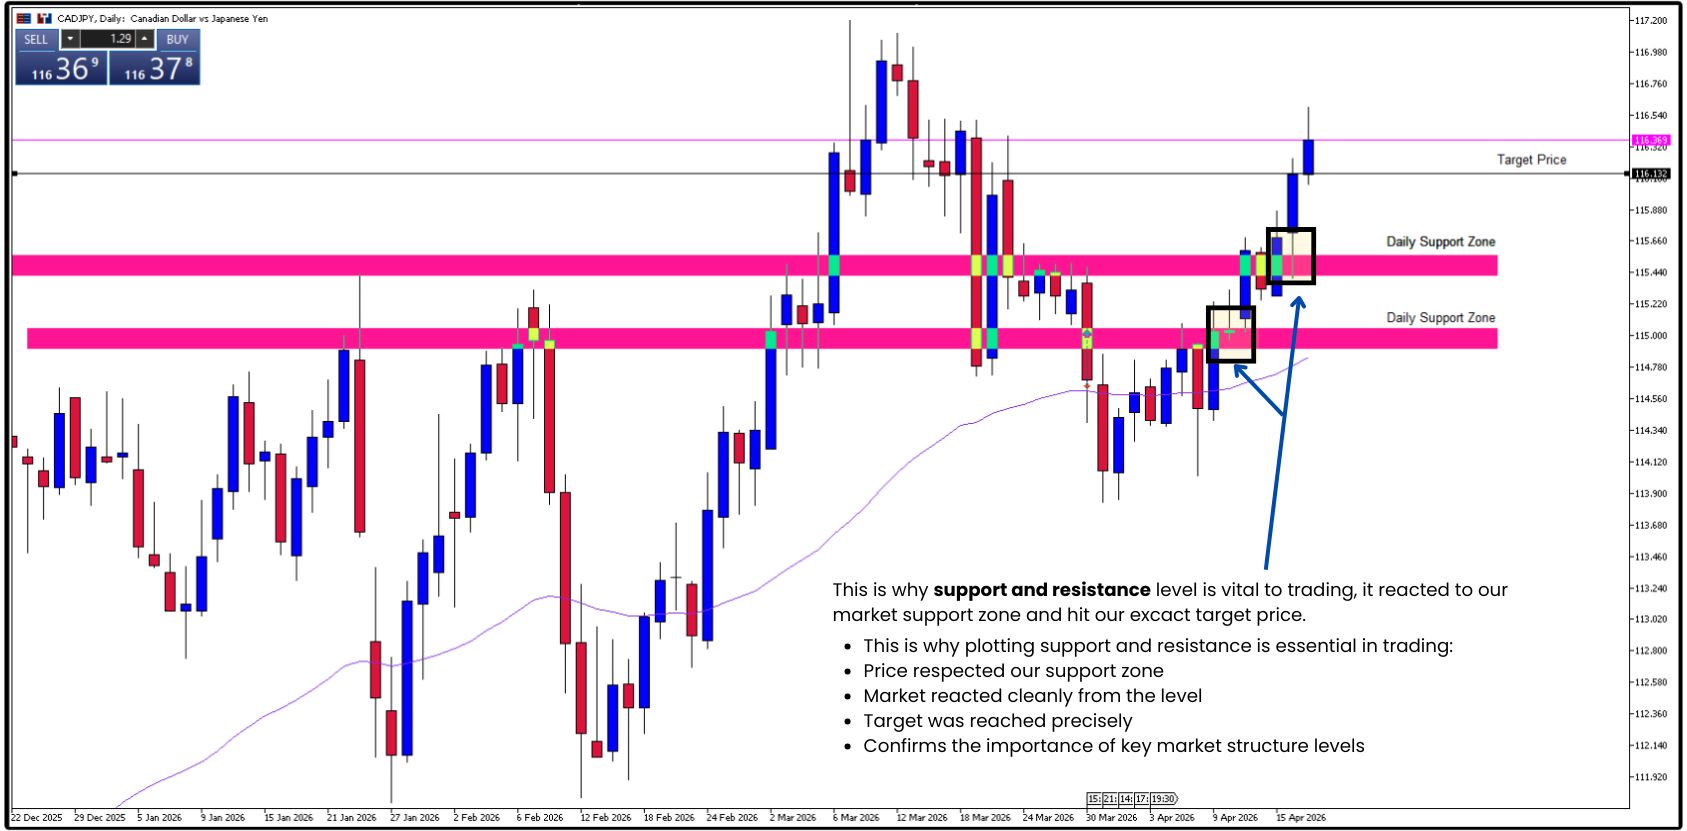
On this completed move on the CAD/JPY daily chart, support and resistance once again proved to be a key factor in price action.

Trading with simple price action is like driving by watching the road instead of the dashboard.
Indicators and news are like dashboard readings; they can help, but they often lag real movement.
Price action is the road itself, showing every turn, pause, and acceleration in real time.
That’s why simple price action is king!
Because it keeps traders focused on what the market is doing, without unnecessary noise.

CAD/JPY is a clear example that the market respect’s structure. Every time price hit key levels, it reacted and continued in the same direction.
That’s really all trading is wait for price at your levels, watch the reaction, and follow the momentum. No need to overcomplicate it.
At the end of the day, price action just keeps it all simple!
Just follow what the market is showing you, not what you think it should do.
Start your live trading journey today!
• Trade Forex, indices, gold, crypto and other global markets
• Access powerful platforms including ACY, MT4, MT5, and Copy Trading tools
Move from learning simple price action to executing it in the real market with confidence!
Create an Account. Start Your Live Trading Now!
Ready to learn simple price action strategy? Here’s how to do it step by step:
Gold is still one of the most traded assets, here’s how to trade it with confidence:
Your mindset is what separates steady growth from costly mistakes. Focus on these essentials:
Not sure where to begin? Here’s a simple roadmap to guide you:
By building step by step; from basics → real trading → mastering the craft, you’ll gain clarity, confidence, and steady progress without ever feeling overwhelmed.
Follow me for more daily market insights!
Ruffy Grant B. Capacio - LinkedIn
Disclaimer:
Trading forex and derivative instruments involves substantial risk and may not be suitable for all individuals. Only use funds that you are prepared to lose. It is important to understand how these markets work and the risks involved before trading, and to seek independent financial advice if needed. All market analysis and insights shared are intended for educational and informational purposes only and should not be considered financial or investment advice. April 17, 2026
ACY Securities is one of Australia's fastest growing multi-asset online trading providers, offering ultra-low-cost trading, rock-solid execution, technologically superior account management and premium market analysis.

Select the categories and companies you wish to follow directly to your person rss feed.
Create Custom RSS FeedSign up and join over 5,000 professional members who receive personalized news alerts, curated professional connections, and more for free!
WTI crude oil price forecast: A confirmed breakout above $94.765 could open the way toward $100.305, while weekly support remains at $87.360–$90.830.
NAS100 price forecast recap: Explore the Nasdaq 100 rally to 31,401.3, with technical analysis of the breakout and key support and resistance levels.
Learn how to identify, draw and trade XAUUSD supply and demand zones using Gold market structure, price action confirmation and clear risk management.
cTrader has been named Best Trading Platform at UF Awards APAC 2026 during iFX EXPO Asia in Hong Kong.
AUD/CHF reached last week’s 0.57732 bearish target. Learn how resistance, market structure and a neckline retest shaped the original price action forecast.
Businesses eventually reach a point where basic tools are not enough basic tools.
Multi-asset trading broker AvaTrade has agreed to acquire the majority of FXCM Group’s business and brand, in a transaction that would bring a longstanding retail FX franchise into the AvaTrade Group.
LSEG and CMC Markets have signed a multi-year strategic data agreement expanding CMC's access to LSEG's real-time and delayed pricing, reference and corporate actions data, news and analytics, plus AI-ready content, to support new products, entry into new markets and the growth of CMC's institutional and B2B partnerships.
The Tel Aviv Stock Exchange is considering a bid for the Cyprus Stock Exchange, with Israeli media citing its EU licence, trading platform and clearing house. Euronext’s Athens exchange and India’s National Stock Exchange are also seen as contenders, and Cyprus aims to sign a sale agreement by the end of this year.
CME Group will launch baseball futures on 12 October, pending regulatory review, tracking CME FutureSports Performance Indexes built on Official League Data. Standard and micro contracts will start with the 2026 Postseason and the four clubs in the League Championship Series, trading around the clock.