just now

Liquidity Finder Ltd is incorporated in England and Wales, company number 10610740, registered address 167-169 Great Portland Street, Fifth Floor, London W1W 5PF, United Kingdom.
Published: just now

KEY FACTORS TO PRICE MOVEMENTS THIS WEEK
Germany Bundesbank Balz Speech
GERMANY 30-YEAR BUND AUCTION from 3.5%
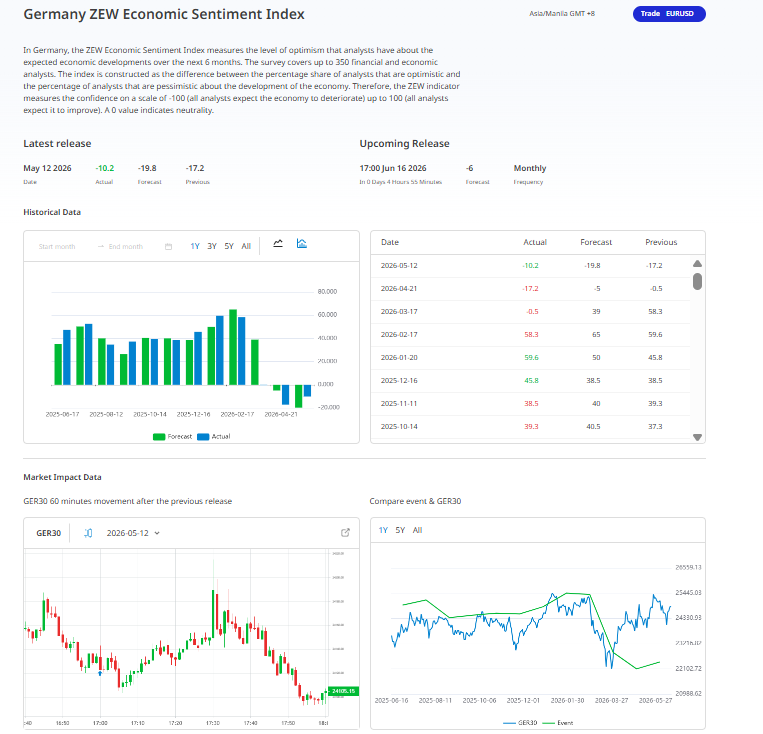
GERMAN ZEW ECONOMIC SENTIMENT INDEX JUNE from -10.2% to a forecast at -6%
EURO AREA INFLATION RATE MoM May from 1% to 0.1% forecast
EUROZONE INFLATION RATE YoY May from 3% to a forecast at 3.2%
EURO Core Inflation Rate YoY Final May from 2.2% to 2.5%
US FEDERAL RESERVE INTEREST RATE forecast at 3.75%
GERMANY PPI YoY May from 1.7% to a forecast at 2.5%
German Bundesbank Monthly Report June 18, 2026
Source: Finlogix
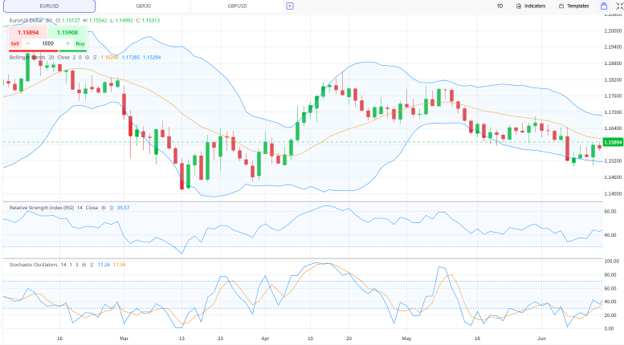
Provided that the interest rate in Eurozone is at 2.4% we also see a slump movement from the Factory Orders MoM from 4.50 to -3.80 for the month of April however the Manufacturing Production data seen a slight improvement from -4.90 to -1.70 same month including the Industrial Production for April from -3.40 to -0.50. This shows despite the slowdown of economic activity was driven by the persistent energy cost increment caused by the regional conflict, we can see there is an upward trend movement from the EURUSD’s performance during April peaked at 1.18485 level.
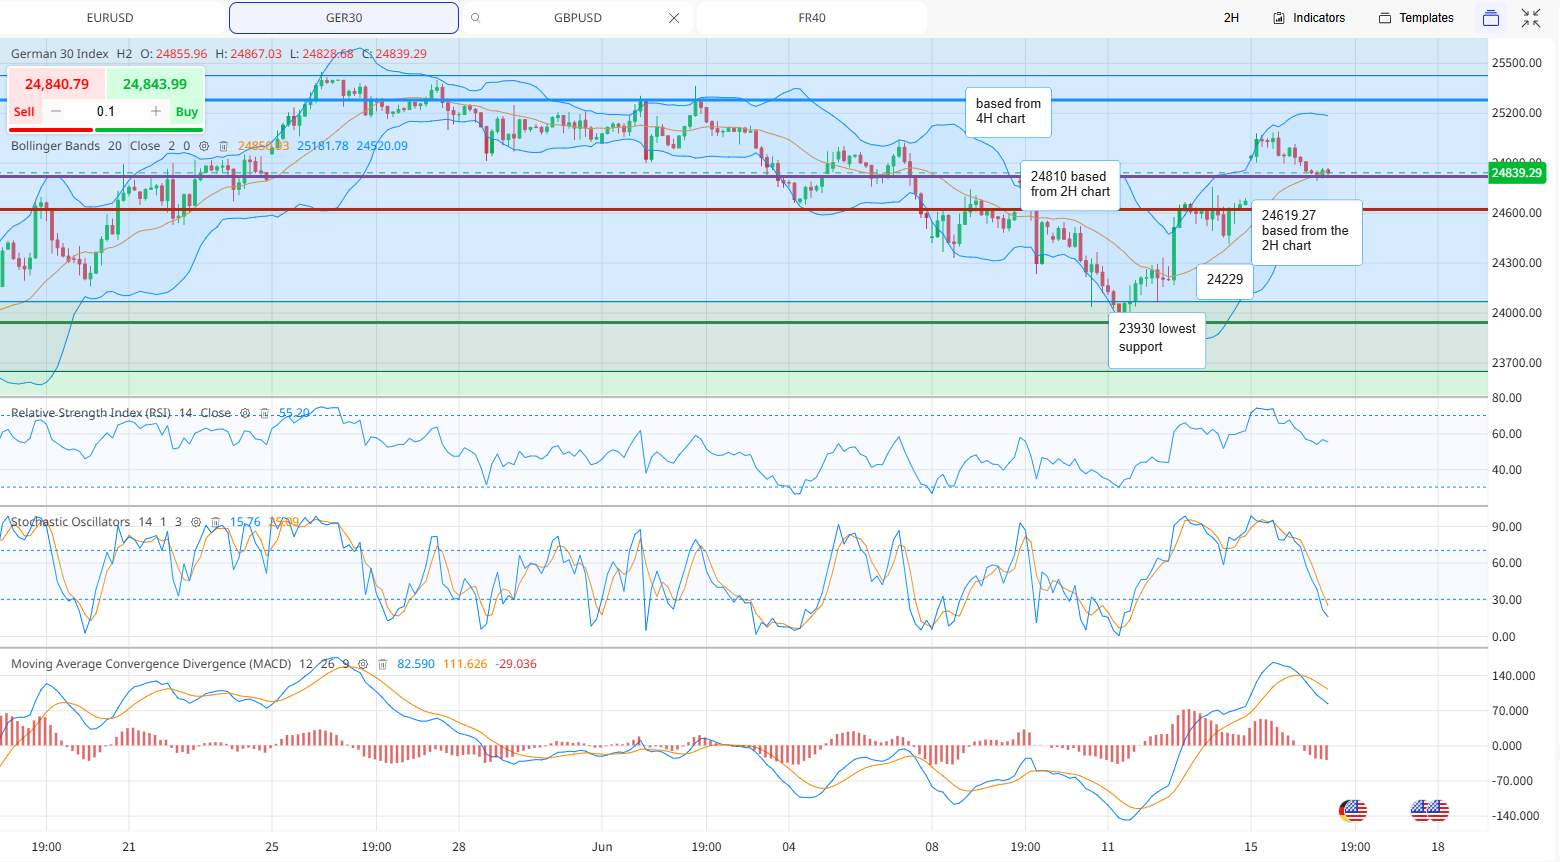
The support and resistance levels
Bullish level 25227
Resistance 2 at 24810 based from 2H chart
Resistance 1 at 24619.27 based from 2H chart
Support 1 at 24229
Support 2 23930 lowest level region
You will observe several horizontal lines crossing the chart. These are key regions where the price has historically struggled to go further higher (known as resistance) or found a floor to stop falling (known as support). Specific levels are called out, such as the 23930 line, which is marked as the lowest support. The Bollinger Bands surrounding the price helps measure market volatility. When the price clutches on the outer edges, it can suggest the market is overextended.
Relative Strength Index (RSI) as this line moves between 0 and 100 and this provides us to identify if the asset is in a probability of overbought (too high, too fast) or oversold (too low, too fast).
Stochastic Oscillators Similar to the RSI, this helps spot momentum turning points. When these lines cross in the lower area, markets look for potential upward movements.
Moving Average Convergence Divergence (MACD) This tells the link between two moving averages of a price. The bars and lines help show whether the trend is gaining strength (momentum) or losing it.
For a better understanding of the index analysis, please refer to the educational synopsis below.
How the DAX (GER30) and the Euro Drive European Wealth
Explore my portfolio for further insights:
GER30: Breaking the Records or Breaking Down?
DAX(GER30): How the index will weather the twin shocks of wholesale inflation and shrinking output?
DAX: Can lower energy prices save the industry?
Industrial Core vs. Energy Cost: Who wins the Battle for the DAX?
Leaders and Laggards Performers
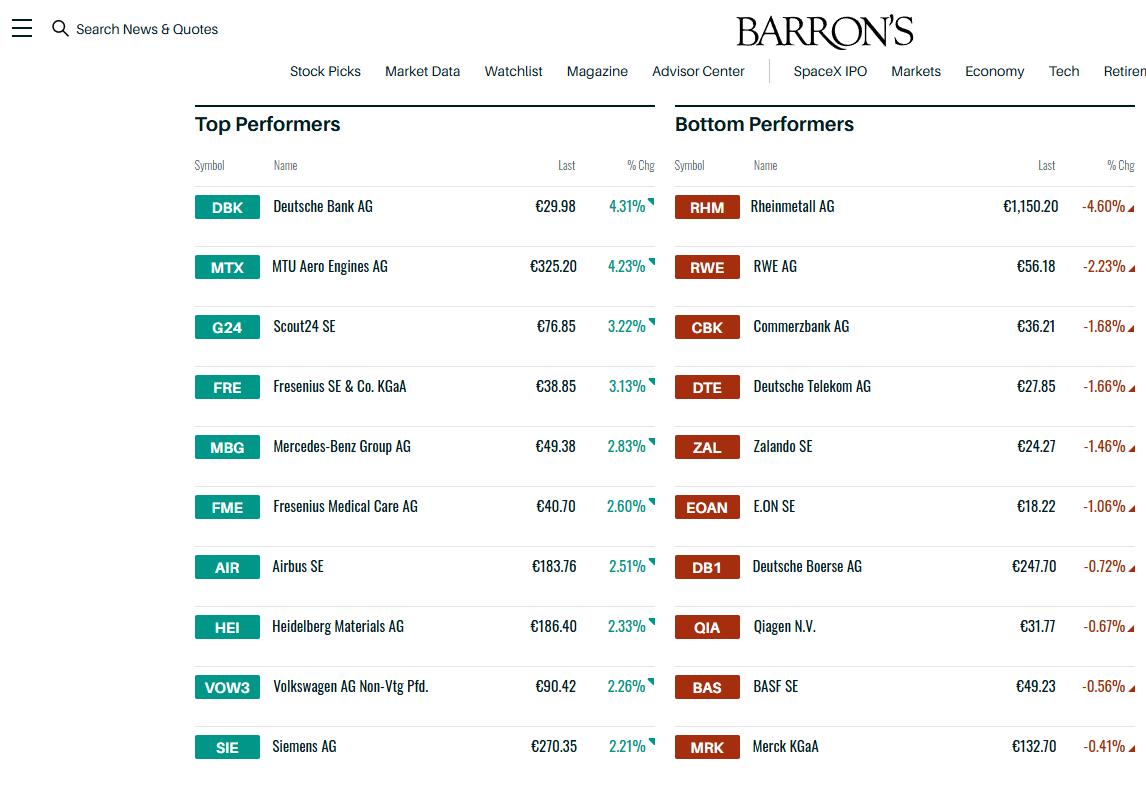
Source: Barron's
Below is the chart for the PMI Manufacturing Input Prices as energy costs driving pressure across the globe on input prices.
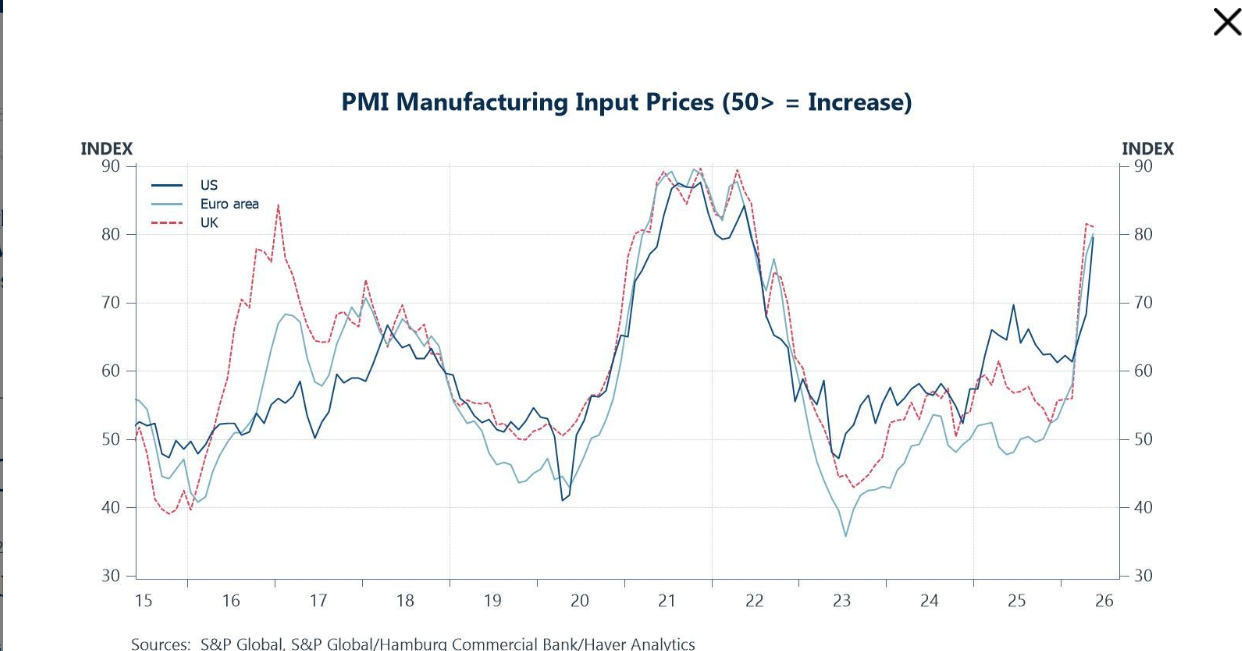
Source: Haver Analytics
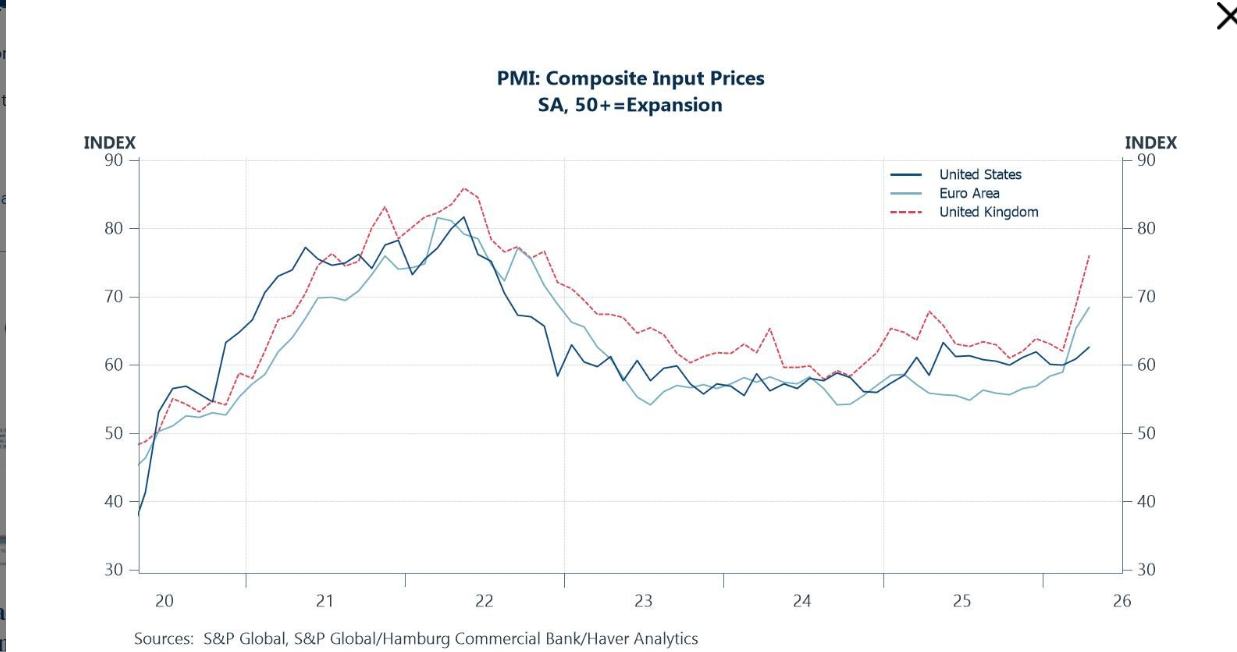
Source: Haver Analytics
Illustration above shows how the skyrocketing prices of oil influencing the inflation prices and is massive in European region compared to the United States. This monitors the costs businesses pay for the goods and services they need to operate and there’s an uptick in early 2026.
This exactly shows how the heavy manufacturing industries rely on energy costs.
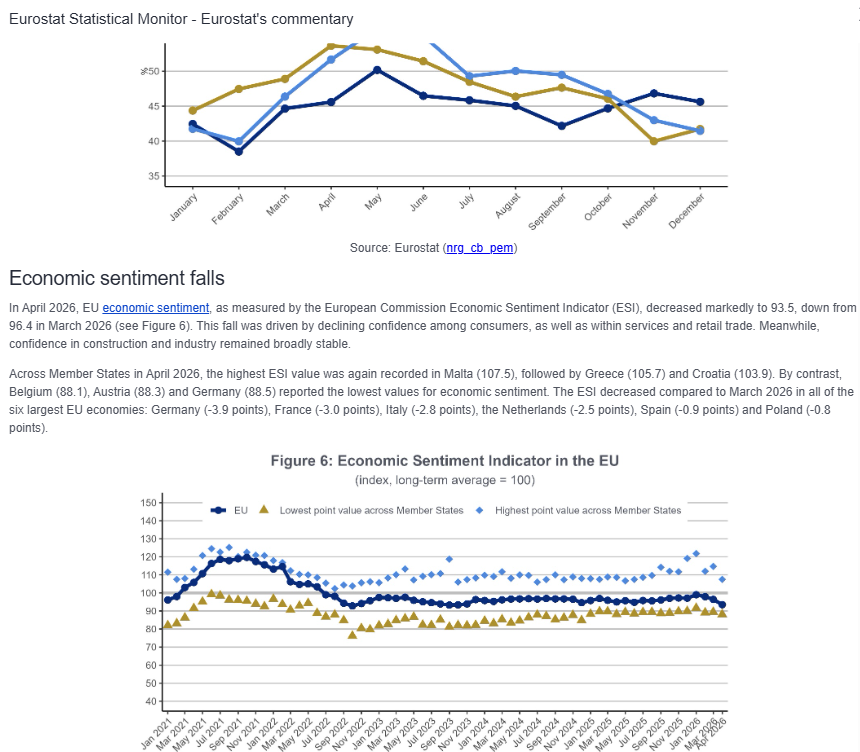
Source: Eurostat
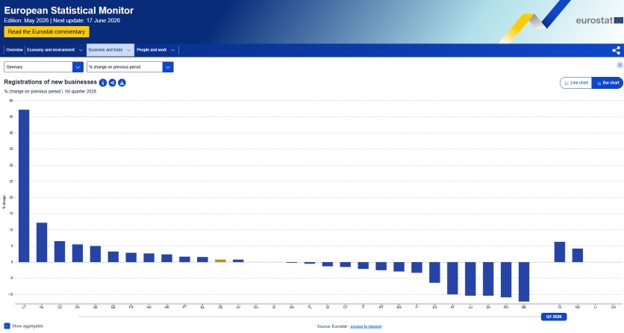
Source: Eurostat
We see sideways channel with an underlying bias and broader upward trend remain as the price is presently moving sideways than continuing a direct, uninterrupted climb.
Germany’s move toward stabilization has fostered a climate of cautious optimism, even as the index undergoes a consolidation phase. The market is primarily weighing the combined effects of domestic economic durability, future ECB policy, and the current cooling of inflation.
Disclaimer: This content may have been written by a third party. ACY makes no representation or warranty and assumes no liability as to the accuracy or completeness of the information provided, nor any loss arising from any investment based on a recommendation, forecast or other information supplies by any third-party. This content is information only, and does not constitute financial, investment or other advice on which you can rely.
ACY Securities is one of Australia's fastest growing multi-asset online trading providers, offering ultra-low-cost trading, rock-solid execution, technologically superior account management and premium market analysis.
Select the categories and companies you wish to follow directly to your person rss feed.
Create Custom RSS FeedSign up and join over 5,000 professional members who receive personalized news alerts, curated professional connections, and more for free!
Sterling steadies after political uncertainty rattled gilt markets, while EUR/USD and EUR/GBP approach key technical levels ahead of today's European session.
GBP/AUD remains trapped in a well-defined bearish trend on both the weekly and daily timeframes.
Discover the key drivers, technical levels, and central bank expectations shaping the EUR/USD trend as the ECB prepares to hold rates and markets watch for a potential breakout.
Sydney-based multi-asset broker ACY Securities has introduced PAXGUSD, a new CFD instrument that allows clients to trade tokenised gold against the US Dollar 24 hours a day, seven days a week. The instrument is available across MetaTrader 4, MetaTrader 5, and the ACY Trading Platform.
Binance has lowered its VIP 3 Wallet Assets threshold from $3 million to $1 million and will now count OTC Spot Trading Volume at a 4x multiplier toward VIP qualification, removing the previous VIP 4 cap and allowing eligible users to progress through the full tier framework up to VIP 9.
Retail futures trading leader NinjaTrader Group has appointed Mark Omens as Senior Vice President, Commercial Strategy, bringing a 25-year veteran of derivatives marketplace CME Group into a newly created role focused on exchange partnerships and enterprise growth.
Gold Price Action Forecast: Will XAU/USD Drop to $3930? Meta Description: Read our Gold price action forecast to see if XAU/USD will drop to $3930.
BitDelta Securities Financial Services LLC (“BitDelta Securities”) today announced that it has received full regulatory approval from the Capital Market Authority (“CMA”) of the United Arab Emirates under the Category 5 — Arrangement and Advice license framework (License No. 20200000439). The approval follows the firm's receipt of In-Principal Approval earlier this year and represents the successful conclusion of the CMA's full licensing process, including the satisfaction of capital requirements, governance appointments, and operational setup.
Crypto.com has received a $400 million strategic investment from Citadel Securities, valuing the firm at $20 billion. It marks the first institutional funding round in the company's history, aimed at accelerating its expansion into tokenised securities, derivatives and other asset classes.
WTI’s pullback into $79–82 is the first major test of the bullish Elliott Wave count, with buyers targeting a renewed break above $85.