just now


Liquidity Finder Ltd is incorporated in England and Wales, company number 10610740, registered address 167-169 Great Portland Street, Fifth Floor, London W1W 5PF, United Kingdom.
Published: just now

EUR/USD is progressing closer to the round number 1.20 price level. Once this level is reached, it would be the highest EUR/USD exchange rate since 2021.
On Wednesday, the FOMC concludes their 2-day meeting with their latest interest rate announcement. The Fed is anticipated to hold rates steady with the street anticipating the next rate cut in June 2026.
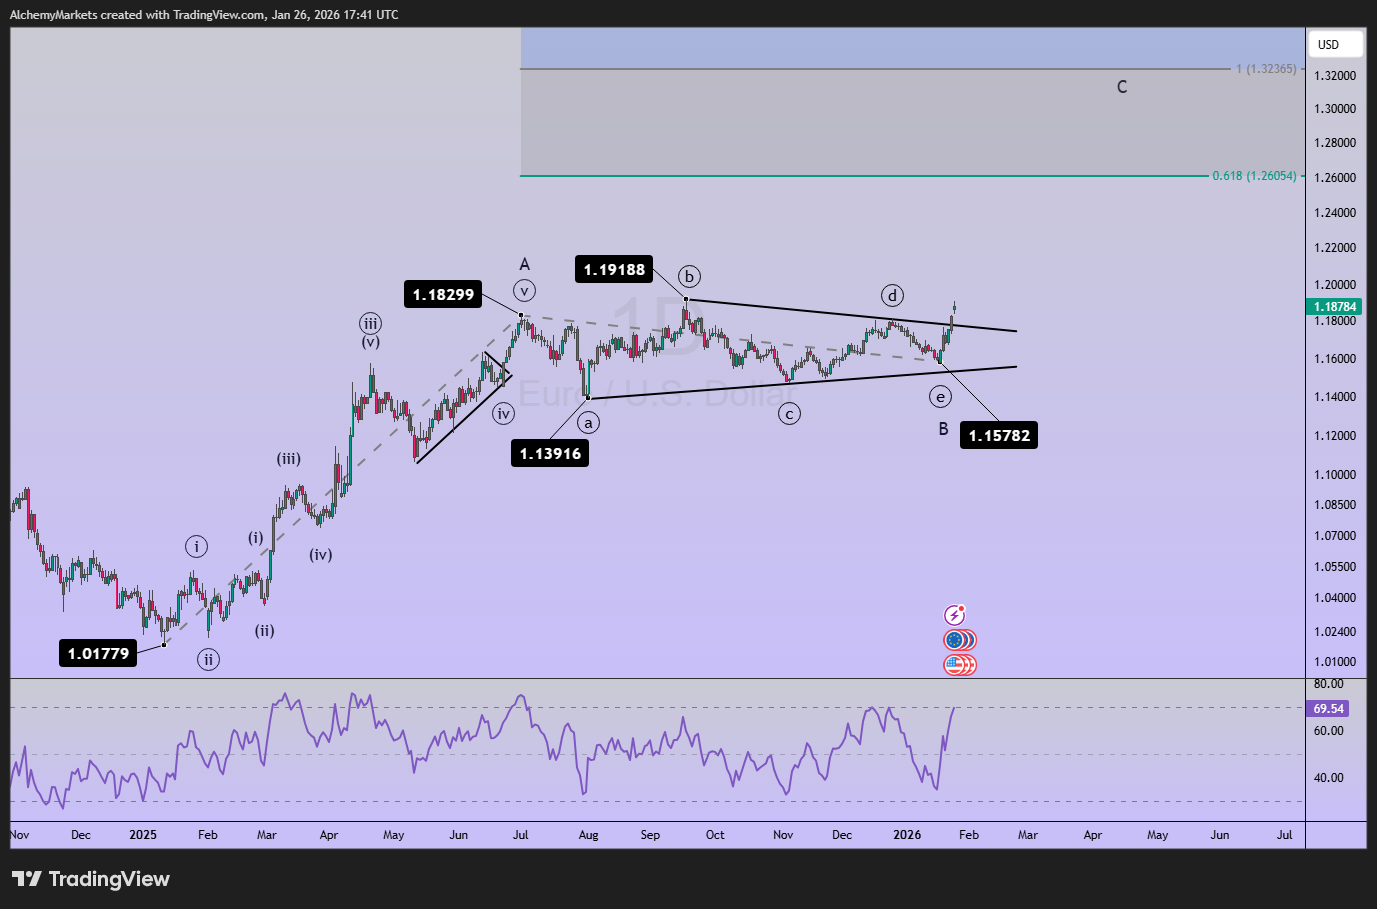
The primary Elliott wave count we are following is a large A-B-C zigzag pattern. The B-wave of the pattern just completed and wave C is rallying higher.
For common technicians, this pattern resembles a large bullish flag pattern. Wave A is the flag pole and wave B is a multi-month symmetrical triangle.
This pattern anticipates a bullish break higher. EUR/USD has begun to break above the topside resistance of the flag pattern near 1.18.
Using the Fibonacci extension tool, we are anticipating the bullish rally to carry up to 1.26 (the 61.8% extension) and possibly 1.32 (100% extension). The 100% extension would be the similar as a ‘measured move’ by projecting the length of the flagpole upon breakout.
The Elliott wave structure we are anticipating for this rally is a 5-wave motive pattern, an impulse or diagonal.
The bullish key level is the January 19 low of 1.1578.
The obvious Elliott wave count we are following is that a bullish flag pattern is unfolding. The triangle wave is the middle of the pattern and just concluded at 1.1578. This pattern hints a large bullish rally to 1.26 and possibly 1.32 while holding above 1.1578.
Alchemy Markets is a multi-asset brokerage providing retail traders with the same elite trading conditions, tools, and transparency typically reserved for institutions.
Select the categories and companies you wish to follow directly to your person rss feed.
Create Custom RSS FeedSign up and join over 5,000 professional members who receive personalized news alerts, curated professional connections, and more for free!
ATARIA CRM’s **Payment Gateways** feature centralizes multiple payment methods—**PSPs, bank payments, and crypto**—into one workflow. This helps brokerages manage payment activities more efficiently, reduce operational complexity, and provide clients with flexible funding options from a single platform.
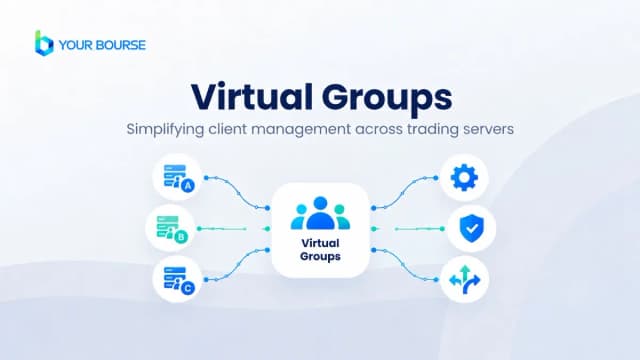
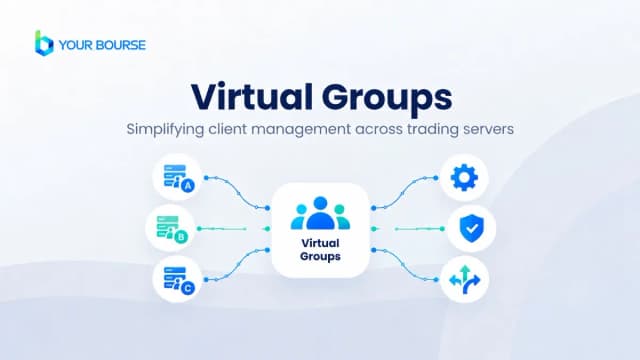
Bring native groups from different connected trading servers together under one virtual structure and manage future routing changes from one place.
DIGITEC has appointed Matthis Schneegass as Chief Financial Officer and Managing Director, reporting to CEO Peer Joost. Schneegass joins from SaaS scale-up PINKTUM and brings nine years of finance and strategy experience from Engel & Völkers, including CFO for the Americas, ahead of DIGITEC's next growth phase.
Bitcoin price forecast: Can BTCUSD hold $80,268–$82,175 support and rally to $86,750? Explore bullish and bearish scenarios, EMA signals and key levels.
Your Bourse has launched Virtual Groups, a feature enabling brokers to manage routing configurations for client groups across multiple connected trading platforms from one central point, reducing the need to update each server individually as trading-server structures grow and change over time.
CME Group will launch Bitcoin Cash and Uniswap futures on 19 October, pending regulatory review, expanding its crypto derivatives suite with standard and micro contracts. Executives from CME Group, Volatility Shares and Ripple Prime say the products give institutions broader, regulated tools for managing digital asset risk.
ATARIA CRM helps brokers manage a growing client base by bringing client information into one organized platform. It highlights key client statuses such as total, active, inactive, and blocked clients, making it easier for teams to track records, manage communication, automate follow-ups, personalize engagement, and use data insights to strengthen relationships, improve collaboration, save time, and support business growth.
The biggest macro events of Q3 may be behind us. Now comes the next question: what happens when the market starts separating companies rather than trading the macro narrative? Following the Fed’s 25-basis-point hike, a flattening yield curve and sharply elevated tanker rates, the investment landscape is shifting. The same forces can create very different pressures across technology, energy, financials, industrials and consumer sectors. In this week’s BitDelta Pro Weekly Outlook, we look beyond the headlines to examine where those differences may start to matter most. Read the full article for our breakdown of the rate path, the inflation signal hiding in shipping costs, and the sector dynamics taking shape. BitDelta Securities Financial Services LLC, regulated by the Capital Market Authority under Category 5 (Introduction Only), acts solely as an introducer and does not provide trading, execution, dealing, advisory, portfolio management, or custody services. All trading, execution, and investment-related services are provided by BitDelta Limited, Mauritius, a licensed Investment Dealer. All trading and investments involve risk. The value of investments may fluctuate, and you may receive less than your initial investment.
An analysis of how Federal Reserve policy, geopolitical risks in the Persian Gulf, and shifting global yields drive the US Dollar (DXY) near the 100.3 level, alongside market scenarios and technical outlooks.
audcad-price-forecast-support-retest-bullish-breakout