just now


Liquidity Finder Ltd is incorporated in England and Wales, company number 10610740, registered address 167-169 Great Portland Street, Fifth Floor, London W1W 5PF, United Kingdom.
Published: just now


This critical update tracks U.S. crude, gasoline, and distillate stockpiles to give us a clear pulse on domestic petroleum demand. Because these inventory fluctuations serve as a massive driver for market sentiment, keeping a close eye on the numbers helps you stay ahead of wild market swings.
NOTE: The American Petroleum Institute's Weekly Statistical Bulletin is a paid subscription service designed for industry professionals, traders, and analysts who need proprietary access to petroleum data before it is released to the public.
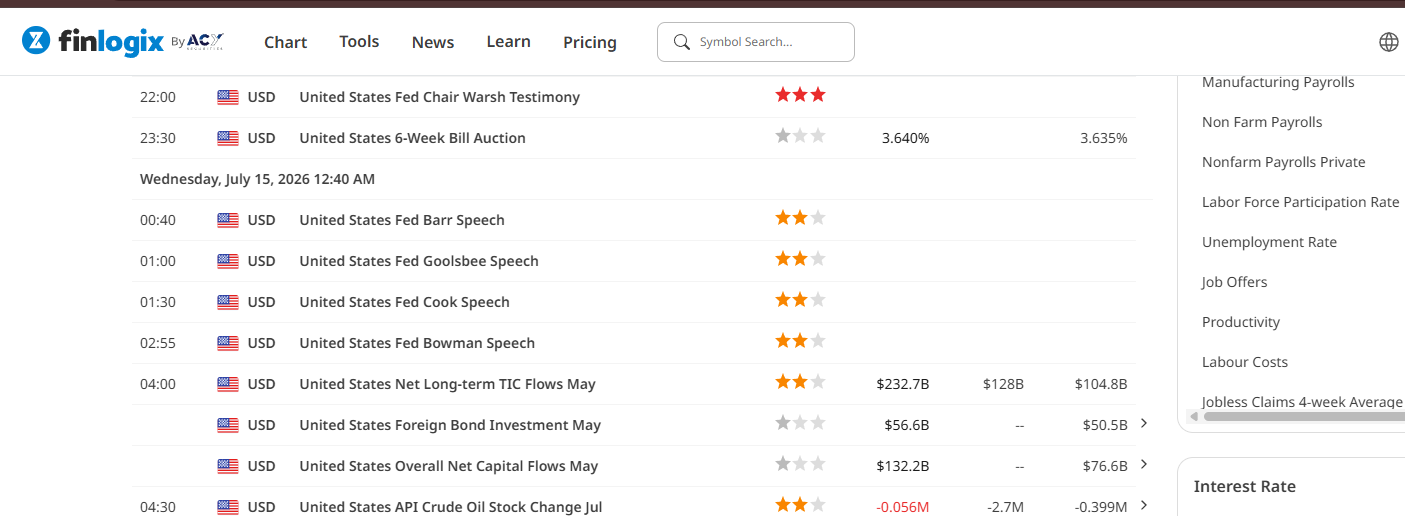
Source: Finlogix
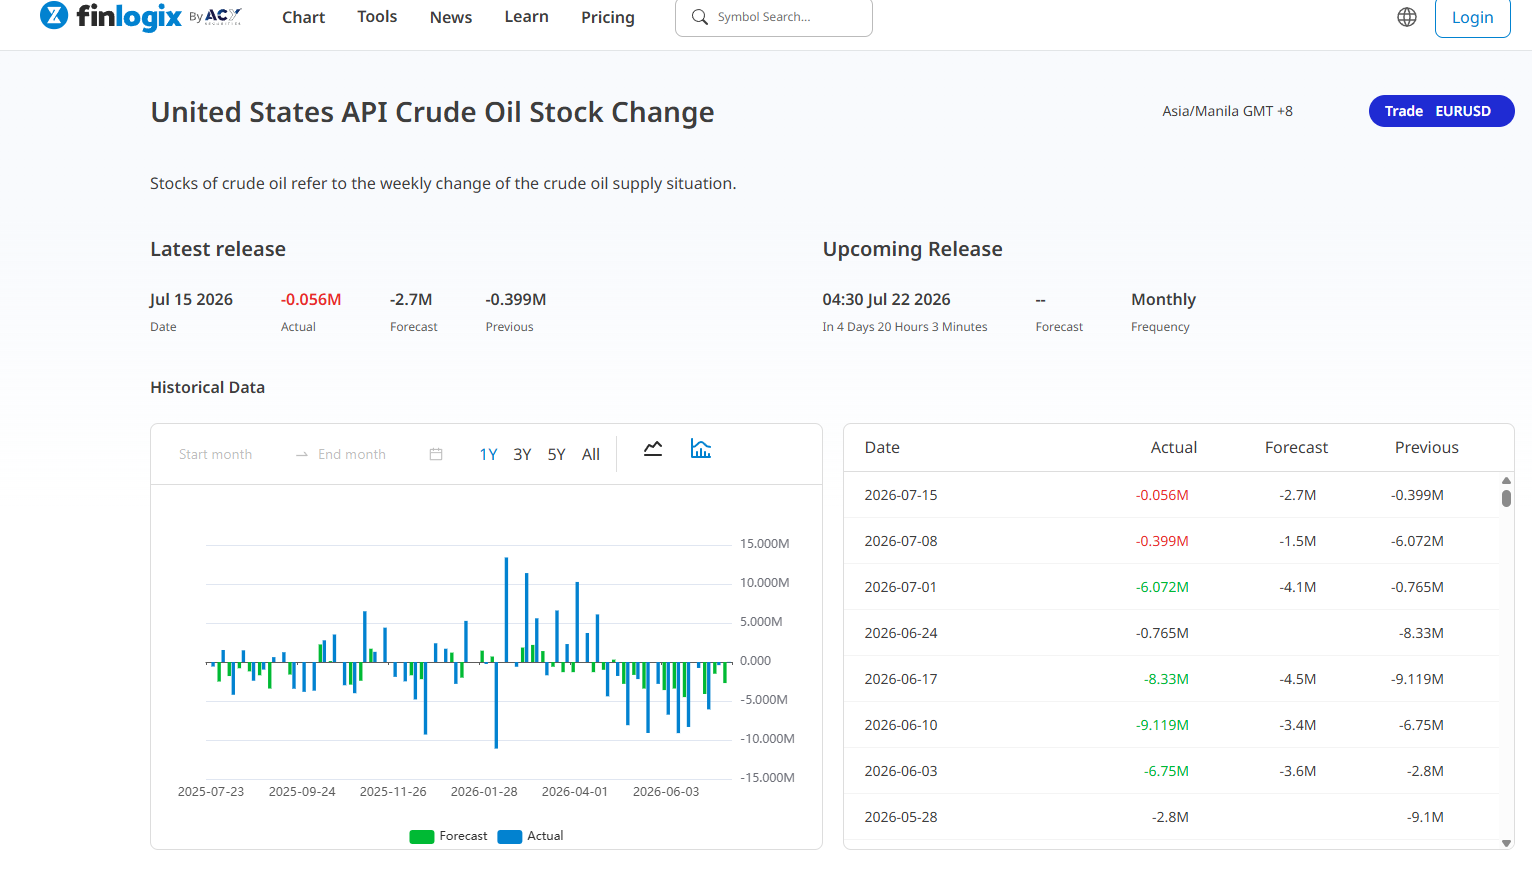
Source: Finlogix
A sudden drop in oil storage often means people are buying lots of fuel, which acts as a major warning sign for traders trying to predict the future. Traders look at this.
When markets purchase or consume more gas, prices naturally go up. If storage tanks are getting too full because demand is weak, prices will usually fall fast. Understanding this delicate balance between what we have and what we need helps you see exactly where the complex energy market is heading next.
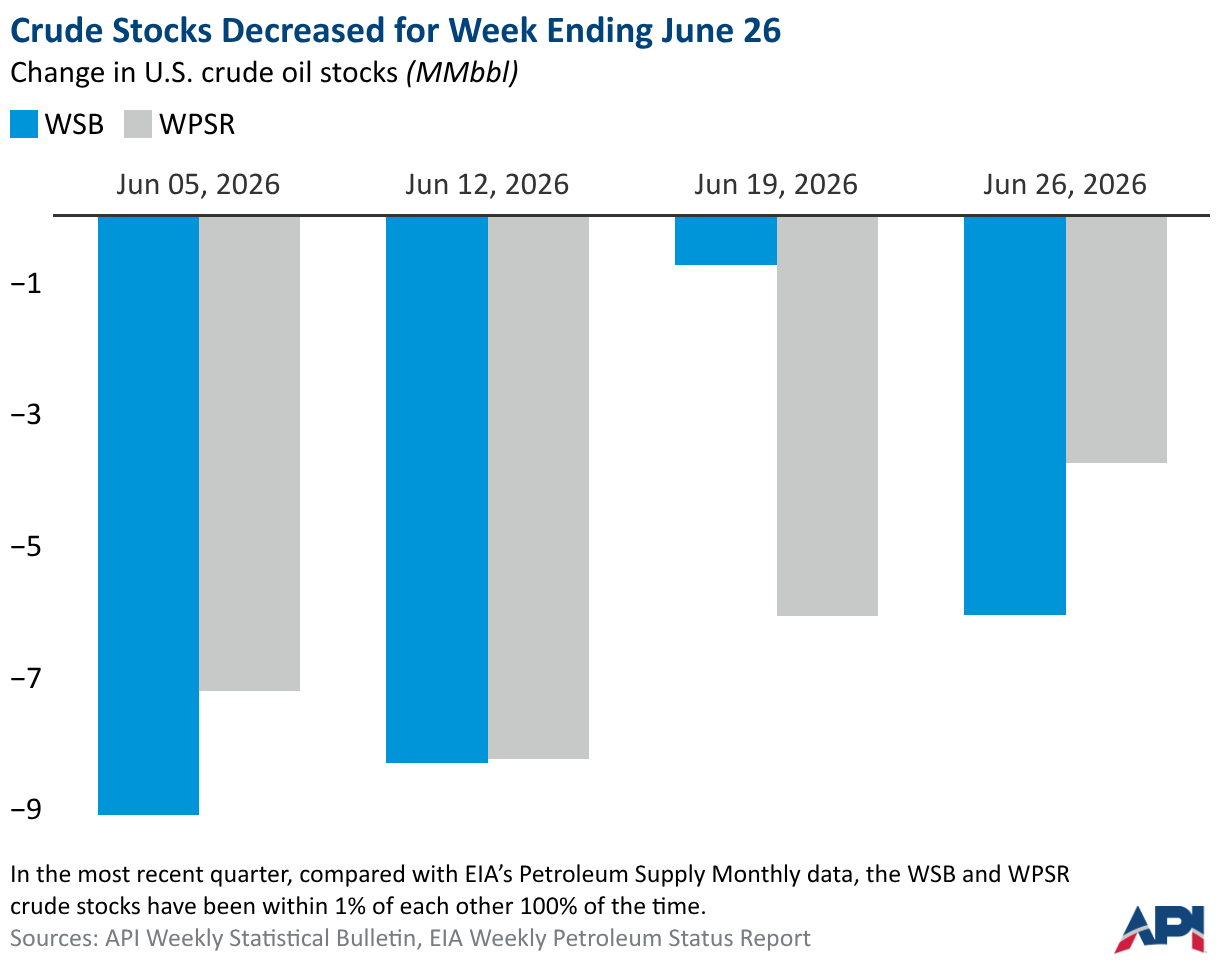
Source: American Petroleum Institute
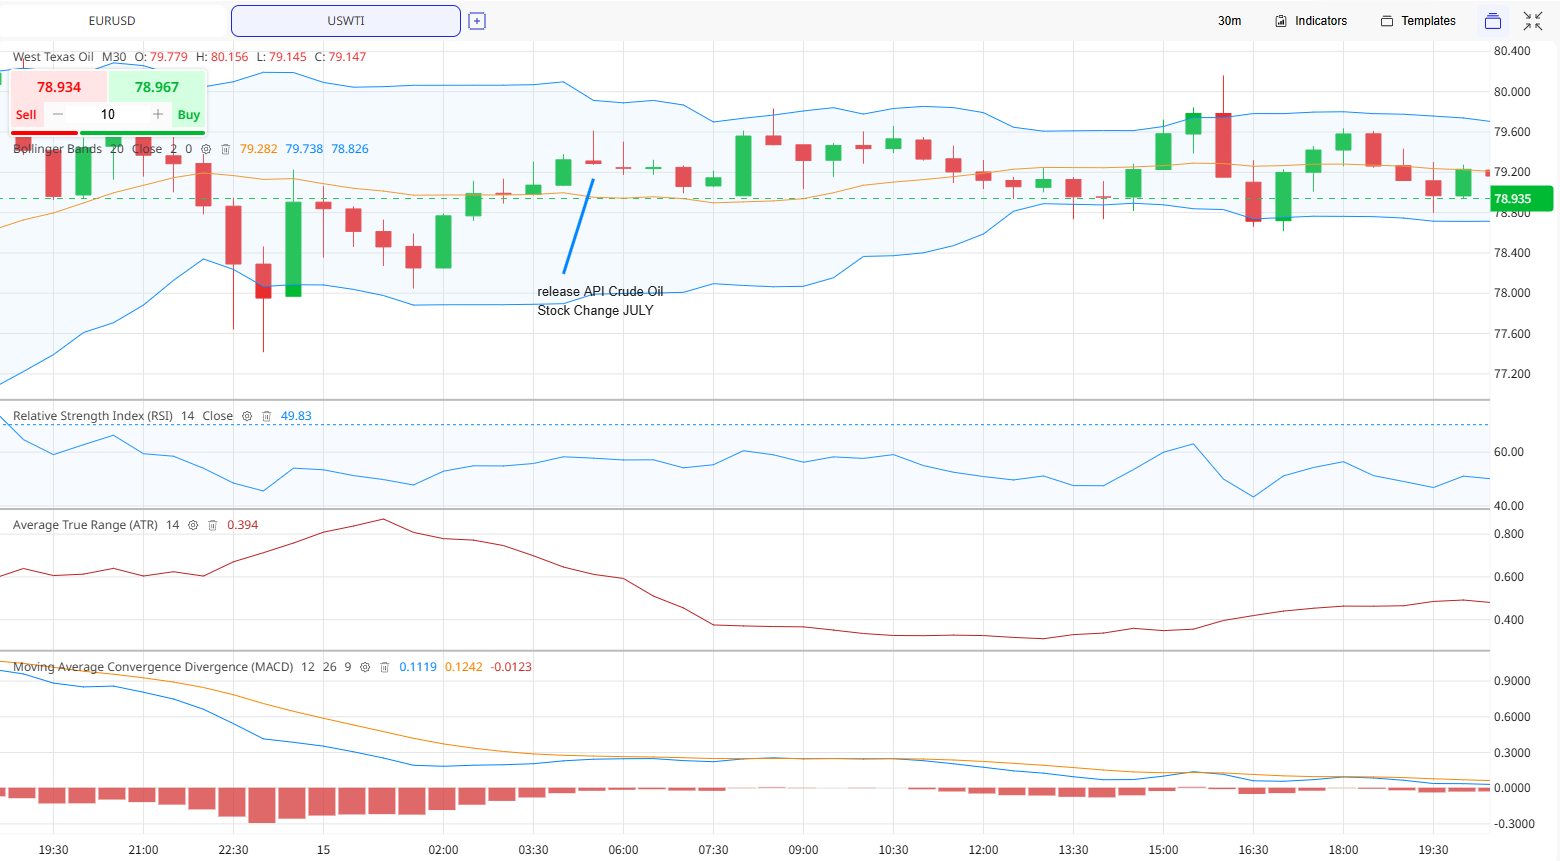
Example below the chart for 30-minutes when API Crude Oil Stock Change was released
Source: ACY
We’re looking at a 30-minute timeframe chart for West Texas Intermediate (USWTI) crude oil.
MARKET CONSOLIDATION -At the top, we see the candlestick chart overlaid with Bollinger Bands. The price is currently trading near the middle line, indicating a period of consolidation, highlights a reaction to the release of the API Crude Oil Stock Change data. Following that event, the market moved into a relatively neutral range.
NEUTRAL MOMENTUM- Relative Strength Index (RSI), we are seeing a reading of 49.83 since this is around the 50-level, it confirms that there is no strong bullish or bearish momentum. The market is essentially in a state of equilibrium.
DECREASING VOLATILITY- Average True Range (ATR), which sat at 0.394 and this measures market volatility. The downward slope of this line suggests that volatility has been contracting, which often precedes a breakout or a significant move in either direction.
LACK OF DIRECTIONAL TREND- Moving Average Convergence Divergence (MACD) as we see the histogram is quite flat, and the signal lines are tightly compressed near the zero line. This reinforces the idea that there is very little directional trend strength in the current market environment.
What is the API weekly report and when does it come out?
Released every Tuesday at 4:30 p.m. ET, the weekly report presents as a preliminary industry indicator by aggregating voluntary survey data from U.S. refiners, pipelines, and storage terminals to estimate domestic oil inventories, covering roughly 90% of the sector.
U.S. crude stockpiles affecting oil prices
The amount of stored oil changes how traders act. With U.S. crude stockpiles rising less than projected, prices are positioned to climb on tightened supply expectations. On the flip side, a larger build than anyone expected creates a bearish market that drives the value of WTI oil prices straight down. Supply dictates cost.
A massive decline in inventories almost always points to very strong buyer demand. If the drawdown is much smaller than expected, the market views this as a deeply negative sign for the future of the industry. Markets react instantly.
How does this survey compare to the EIA report?
The API weekly report acts as an early warning system. Traders use Tuesday's numbers to anticipate the official EIA report that always comes out on Wednesdays. Unlike the voluntary industry surveys, the government-backed Energy Information Administration release is much more comprehensive because it uses deeply vetted facts to track the entire country.
Sometimes, the two reports do not match at all. Large discrepancies between API and EIA figures can occasionally trigger sharp, sudden price adjustments in crude oil futures. Market watchers must pay close attention to both of these releases every single week if they want to avoid getting caught off guard by a wild swing. Surprises cause panic.
As a major benchmark for U.S. oil, WTI crude oil reacts rapidly to this data release that even minor discrepancies in these figures can trigger significant market volatility or movements as increased supply often applies downward pressure on prices. But when oil tanks start to empty out, buyers rush in and push the value much higher. The stakes are huge.
How Do API Crude Oil Inventories Affect WTI Prices?
Because WTI prices are driven by supply and demand fundamentals, API Crude Oil Inventories act as a quick health check. A larger-than-expected decline signals robust demand, serving as a bullish indicator that typically drives oil prices significantly higher as buyers seize control of the market.
On the flip side, an unexpected build in supplies signals a bearish trend. This means demand is weak, or there is simply too much oil flooding the system. That exerts heavy downward pressure on the market. Prices drop fast.
Oil values are driven entirely by the basic principles of supply and demand.
A sudden drop in stored oil (a drawdown) is a bullish signal that pushes costs up.
An unexpected increase in oil supplies (a build) is a bearish signal that forces costs down.
What Is the Cushing Factor?
The storage hub in Cushing, Oklahoma, is the actual delivery point for WTI. Even if national supplies rise, local shortages will cause the market to jump.
Traders look closely at Cushing-specific data within these weekly reports. They want to see if the immediate supply of local oil is tightening up.
Why Do Traders Watch This Before the EIA Report?
The API data arrives on Tuesday. This makes it a perfect prelude to Wednesday's official government numbers. Because the API and the EIA report match up about 80% of the time, traders get a massive head start.
Early data lets investors adjust their strategies before the government-vetted figures hit the wires. Markets react instantly to massive supply builds. Traders immediately price in the newly discovered market sentiment.
By tracking API Crude Oil Inventories, market players gain a serious edge. They can safely hedge their specific trading bets before the official Wednesday numbers even arrive. Knowing the numbers keeps you safe.
Explore my portfolio for further insights:
Will WTI Break $80? Key Levels and Market Drivers
WTI OUTLOOK: Is the War Premium Finally Fading?
Disclaimer: This content may have been written by a third party. ACY makes no representation or warranty and assumes no liability as to the accuracy or completeness of the information provided, nor any loss arising from any investment based on a recommendation, forecast or other information supplies by any third-party. This content is information only, and does not constitute financial, investment or other advice on which you can rely.
ACY Securities is one of Australia's fastest growing multi-asset online trading providers, offering ultra-low-cost trading, rock-solid execution, technologically superior account management and premium market analysis.

Select the categories and companies you wish to follow directly to your person rss feed.
Create Custom RSS FeedSign up and join over 5,000 professional members who receive personalized news alerts, curated professional connections, and more for free!
Bybit has launched Perp Options, described as the first options contracts built on TradFi perpetuals, giving traders round-the-clock access to US equity options. SpaceX and Nvidia are the first underlying assets, with USDT settlement and integration into Bybit's Unified Trading Account.
Use this trading preparation checklist to plan your session, define entry rules, manage risk, and build a disciplined trading routine in seven steps.
Your Bourse expands its crypto liquidity ecosystem with Caladan, giving brokers access to broader market coverage, institutional execution capacity and streamlined settlement.
Scope Markets, the retail brokerage part of Rostro Group, has appointed Ibrahim Hossny as Head of Research and Marketing for the Middle East and North Africa.
Hantec Prime, the institutional division of Hantec Markets, has reported trading volume up more than 300% year-to-date, alongside the addition of 42 new institutional clients since December, capping one of its strongest years of growth to date.
Learn how to refine XAUUSD support and resistance on the daily chart using candle bodies, market structure and weekly gold levels for swing trading. A slug alone cannot guarantee a top Google ranking. Keep it focused rather than adding every supporting keyword.
The week in Dubai will be focused on connecting directly with the industry and discussing how technology can help modern brokerages simplify operations, automate workflows, strengthen operational control, and scale efficiently.
Devexperts has launched a turnkey solution giving brokers in South Korea access to US equity markets, combining its DXtrade trading platform, dxFeed market data, and execution services. The offering targets South Korea's growing retail demand for US stocks, worth several billion USD monthly.
Assess why WTI crude oil surged past $105 per barrel amid Saudi pipeline disruptions, record tanker charter rates, and escalating geopolitical tensions.
Bitcoin price forecast: BTC/USD retests $78,460–$80,215 resistance. Watch bearish confirmation toward $72,480 or a bullish breakout toward $86,150.