
Daily Fundamental Analysis: Global stocks under pressure following hot inflation reading from the US
just now

Liquidity Finder Ltd is incorporated in England and Wales, company number 10610740, registered address 167-169 Great Portland Street, Fifth Floor, London W1W 5PF, United Kingdom.
Published: just now
Gold is trading around $4,150, recovering sharply after falling to a recent low of $4,073. The chart shows a significant sell-off on October 14, followed by a strong rebound that carried prices back above $4,140. The latest price action suggests that buyers have returned after the steep decline, although the broader short-term trend still requires confirmation.
The moving averages are showing signs of improvement.
Immediate support is located around $4,143, followed by $4,117. A break below $4,117 would weaken the recovery, while a move below $4,100 could expose the recent low around $4,073.
On the upside, initial resistance is located around $4,162–$4,172, followed by $4,185 and the previous swing high near $4,214. A sustained break above $4,172 would strengthen the bullish recovery, while a move above $4,185 would provide further confirmation that buyers are regaining control.
Outlook is cautiously bullish in the short term, but still vulnerable to renewed selling. The rebound above the moving averages is encouraging, yet gold needs to break through $4,162–$4,172 to establish stronger upward momentum.
.webp)
Source: STARTRADER app | Gold recovers from yesterday’s losses to trade above $4,100 again
| Resistance | $4,185 | $4,214 | $4,256 |
| Support | $4,117 | $4,074 | $4,022 |
Brent crude is trading around $106.46, following a sharp sell-off from the $108 area. The moving averages confirm a bearish shift. Price is trading below the three moving averages MA(5), MA(10), and MA(20). All three averages are positioned above the current price, with the MA20 remaining considerably higher. This configuration signals strong downside momentum and suggests that sellers remain in control.
Immediate support is located around $106.12–$106.45. A decisive break below $106.12 could expose the next support zone around $105.43.
On the upside, initial resistance is located around $106.77–$107.03, followed by $107.92. A recovery above $107.03 would indicate that selling pressure is beginning to ease, while a move above $107.92 would be required to significantly improve the short-term outlook.
Outlook is overall bearish. The breakdown below the $108 area suggests that the previous recovery has lost momentum. Unless Brent quickly reclaims $107.03, the risk of further downside toward $105.43 remains elevated.
.webp)
Source: STARTRADER app | Oil prices ease as Trump floats the idea of lifting sanctions on Russian oil
| Resistance | $107.03 | $108.00 | $109.24 |
| Support | $106.12 | $105.43 | $104.20 |
The S&P 500 is trading around 7,700, falling sharply after failing to sustain its recovery toward the 7,845 resistance level.
The moving averages confirm strong bearish momentum. The price is trading below the three moving averages MA(5), MA(10), and MA(20).
Immediate support is located around 7,688, the recent low. A sustained break below this level could expose the 7,673 area, followed by further downside if selling accelerates.
On the upside, initial resistance is located around 7,700–7,720, followed by 7,766. A recovery above 7,720 would suggest that selling pressure is easing, while a sustained move above 7,766 would be needed to improve the short-term technical outlook meaningfully.
Outlook is overall bearish. The sharp breakdown and price positioning below the moving averages favor further downside risks. However, the steep decline also raises the possibility of a short-term technical rebound. A sustained recovery above 7,720 would provide the first indication of stabilization.
.webp)
Source: STARTRADER app | Global equities under pressure following hot inflation reading from the US
| Resistance | 7,720 | 7,766 | 7,800 |
| Support | 7,673 | 7,631 | 7,600 |
Risk Disclaimer: This material is provided for informational purposes only and does not constitute a recommendation or investment advice. Trading financial instruments on margin involves substantial risk and may not be appropriate for all investors.
STARTRADER is a global multi-asset broker empowering retail and institutional partners to access global markets through a range of platforms, including MetaTrader, STAR-APP, and STAR-COPY.
Select the categories and companies you wish to follow directly to your person rss feed.
Create Custom RSS FeedSign up and join over 5,000 professional members who receive personalized news alerts, curated professional connections, and more for free!
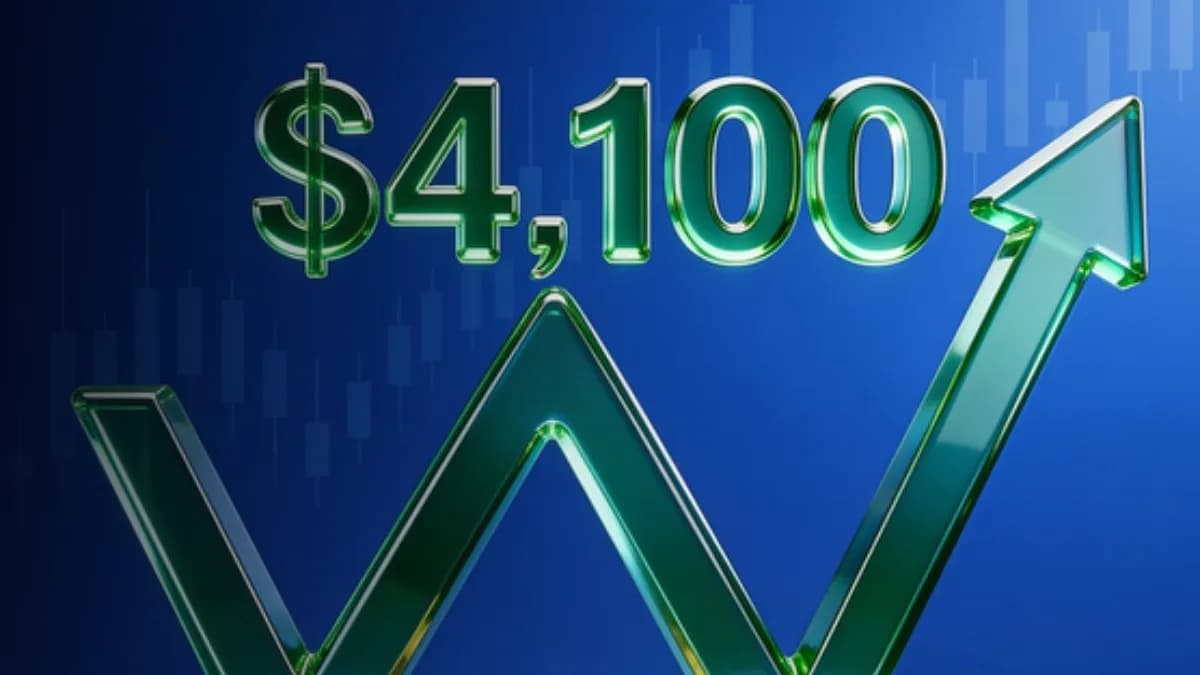
Gold is trading around $4,150, recovering sharply after falling to a recent low of $4,073.

Global semiconductor and technology stocks sold off sharply on Thursday, with South Korea’s SK Hynix plunging over 10% and Samsung Electronics falling more than 8%.
Learn gold market structure to identify bullish, bearish and ranging XAUUSD trends using higher highs, higher lows, lower highs and lower lows, support and resistance.
Axi has launched an MCP integration connecting eligible MT5 accounts to Claude, allowing clients to access live market data, track positions, execute trades and update risk parameters through the AI assistant developed by Anthropic. Available to eligible Axi clients with an active MT5 account. Setup runs via Claude.ai.
Movantis has selected Integral to extend its FX liquidity offering for institutional clients including banks, payment networks and digital asset operators, adding an institutional trading platform, direct-to-client API trading and API connectivity into a third-party multi-dealer venue, supporting regional expansion.
Running a venue around the clock is the easy part. Pricing risk when the market underneath it is shut is not. Lars Holst, CEO of GCEX explains how to manage risk in 24/7 markets.
ATFX has released its Q4 2026 Trader Magazine, offering a closer look at the macroeconomic and market forces that could shape trading conditions in the final quarter of the year.
LSEG has announced a collaboration with NVIDIA that lets financial institutions analyse years of LSEG Tick History data in seconds using NVIDIA cuDF on GPUs, without creating another full copy of the dataset. Tick History holds 110 trillion rows across 100 million instruments and more than 580 venues and contributors.
Standard Chartered has launched a cryptocurrency trading solution letting eligible affluent clients buy and sell Bitcoin and Ether through existing bank accounts. Built with Zodia Markets and regulated by VARA, it launches first for Professional Investor clients in the UAE, with other markets to follow over time.
WTI crude oil breaks above daily resistance after rejecting weekly support. Explore key price levels, breakout confirmation, and the potential 100.305 target.