just now

Liquidity Finder Ltd is incorporated in England and Wales, company number 10610740, registered address 167-169 Great Portland Street, Fifth Floor, London W1W 5PF, United Kingdom.
Published: just now


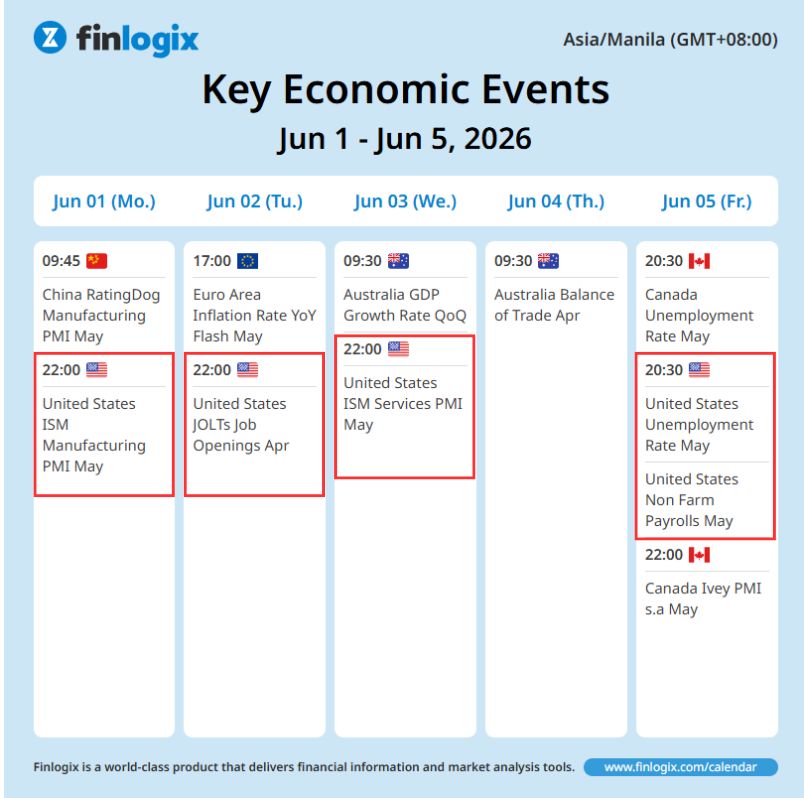
Big economic news drives massive market direction. If you want to trade safely, you must pay close attention to the fundamental data coming out of the United States.
Here are the high-impact events that can potentially drive NZDUSD Breakout of consolidation conviction:
These red-folder events continue to dictate Gold’s short-term volatility and directional conviction.
Notes: This high-impact news will only serve as a catalyst for trade setups on Gold.
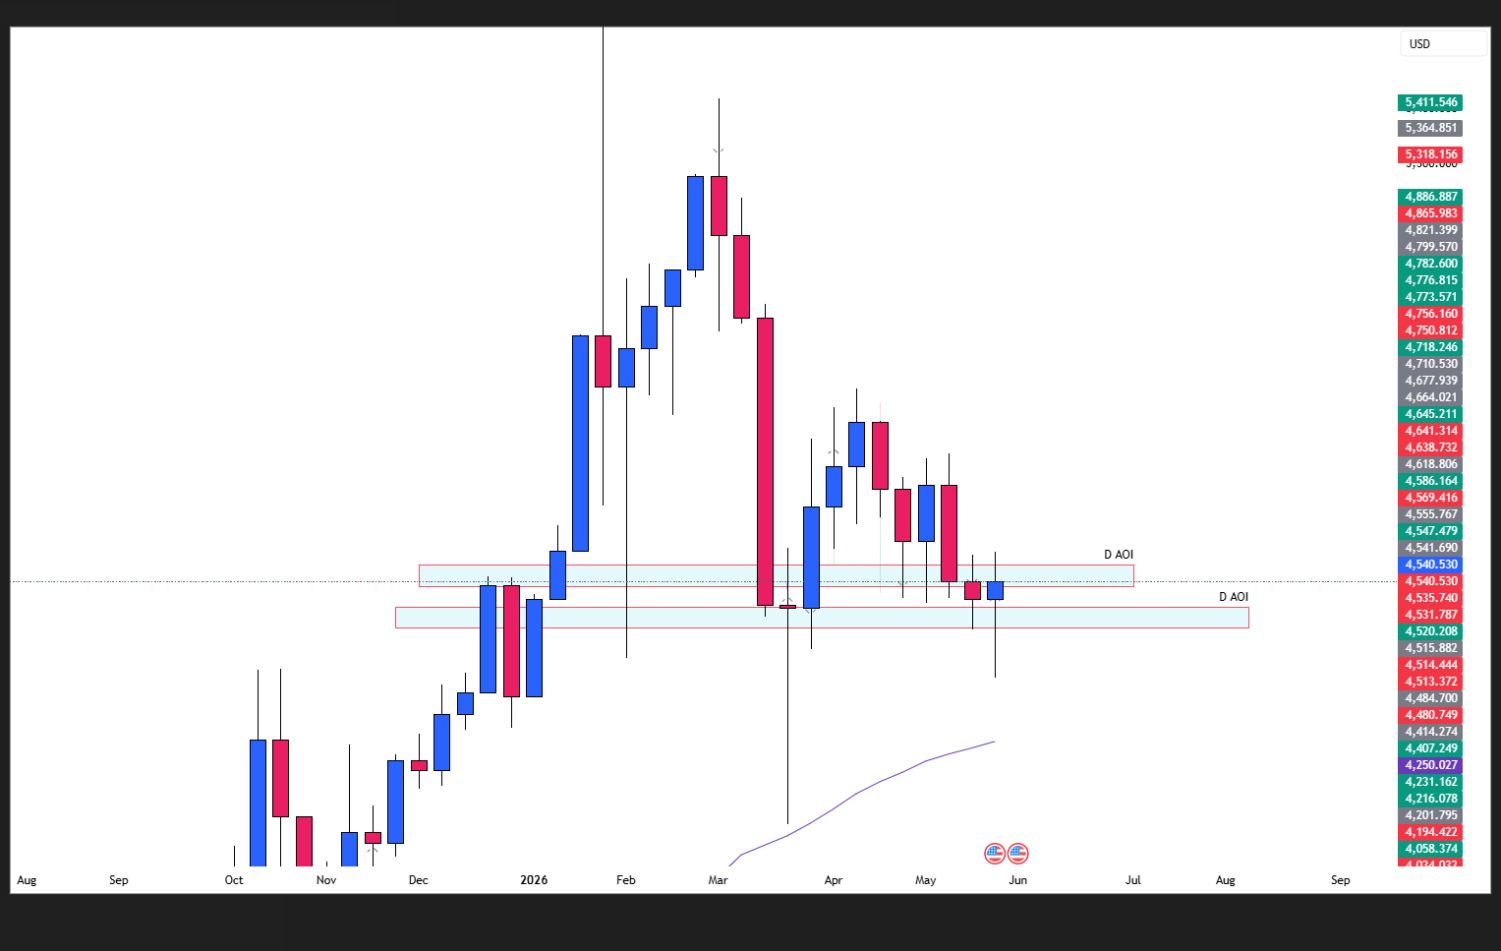
Weekly Chart Simple Price Action Analysis
The weekly chart on Gold (XAU/USD) remains bullish after forming a lower high, buyers hold the exact area same at the price higher low structure. The price action at the weekly chart shows that in order for it to have its massive bullish push, it needs to create that double bottom patter for it continue creating a new higher low structure.
A breakout from this range could provide the next trading opportunity.
Want to learn how to identify market trends and structure using pure price action? Checkout my blog: How to Step-by-Step Swing Trade Gold (XAU/USD) with Pure Technical Price Action Analysis?
Here is what I notice on the weekly timeframe:
Want to learn how to identify candlestick confirmation? Check this blog: The Top Japanese Candlestick Patterns to Trade: Mastering Japanese Candlestick Confirmation + Pairing with Price Action Analysis
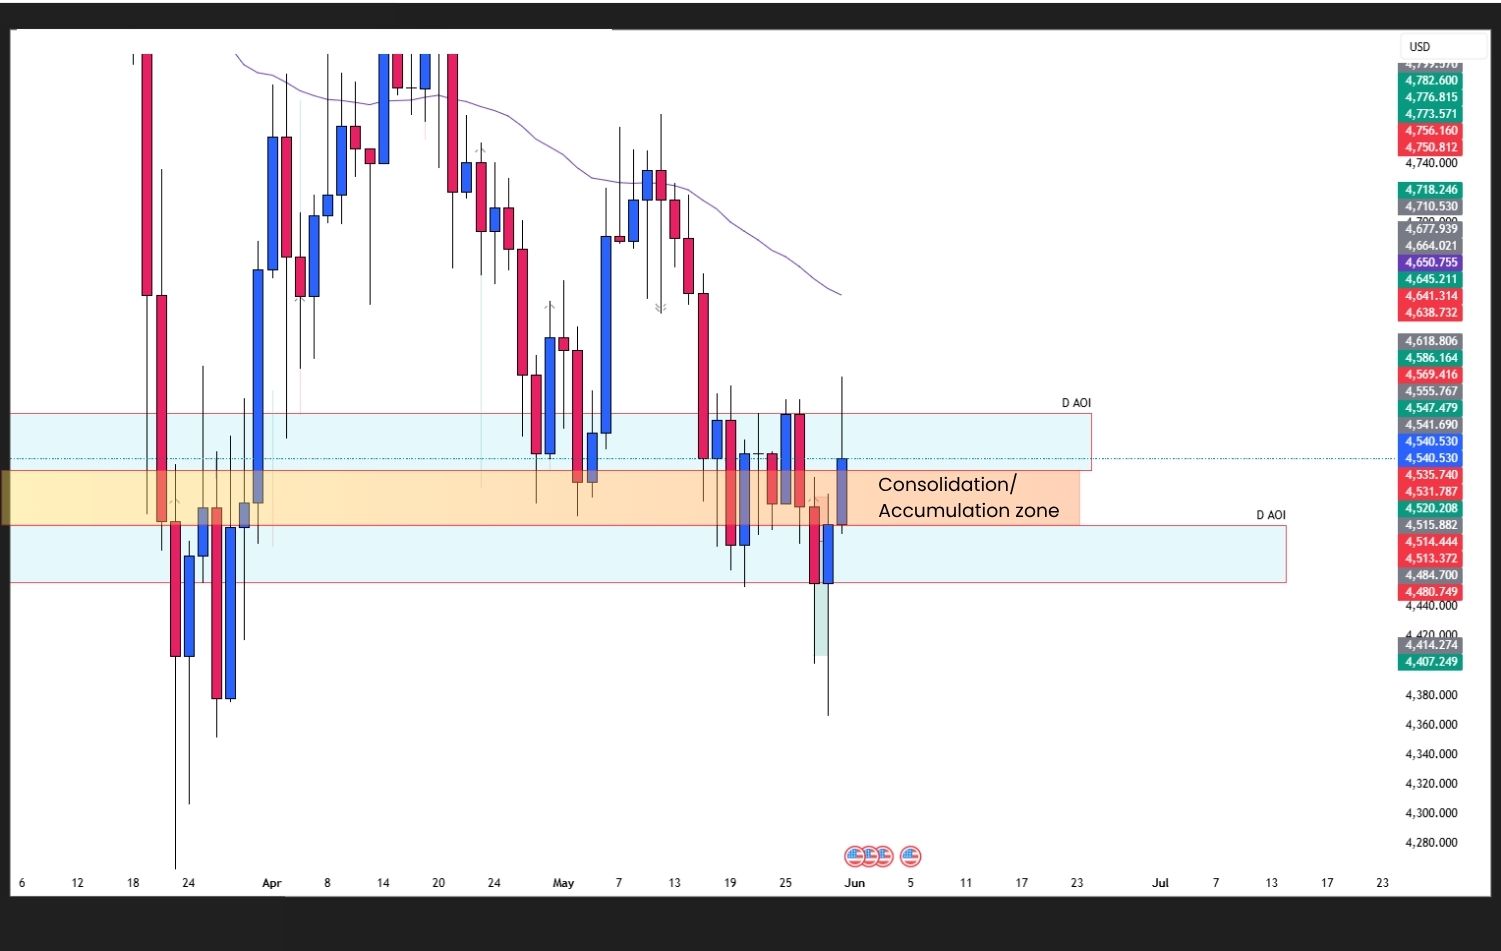
Daily Chart Simple Price Action Analysis
How Gold looks on daily chart using price action analysis?
On the daily chart, price still at a bearish structure, but price is back at the consolidation. A potential breakout either the daily support or resistance zone could give its momentum towards the exact direction.
Here is what I notice on the daily timeframe:
When the market is inside a consolidation or accumulation zone the price is going to move sideways making it to choppy to trade (mostly this is where wick outs could occur),
A break and retest pattern helps traders avoid forcing trades inside a consolidation range. Instead of guessing the next move, traders should wait for the price to break a key level (whether resistance level or support level) and retest it before entering.
Want to learn more about the break and retest pattern setups? Check out these blogs:
Break and Retest: How to Capitalize on Repetitive Patterns in Trading
Break and Retest: Break and Retest: A Simple Repetitive Price Action Pattern?

Daily Chart Simple Price Action Analysis. Bullish Bias Anticipation
Bullish momentum could occur in Gold if:
Note: This bullish trade idea on Gold is considered a high-probability setup since it does align with the overall bearish trend of the market.
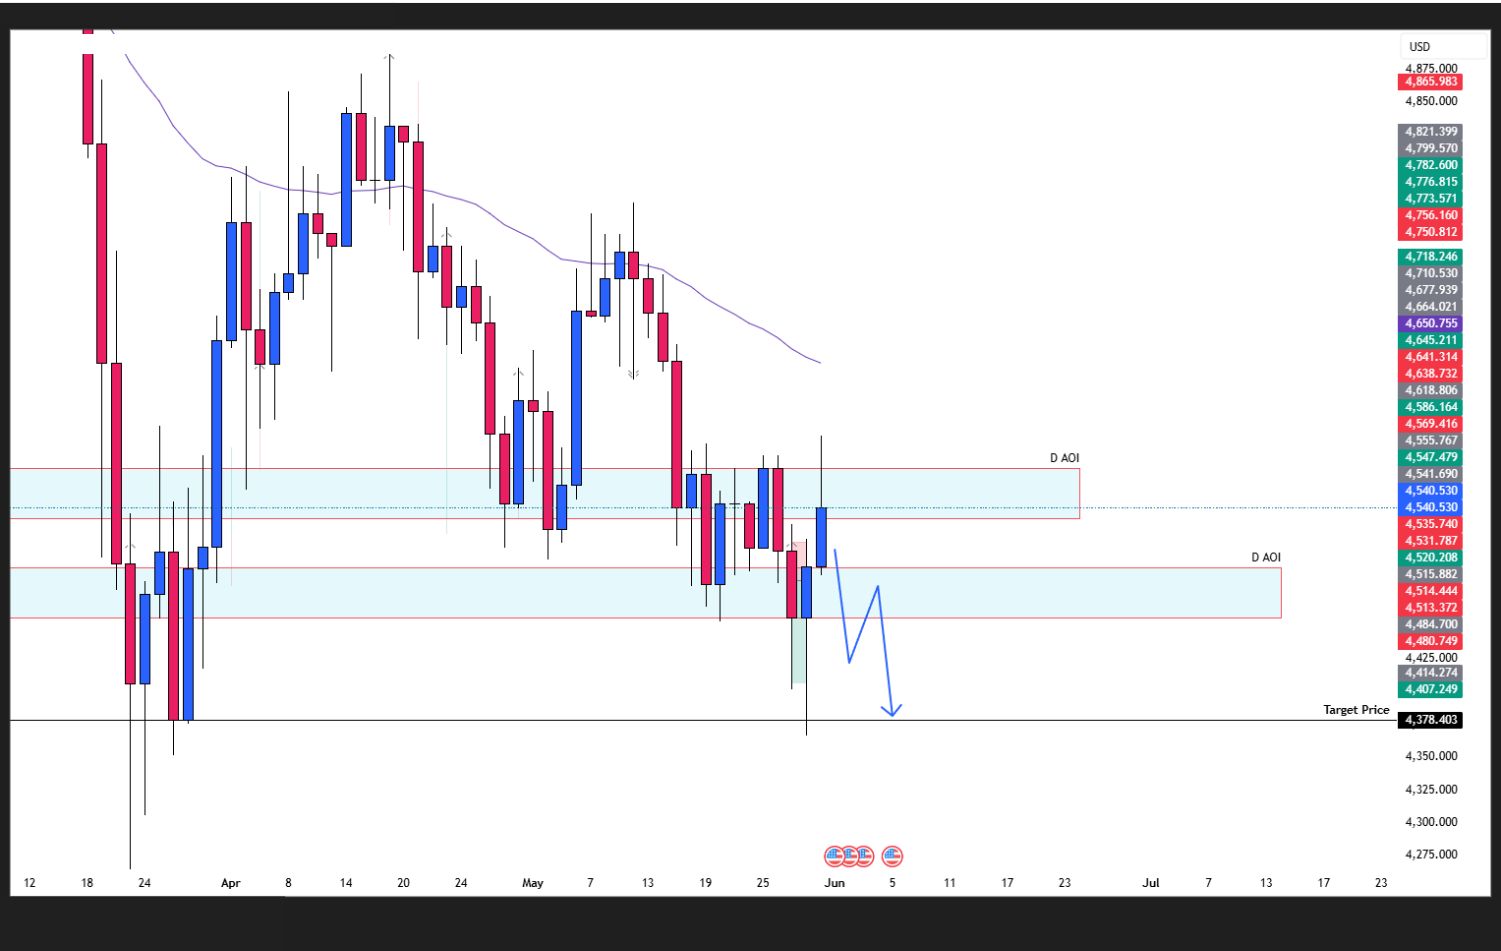
Daily Chart Simple Price Action. Bearish Bias Anticipation
Bearish momentum could occur in Gold if:
Note: This bearish trade idea on Gold is considered a low-probability setup since it did not align with the overall trend, high-risk setup is less favorable.

Gold is back and stuck again inside consolidation, so there’s no need to rush trades. Let the market make the first move, then look for a clear break and retest before entering.
This week’s high-impact news could be the catalyst that drives the next big breakout move.
Remember news creates volatility, while price action provides the clear bias or setup!
Stay patient, trust your plan, manage your risk, and when the market approaches our exact setup, never second guess to execute!
Now you already the bullish and bearish setups for Gold (XAU/USD) this week,
For more in-depth market breakdowns, real-time analysis, and structured learning content, you can join our Discord community inside ACY Server:
Discord Server - ACY Securities Server
Start your live trading journey today!
• Trade Forex, indices, gold, crypto and other global markets
• Access powerful platforms including ACY, MT4, MT5, and Copy Trading tools
Move from learning simple price action to executing it in the real market with confidence!
Create an Account. Start Your Live Trading Now!
Ready to learn simple price action strategy? Here’s how to do it step by step:
Ready to learn and capitalize the repetitive patterns in the markets? Here’s how to do it step by step:
Gold is still one of the most traded assets, here’s how to trade it with confidence:
Your mindset is what separates steady growth from costly mistakes. Focus on these essentials:
Not sure where to begin? Here’s a simple roadmap to guide you:
By building step by step; from basics → real trading → mastering the craft, you’ll gain clarity, confidence, and steady progress without ever feeling overwhelmed.
Follow me for more daily market insights!
Ruffy Grant B. Capacio - LinkedIn
Disclaimer:
Trading forex and derivative instruments involves substantial risk and may not be suitable for all individuals. Only use funds that you are prepared to lose. It is important to understand how these markets work and the risks involved before trading, and to seek independent financial advice if needed. All market analysis and insights shared are intended for educational and informational purposes only and should not be considered financial or investment advice. June 1, 2026
ACY Securities is one of Australia's fastest growing multi-asset online trading providers, offering ultra-low-cost trading, rock-solid execution, technologically superior account management and premium market analysis.
Select the categories and companies you wish to follow directly to your person rss feed.
Create Custom RSS FeedSign up and join over 5,000 professional members who receive personalized news alerts, curated professional connections, and more for free!
Sterling steadies after political uncertainty rattled gilt markets, while EUR/USD and EUR/GBP approach key technical levels ahead of today's European session.
GBP/AUD remains trapped in a well-defined bearish trend on both the weekly and daily timeframes.
Discover the key drivers, technical levels, and central bank expectations shaping the EUR/USD trend as the ECB prepares to hold rates and markets watch for a potential breakout.
Sydney-based multi-asset broker ACY Securities has introduced PAXGUSD, a new CFD instrument that allows clients to trade tokenised gold against the US Dollar 24 hours a day, seven days a week. The instrument is available across MetaTrader 4, MetaTrader 5, and the ACY Trading Platform.
Binance has lowered its VIP 3 Wallet Assets threshold from $3 million to $1 million and will now count OTC Spot Trading Volume at a 4x multiplier toward VIP qualification, removing the previous VIP 4 cap and allowing eligible users to progress through the full tier framework up to VIP 9.
Retail futures trading leader NinjaTrader Group has appointed Mark Omens as Senior Vice President, Commercial Strategy, bringing a 25-year veteran of derivatives marketplace CME Group into a newly created role focused on exchange partnerships and enterprise growth.
Gold Price Action Forecast: Will XAU/USD Drop to $3930? Meta Description: Read our Gold price action forecast to see if XAU/USD will drop to $3930.
BitDelta Securities Financial Services LLC (“BitDelta Securities”) today announced that it has received full regulatory approval from the Capital Market Authority (“CMA”) of the United Arab Emirates under the Category 5 — Arrangement and Advice license framework (License No. 20200000439). The approval follows the firm's receipt of In-Principal Approval earlier this year and represents the successful conclusion of the CMA's full licensing process, including the satisfaction of capital requirements, governance appointments, and operational setup.
Crypto.com has received a $400 million strategic investment from Citadel Securities, valuing the firm at $20 billion. It marks the first institutional funding round in the company's history, aimed at accelerating its expansion into tokenised securities, derivatives and other asset classes.
WTI’s pullback into $79–82 is the first major test of the bullish Elliott Wave count, with buyers targeting a renewed break above $85.


