just now


Liquidity Finder Ltd is incorporated in England and Wales, company number 10610740, registered address 167-169 Great Portland Street, Fifth Floor, London W1W 5PF, United Kingdom.
Published: just now
Every trader can draw a box, but not every box is an order block. The difference is intent and precision. In practice, you’re mapping where large players last accumulated or distributed before a decisive move, which is why order blocks sit naturally within Smart Money Concepts as footprints of institutional intent.
Accuracy isn’t drawing more zones. It’s isolating the last opposing candle before true displacement and a clean structural shift. When you align your box with displacement and structure, you turn noise into a plan and remove guesswork from execution in a way that mirrors the discipline behind Anatomy of a Perfect Execution.
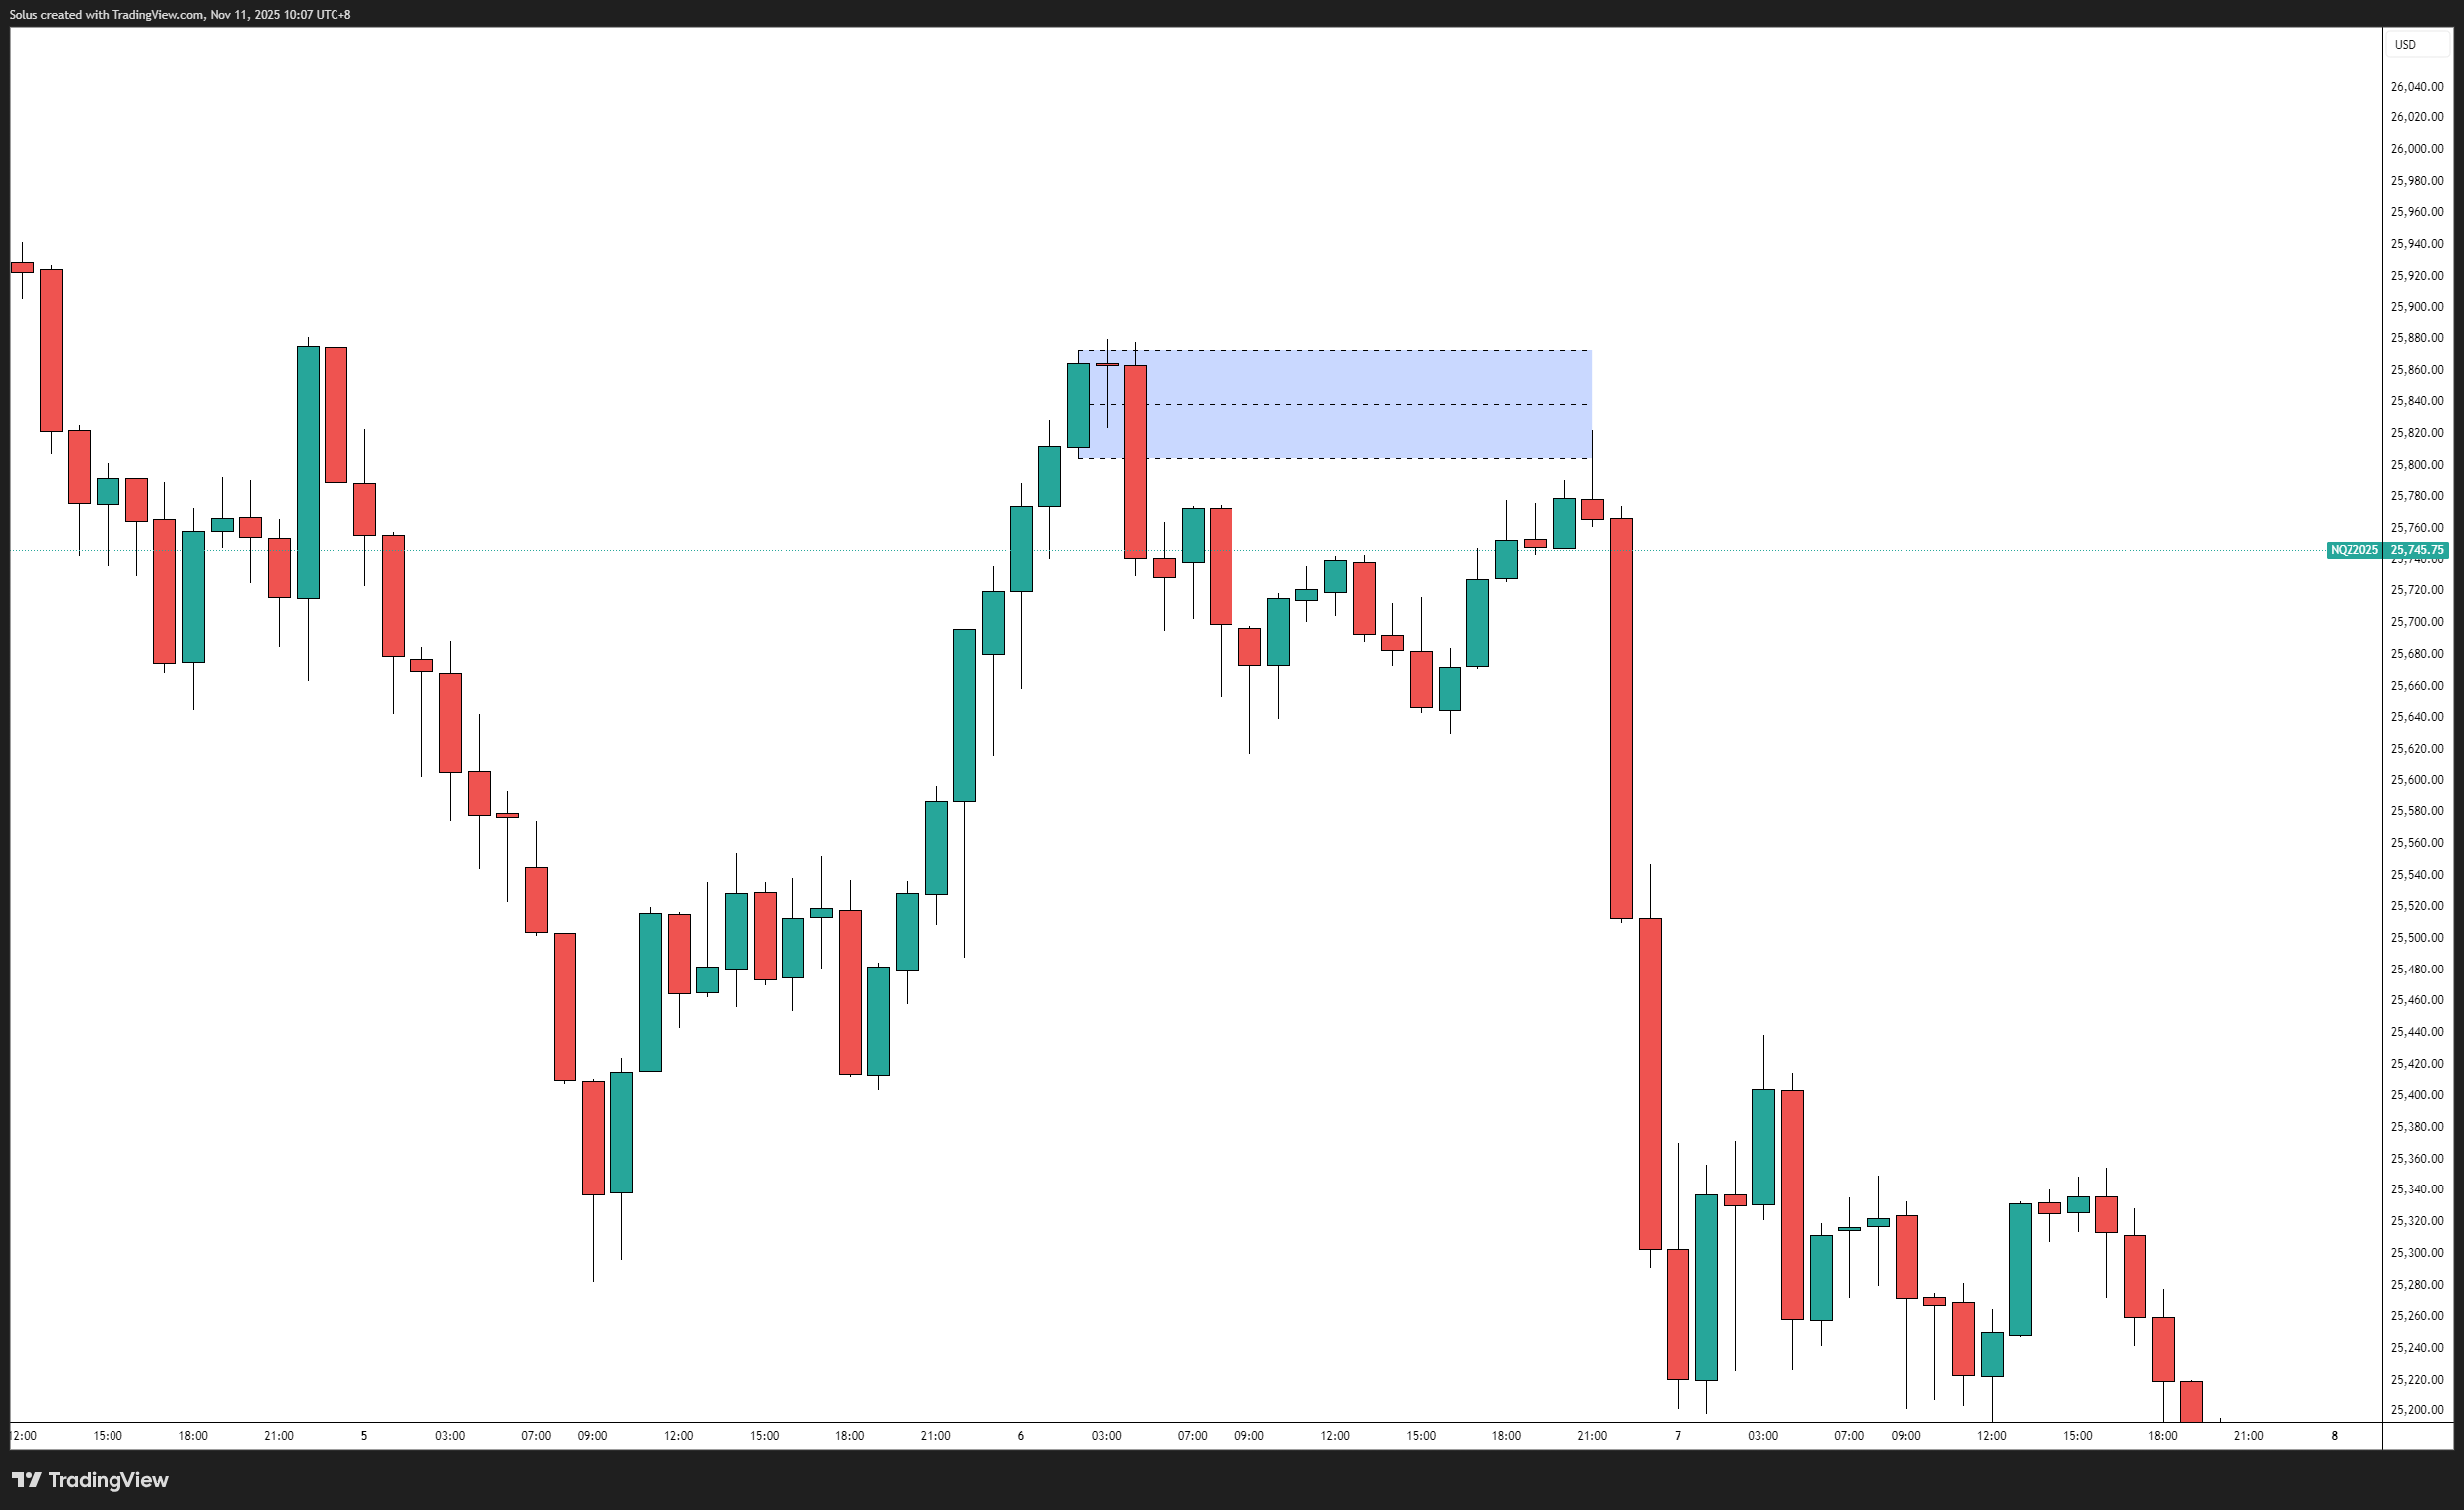
Zoom out and find the last opposite candle before a clear impulsive run that broke structure.
Draw the base order block from the candle’s open to close first. Leave wicks aside for now. This keeps the zone grounded in where most decisions actually printed on the tape.
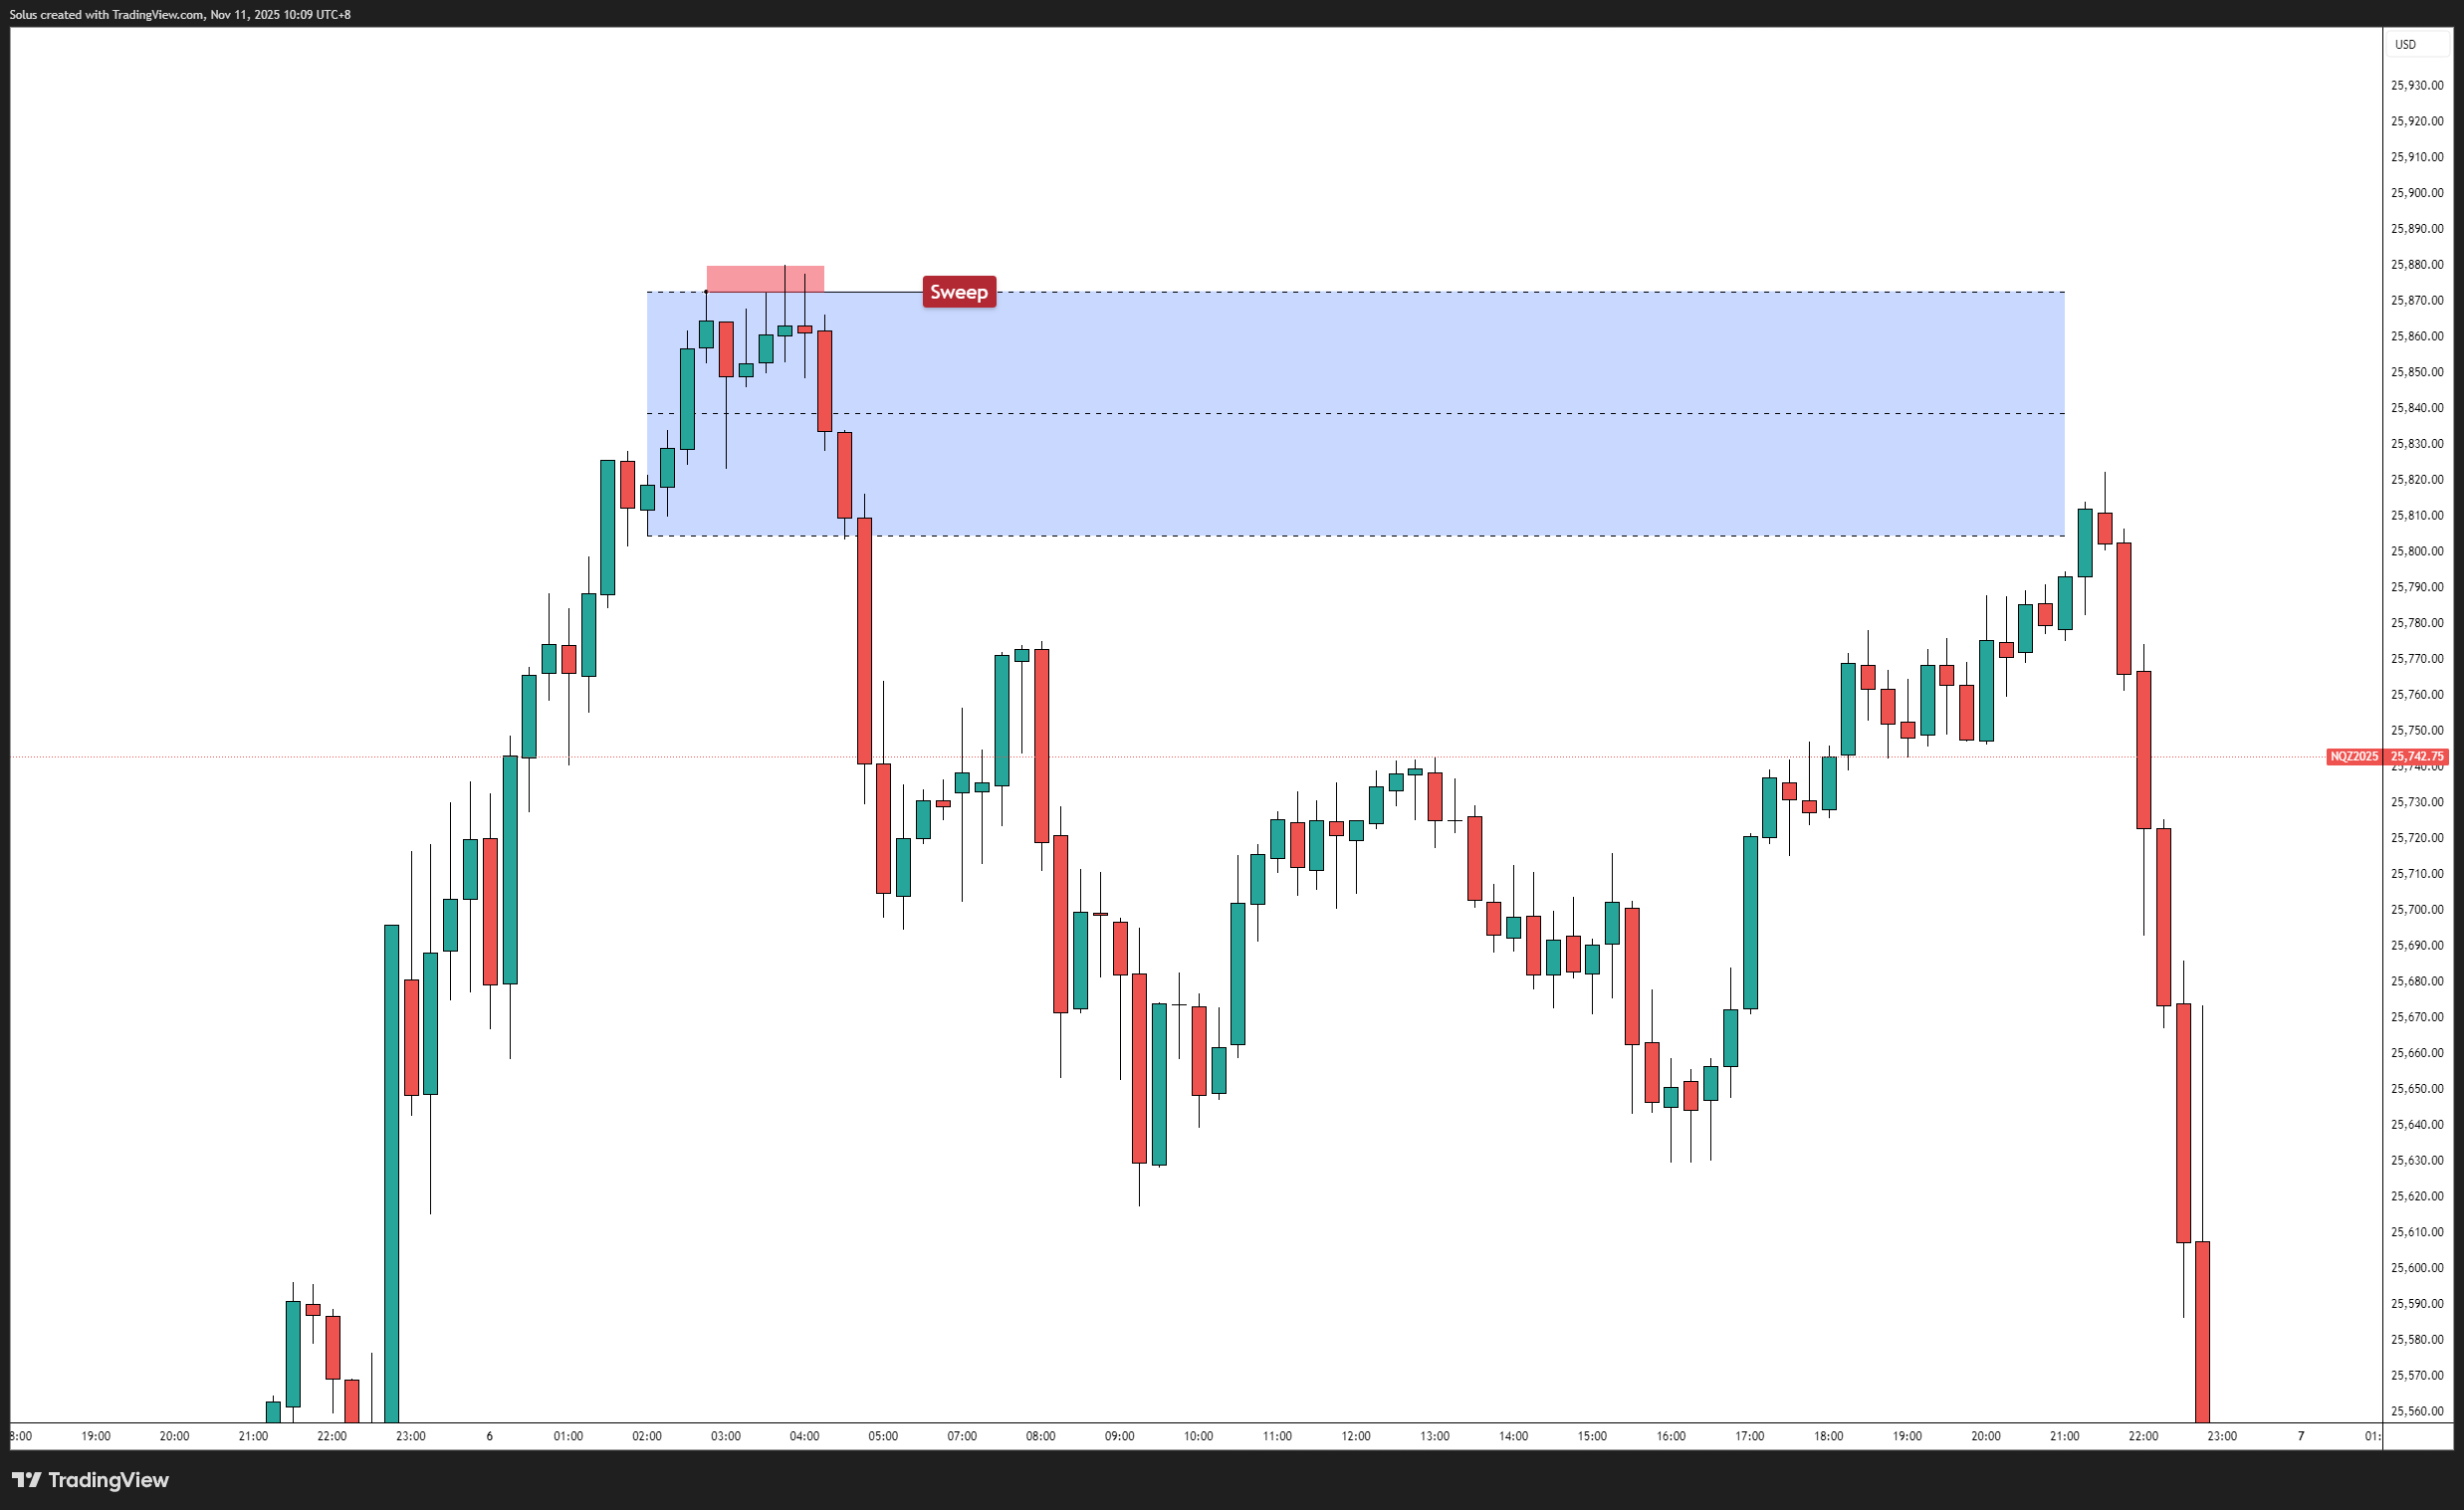
Once the base is set, drop to M15 to tighten the range. You’ll often find a cluster of smaller candles forming the higher timeframe footprint. Prioritize the candle that initiated the displacement or shows the cleanest rejection wick. This top-down clarity is exactly why Multi-Timeframe Analysis is a core edge: it converts a broad zone into a surgical level.
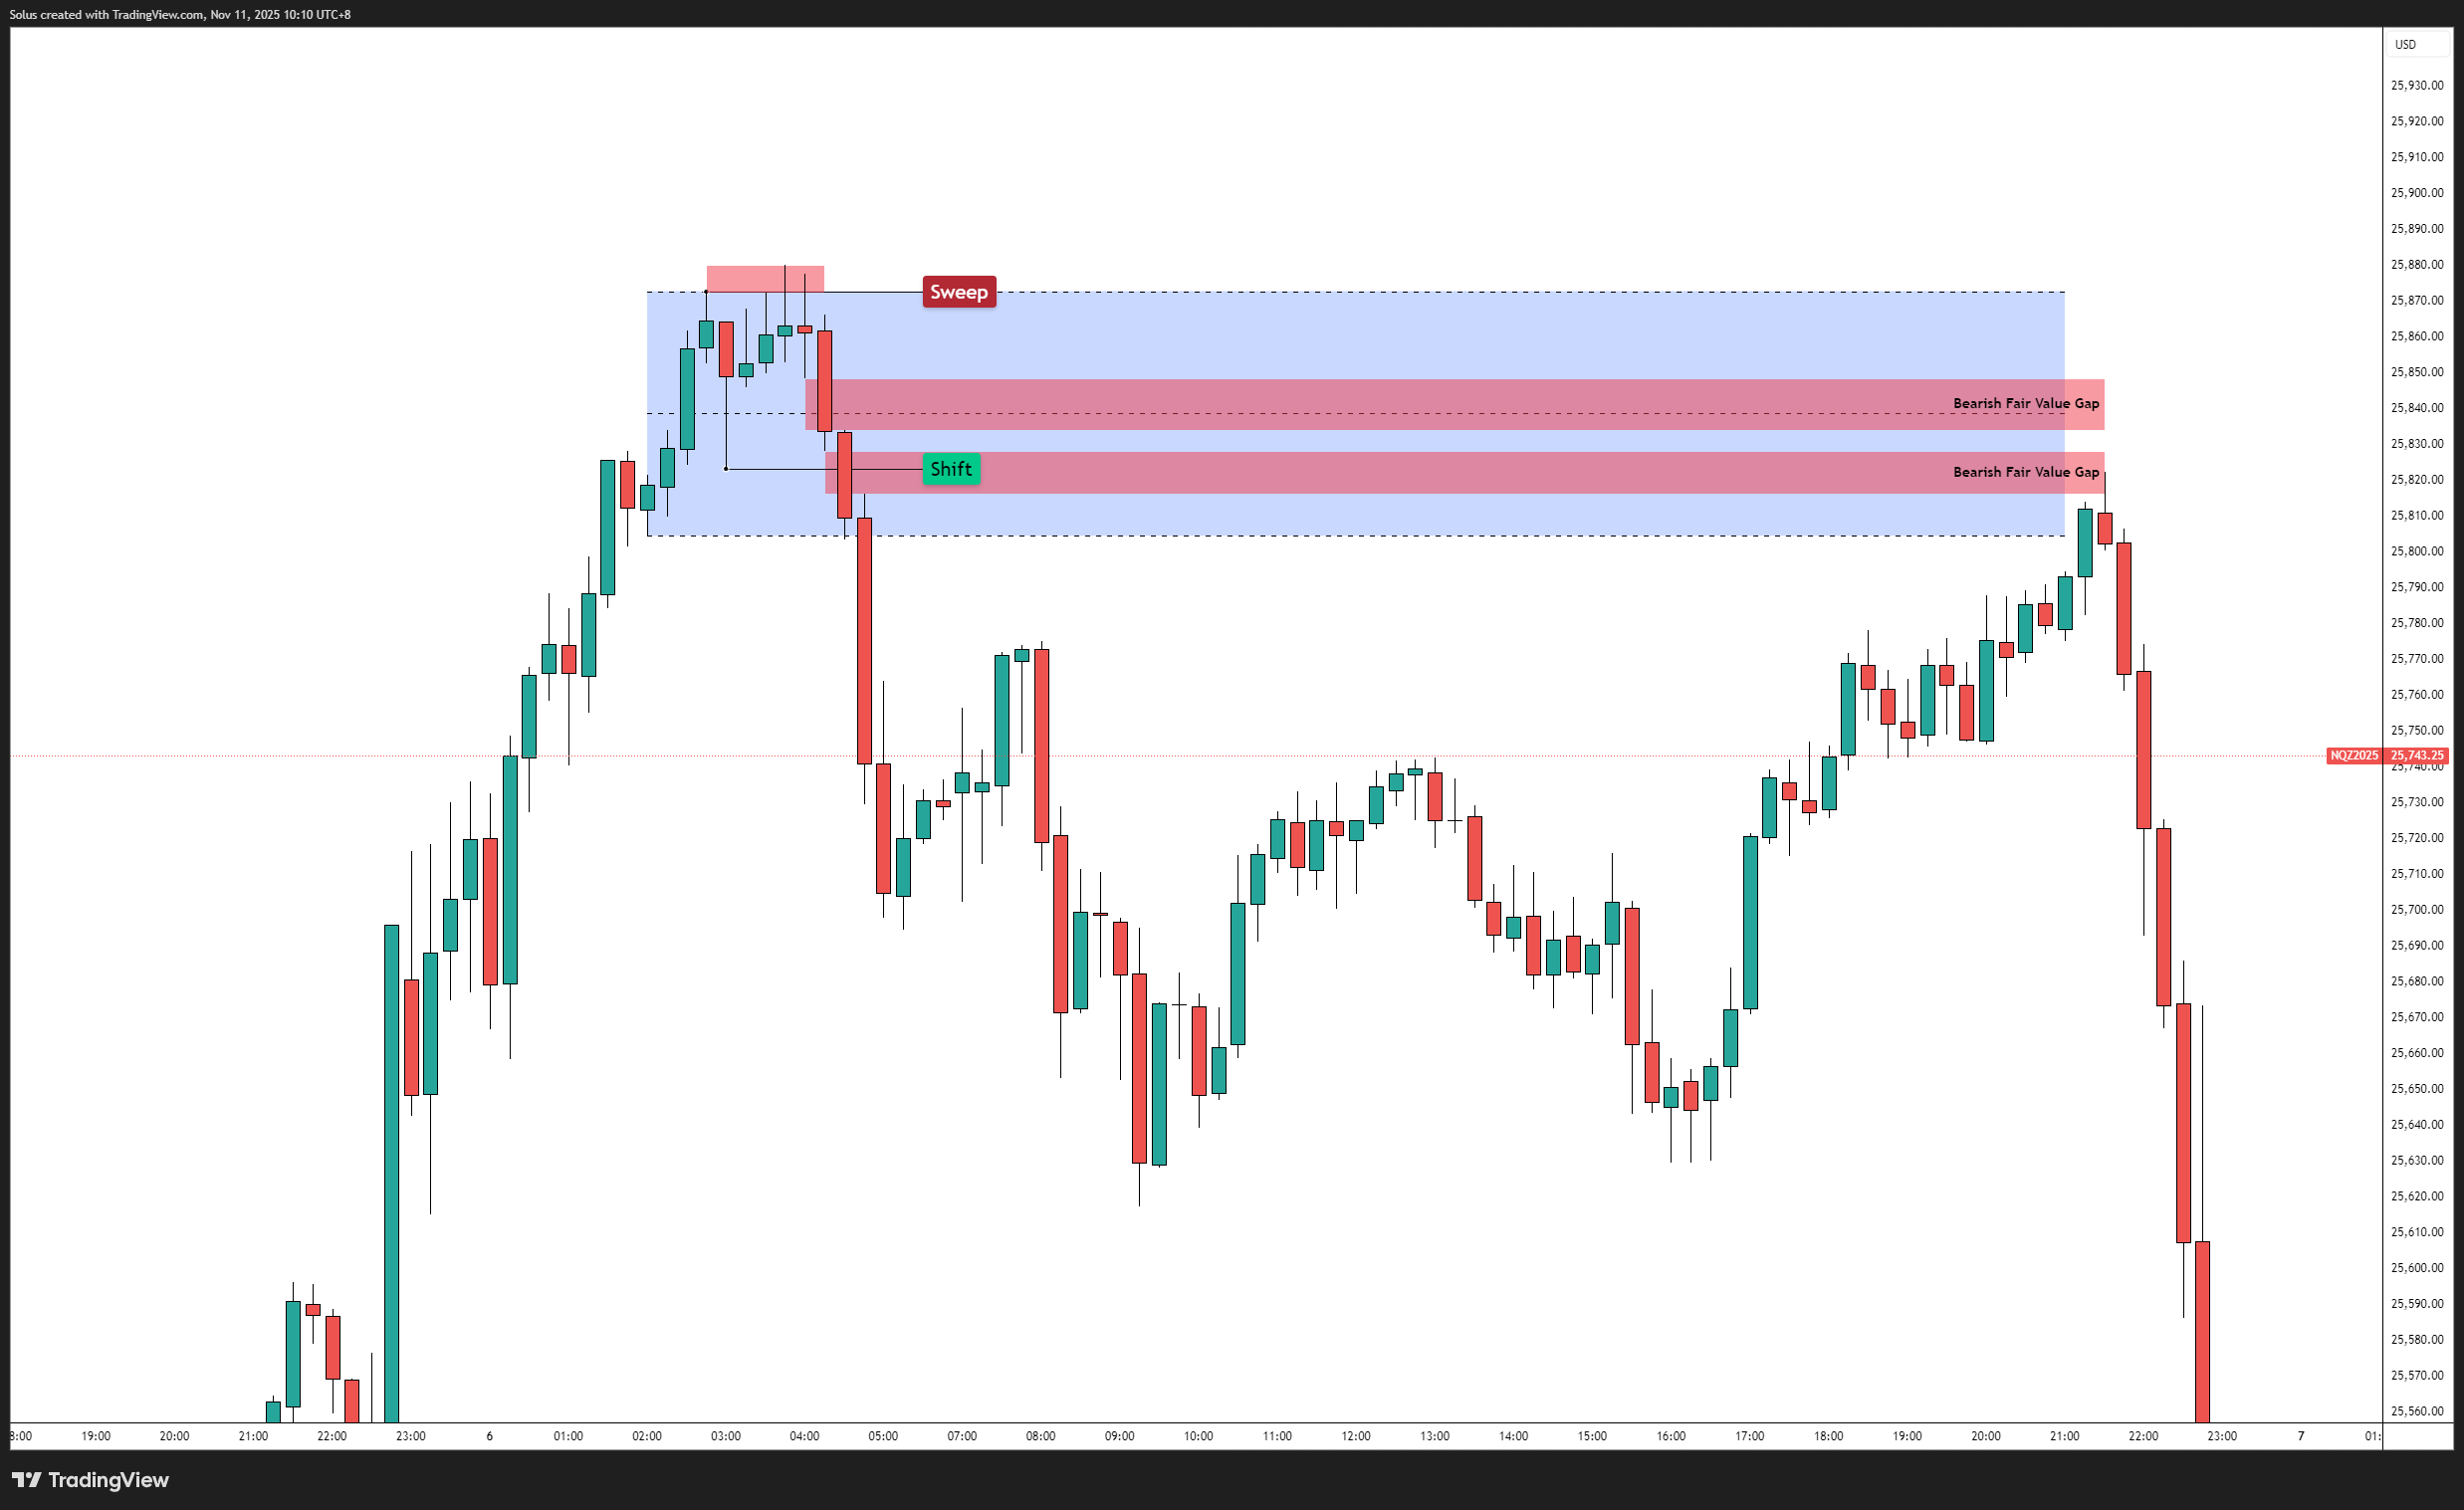
After a strong displacement, price often leaves an inefficiency. When your refined order block overlaps a nearby inefficiency, you have confluence that tends to magnetize price for rebalancing, as outlined in Fair Value Gaps Explained.
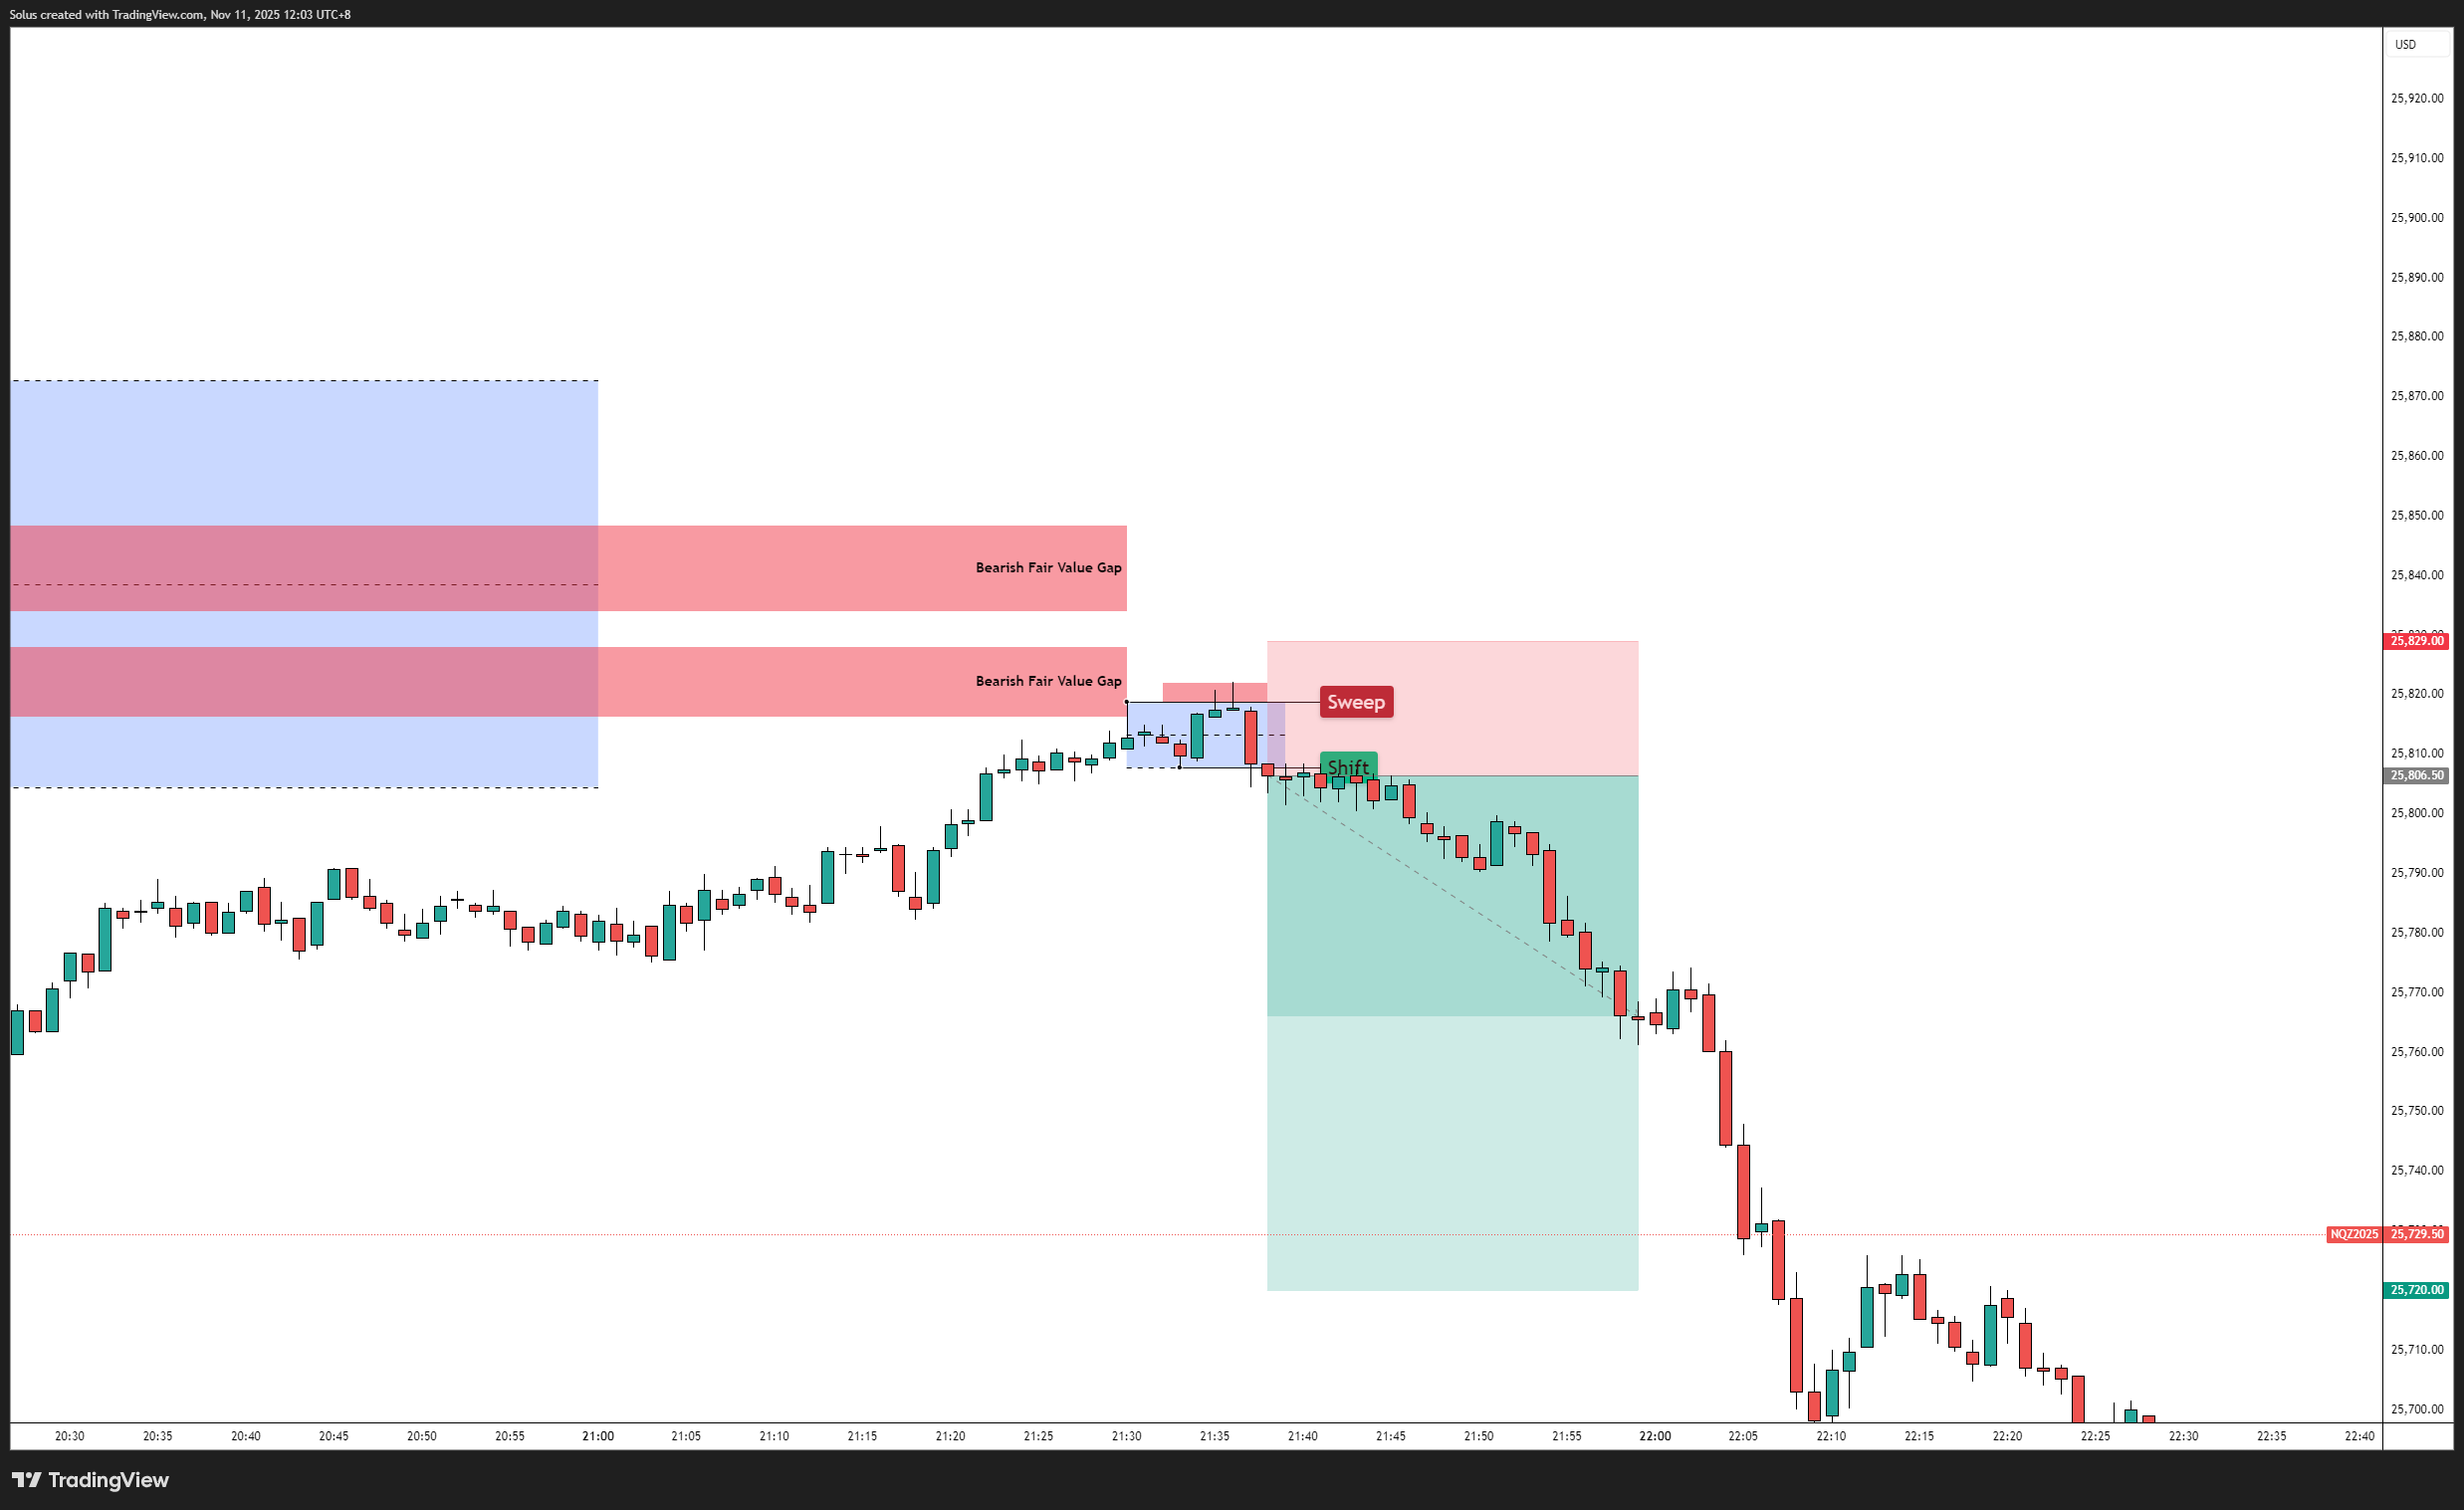
Drop to the execution timeframe to confirm, not to redraw. Inside the zone, wait for price to show its hand: a small structure shift, a micro iFVG, or a clean rejection wick. This is where a rules-based trigger excels, using a checklist similar to the cadence in The Confirmation Matrix.
Context decides.
Too many traders default to full wicks and end up with zones that are too wide. Start with the body, then extend to wick only if the story of a sweep is obvious.
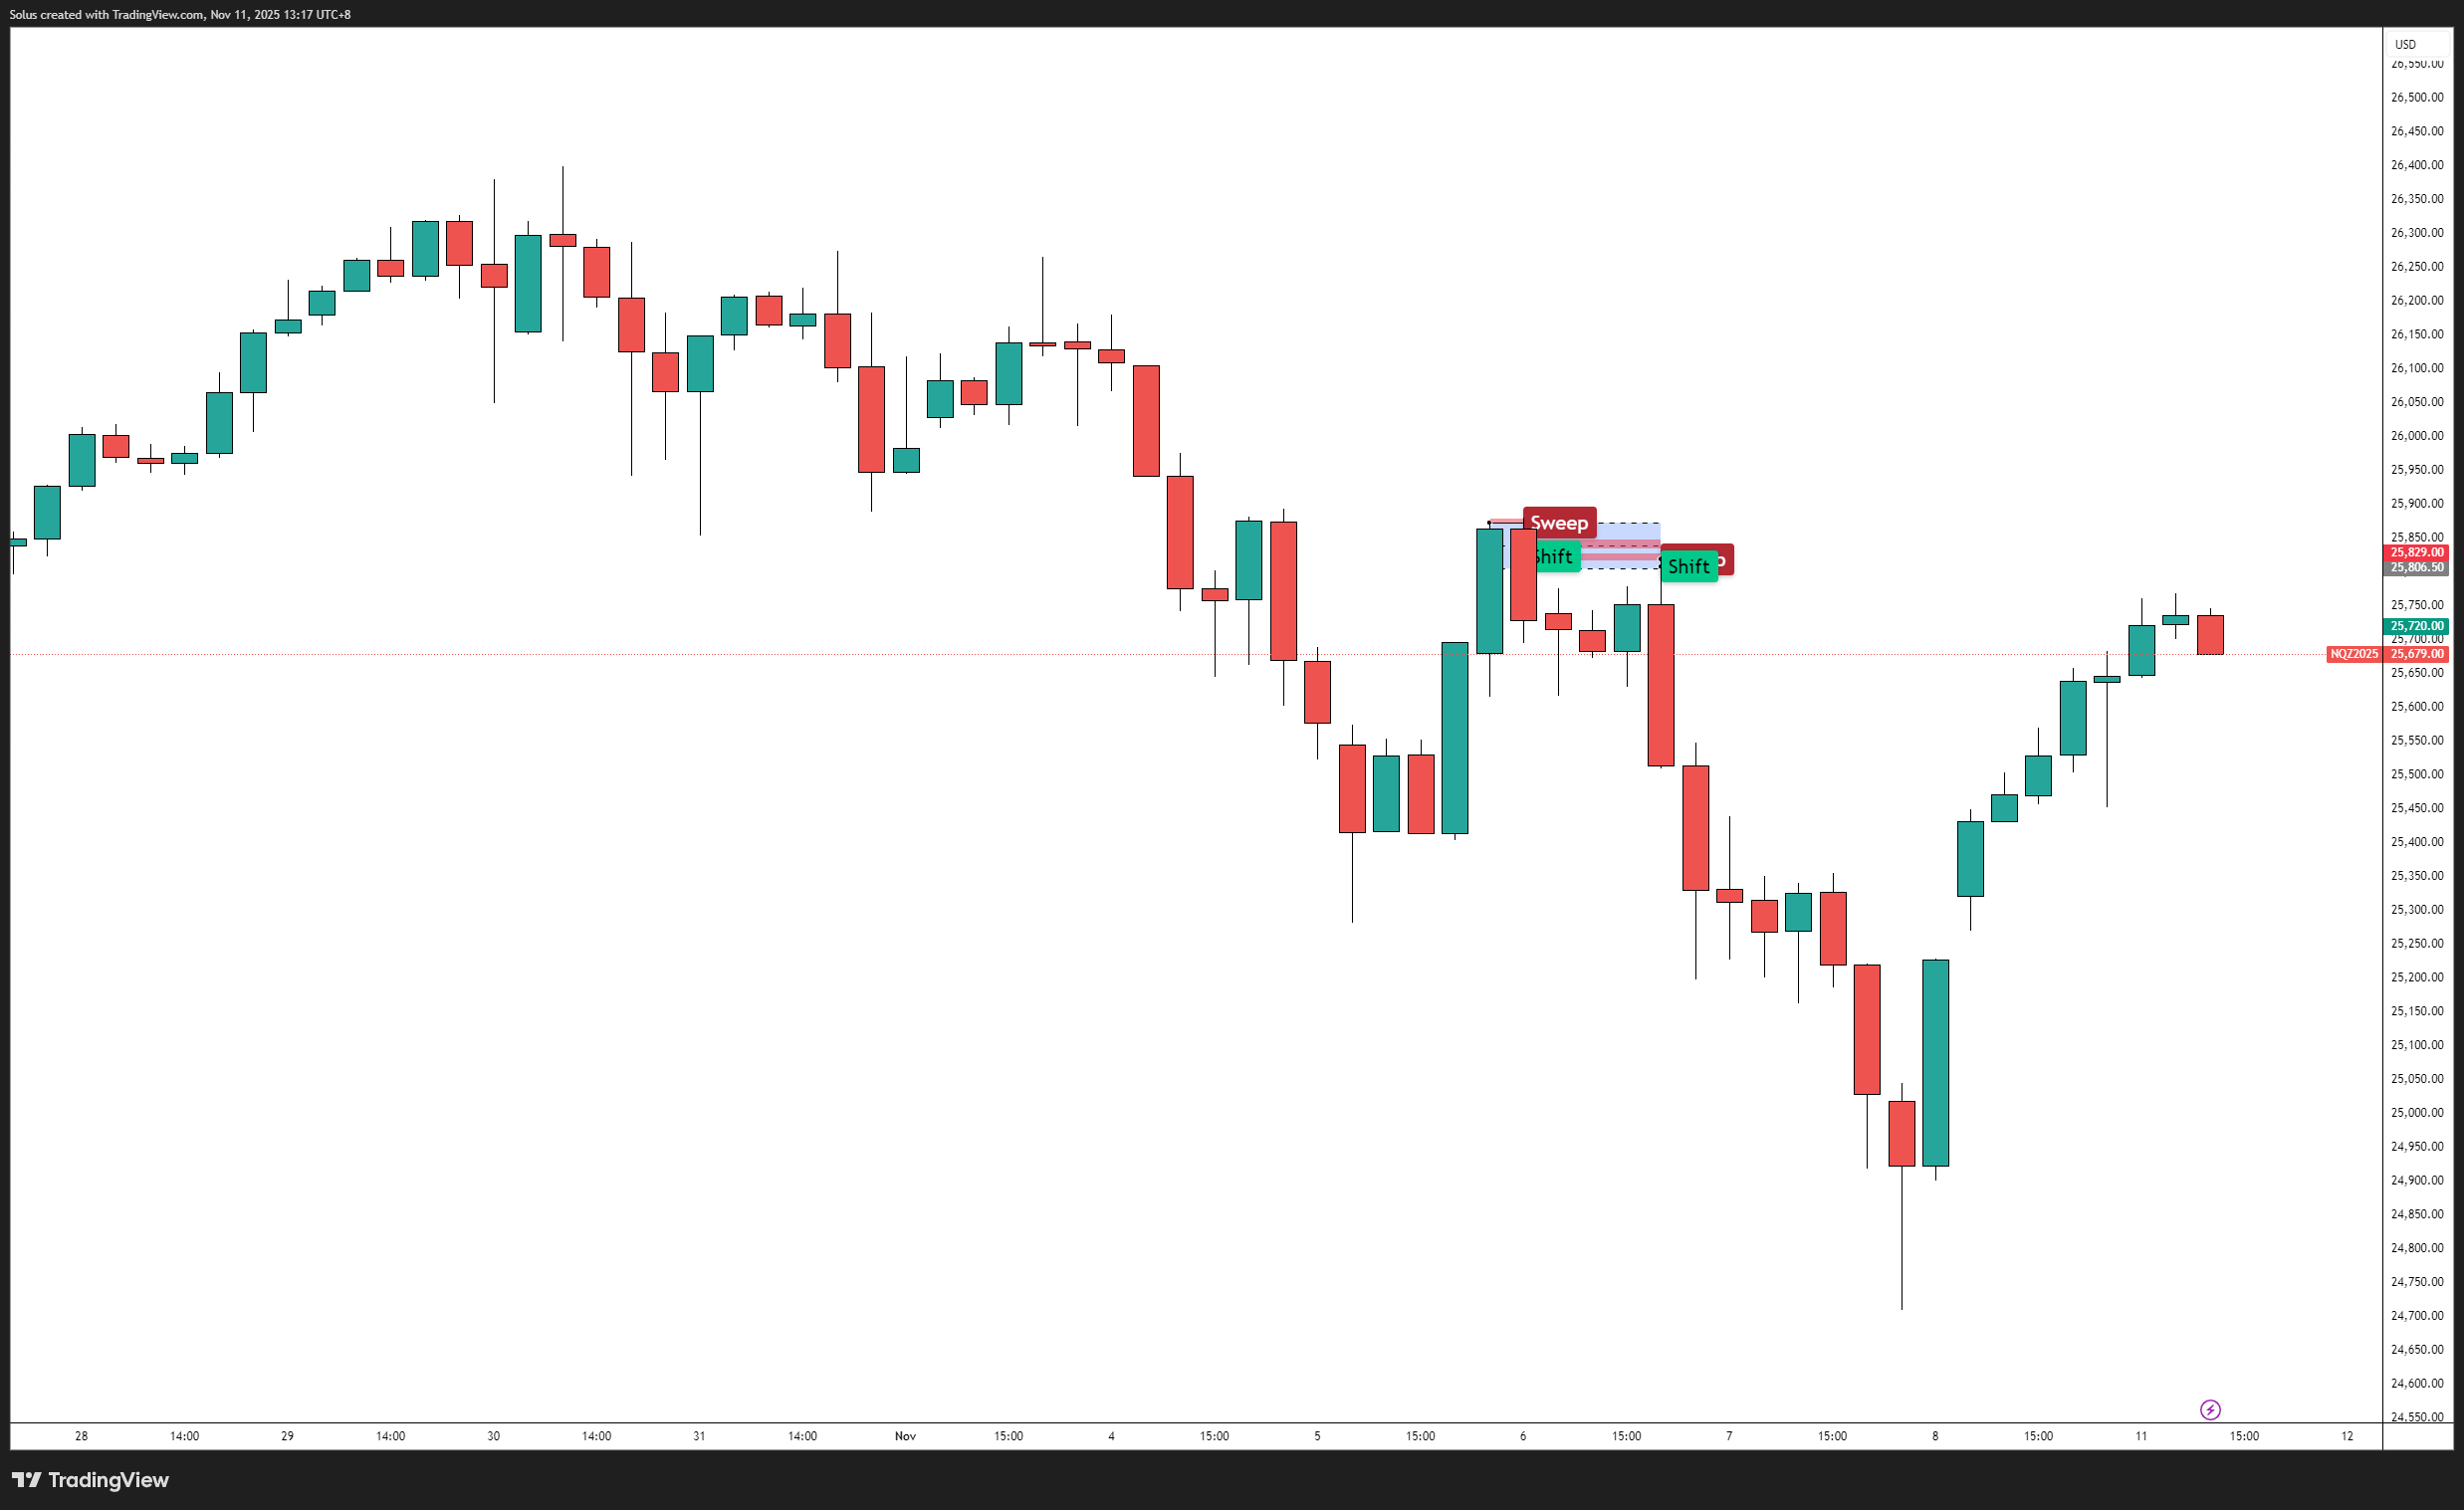
Order blocks are not standalone signals. They live inside a broader narrative of trend, liquidity, and inefficiency. Ask: Is the OB in premium or discount relative to the swing? Is it aligned with daily bias and clean space to target? Are you seeing the footprints that hint at larger flow, the kind of footprints you learn to read when you study Institutional Order Flow?
Think like an architect. A single misaligned line on the blueprint can compromise the whole structure. Your order block is that line. Precision creates symmetry in execution: the zone explains the impulse, the lower timeframe confirms the turn, and the trade plan stands on a solid foundation.
Accuracy is the bridge between theory and returns. Draw the base on the higher timeframe, refine with intent, confirm inside the zone, and only trade when the story is coherent across timeframes. Once you know how to spot structure and order flow with confidence, it’s time to start trading live and apply these concepts on real charts.
The last opposing candle before an impulsive displacement that breaks structure. No displacement, no valid OB.
No, but OB + FVG confluence often improves the reaction quality because price is drawn to rebalance inefficiency.
Only for entries. Over-refinement can create analysis paralysis. Use higher timeframes to define, lower timeframes to confirm.
Context. Against the higher-timeframe trend, into heavy opposing liquidity, or without confirmation, expect a higher failure rate.
It’s time to go from theory to execution!
Create an Account. Start Your Live Trading Now!
Looking for step-by-step approaches you can plug straight into the charts? Start here:
Sharpen your edge with proven tools and frameworks:
News moves markets fast. Learn how to keep pace with SMC-based playbooks:
From NASDAQ opens to DAX trends, here’s how to approach indices like a pro:
Gold remains one of the most traded assets - here’s how to approach it with confidence:
Candlesticks are the building blocks of price action. Master the most powerful ones:
Ready to go intraday? Here’s how to build consistency step by step:
Markets swing between calm and chaos. Learn to read risk-on vs risk-off like a pro:
Step inside the playbook of institutional traders with SMC concepts explained:
Forex pairs aren’t created equal - some are stable, some are volatile, others tied to commodities or sessions.
If you’ve ever been stopped out right before the market reverses - this is why:
Mindset is the deciding factor between growth and blowups. Explore these essentials:
The real edge in trading isn’t strategy - it’s how you protect your capital:
If you’re not sure where to start, follow this roadmap:
This way, you’ll grow from foundation → application → mastery, instead of jumping around randomly.
Follow me for more daily market insights!
Jasper Osita - LinkedIn - FXStreet - YouTube
This content may have been written by a third party. ACY makes no representation or warranty and assumes no liability as to the accuracy or completeness of the information provided, nor any loss arising from any investment based on a recommendation, forecast or other information supplies by any third-party. This content is information only, and does not constitute financial, investment or other advice on which you can rely.
ACY Securities is one of Australia's fastest growing multi-asset online trading providers, offering ultra-low-cost trading, rock-solid execution, technologically superior account management and premium market analysis.

Select the categories and companies you wish to follow directly to your person rss feed.
Create Custom RSS Feed
just now
Sign up and join over 5,000 professional members who receive personalized news alerts, curated professional connections, and more for free!
PLUGIT announcing a new YOONIT UX/UI experience coming across all six modules.
The AI conversation in brokerage risk management is mostly led by vendors. Here is what a dealing desk actually needs to know — before signing anything.
The cost of capital is becoming a defining force in global markets. But are investors pricing in the full impact? With the Fed's policy outlook under scrutiny, major bank and semiconductor earnings approaching, and key inflation data on the horizon, markets face a critical week. In this week's BitDelta Pro Weekly Outlook, we explore the signals shaping market expectations and the factors that could challenge the prevailing narrative.
September's US inflation report could be a defining moment for the Federal Reserve's next interest rate decision. With headline inflation expected to accelerate while core inflation remains steady, the growing divergence raises an important question: Is inflation pressure becoming more widespread, or is energy driving the narrative? Ahead of the October 14 CPI release, BitDelta Pro Research examines the forces shaping inflation expectations, the signals policymakers may prioritise, and what the data could mean for the Fed's next move.
BingX has launched US stock trading through an integration with Alpaca, giving eligible users access to more than 7,000 US stocks and ETFs. Trades can be funded with USDT and USDC, start from $5 and run 24 hours a day, five days a week. A $200,000 Stocks Mystery Box promotion runs from 9 to 23 October 2026.
Bybit has opened stocks trading to eligible users, offering access to more than 1,000 U.S.-listed stocks and ETFs funded in USDC. Orders are executed through Alpaca, with 24/5 trading, fractional shares and zero commission on eligible trades, plus support for dividends and stock splits. Users must complete KYC checks.
AUDCAD price forecast tracks a bullish retest of 0.99265–0.99450 toward 0.99940, with a weekly support breakdown putting 0.98740 in focus.
Visa has received approval of its Application to Prepare from the People's Bank of China, allowing it to begin formal preparations to establish a domestic bankcard clearing institution in China. The company will now work to complete the process under PBOC regulations before starting domestic clearing operations in the country.
Plus500 has conditionally agreed to acquire Hedge Capital Markets, an SEC-registered US broker-dealer, marking its entry into US securities. The cash-funded deal supports a planned US super-app in Q1 2027 combining futures, prediction markets, stocks, options and ETFs, plus a new hub in New York.
MAS Markets has appointed Simon Naish as Head of APAC to lead its plans across the Asia-Pacific region. Naish brings over 30 years of experience in institutional banking and FX, most recently as Country Head at ATFX Global and previously 33 years at National Australia Bank (NAB) across Asia-Pacific and global markets.