just now


Liquidity Finder Ltd is incorporated in England and Wales, company number 10610740, registered address 167-169 Great Portland Street, Fifth Floor, London W1W 5PF, United Kingdom.
Published: just now
Anticipate the Bounce. Time the Breakout. Trade with Multi-Timeframe Confidence.
If you’re just joining the series, check out:
To show you how to anticipate where price is likely to react, bounce, or break — by using the 20 EMA and 50 SMA as dynamic support/resistance zones, combined with multi-timeframe analysis and lower timeframe breakout confirmation.

Most traders use MAs to confirm trend.
But smart traders know that MAs often act as magnet zones — places where price pauses, bounces, or reverses.
Especially the:
These areas often attract:
“Don’t just wait to see if price bounces. Anticipate where and why it might bounce — then look for confirmation.”
Go to the H1 or H4 (or Daily if you’re a swing trader):
These levels become your anticipated bounce areas on the lower timeframes.
Note: You could use a much lower timeframe like the 15-minute to serve as your trend confirmation timeframe and the 5-3-1-minute as your execution if you are executing in a scalping-based approach.
On the M15 or M5:
This combo gives you a multi-timeframe sniper entry — low risk, high precision.
Another secret: Wait for a sideways + breakout at the LTF.
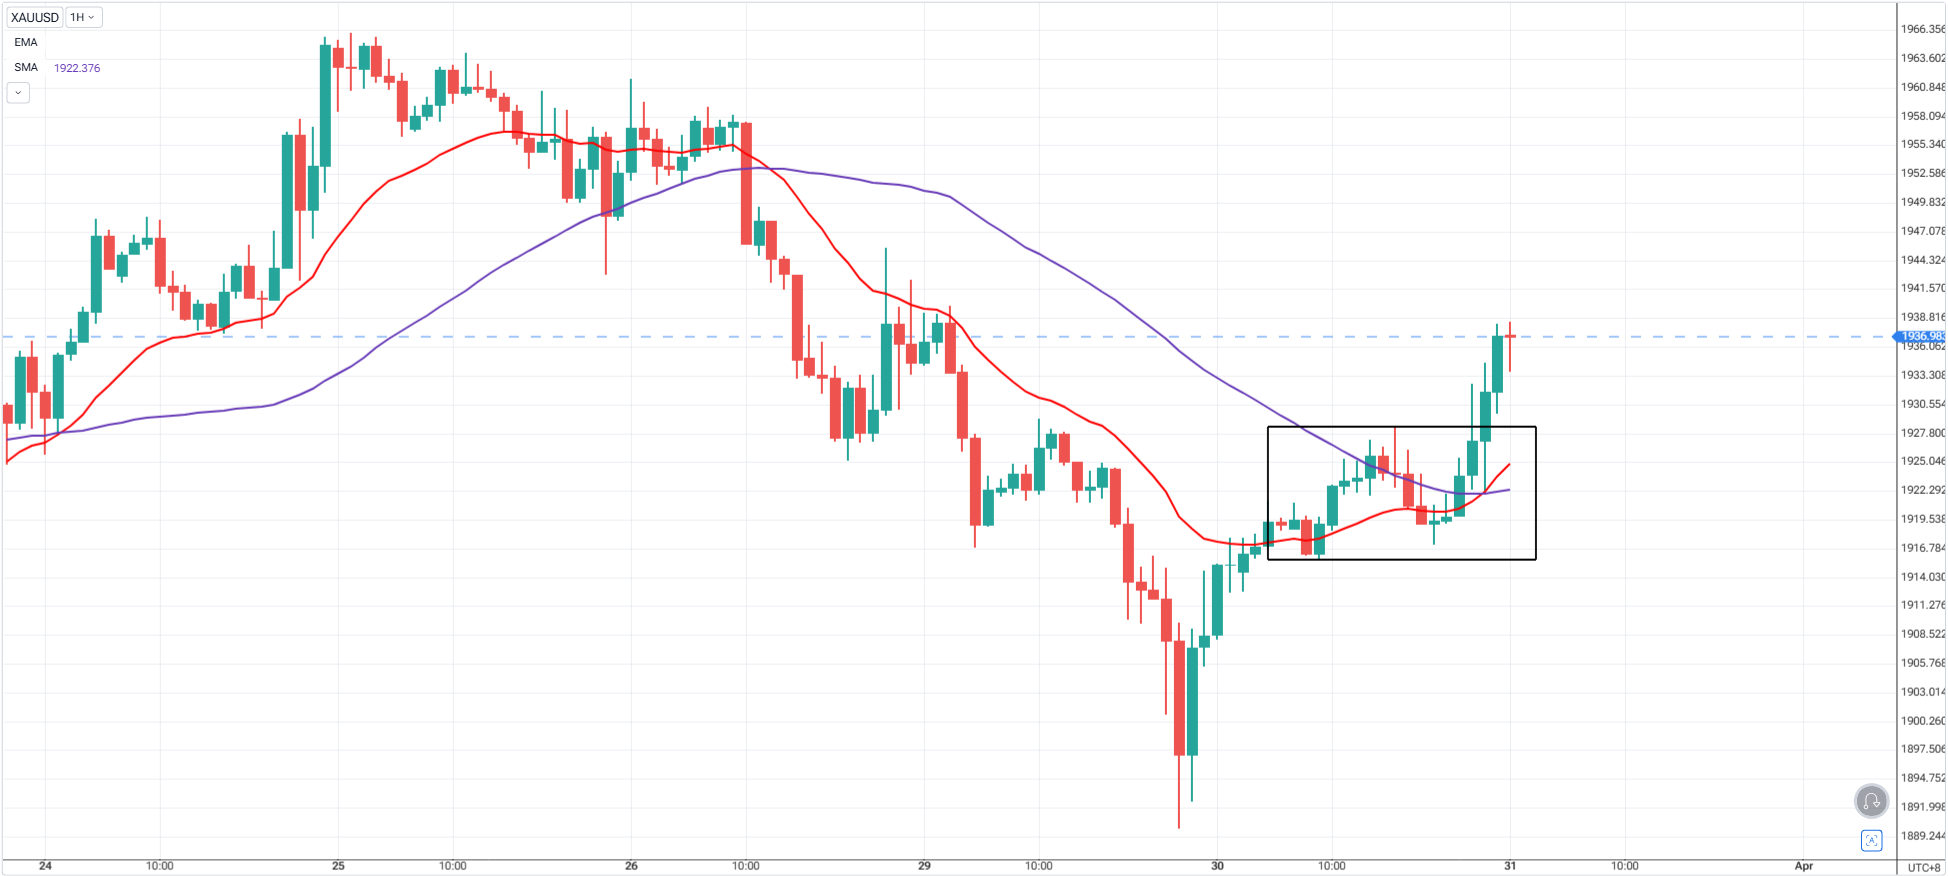
1. H1 shows a shift in trend after Gold broke out of the range + above the 20-50 Moving Average
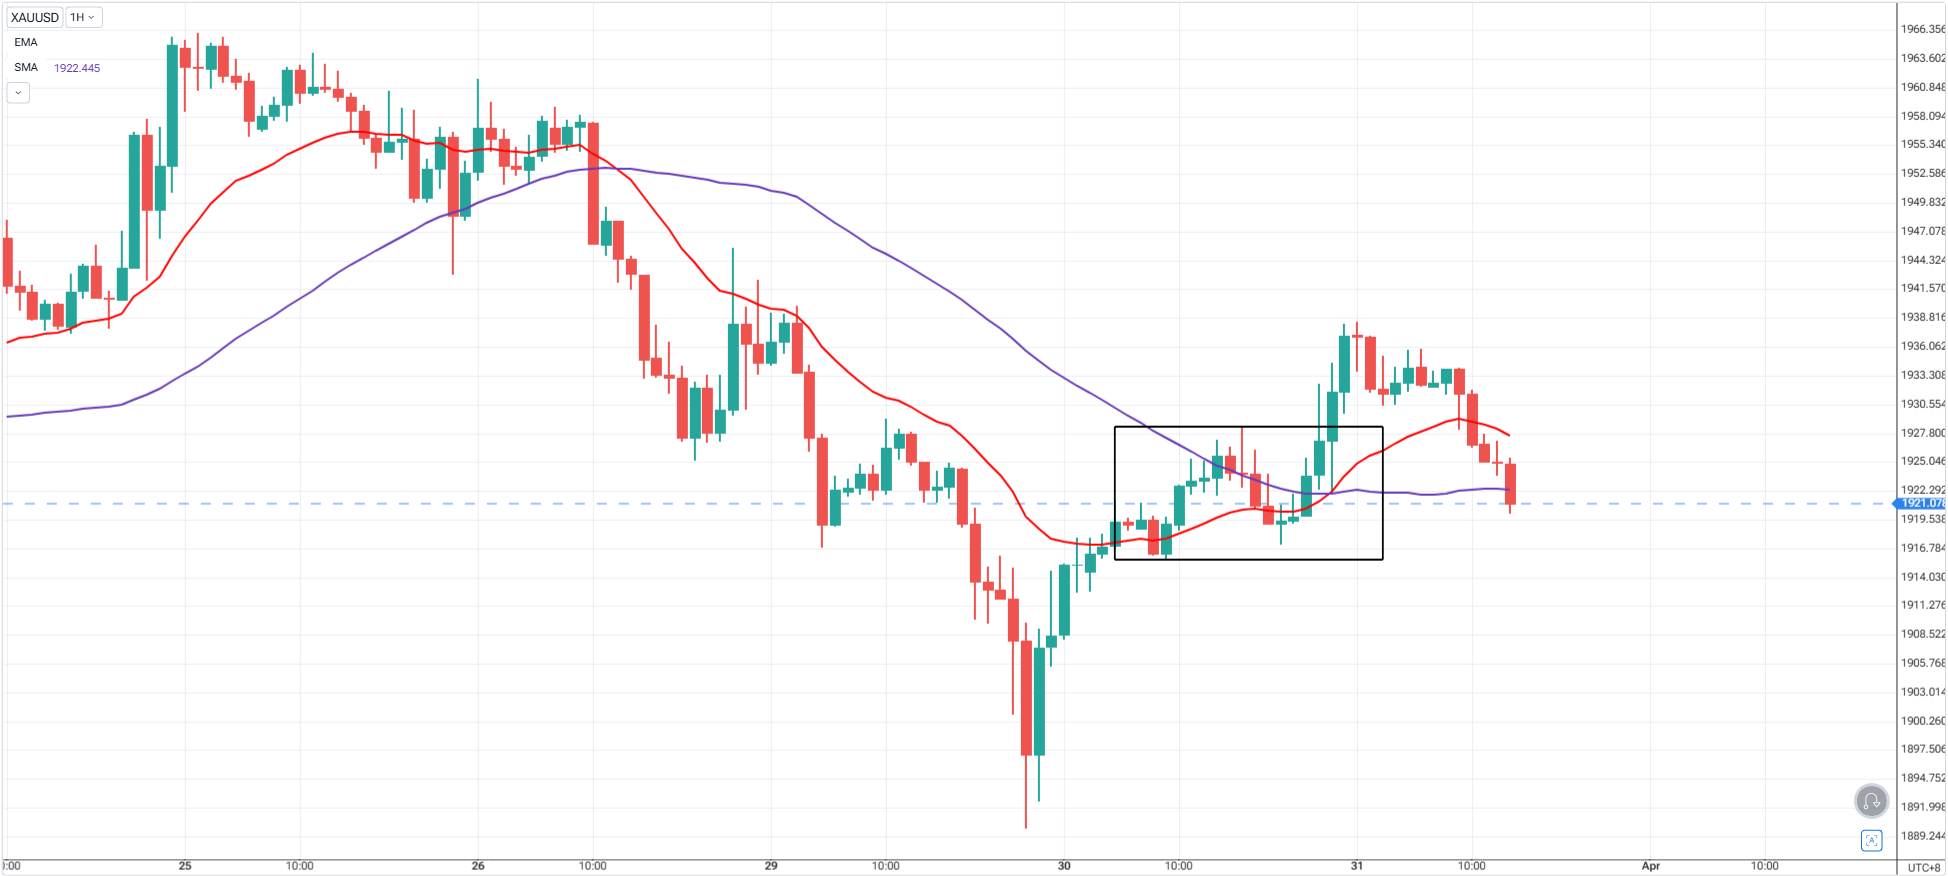
2. Wait for price to pull back and tap the H1 50 SMA
3. Drop to M15 — you see:
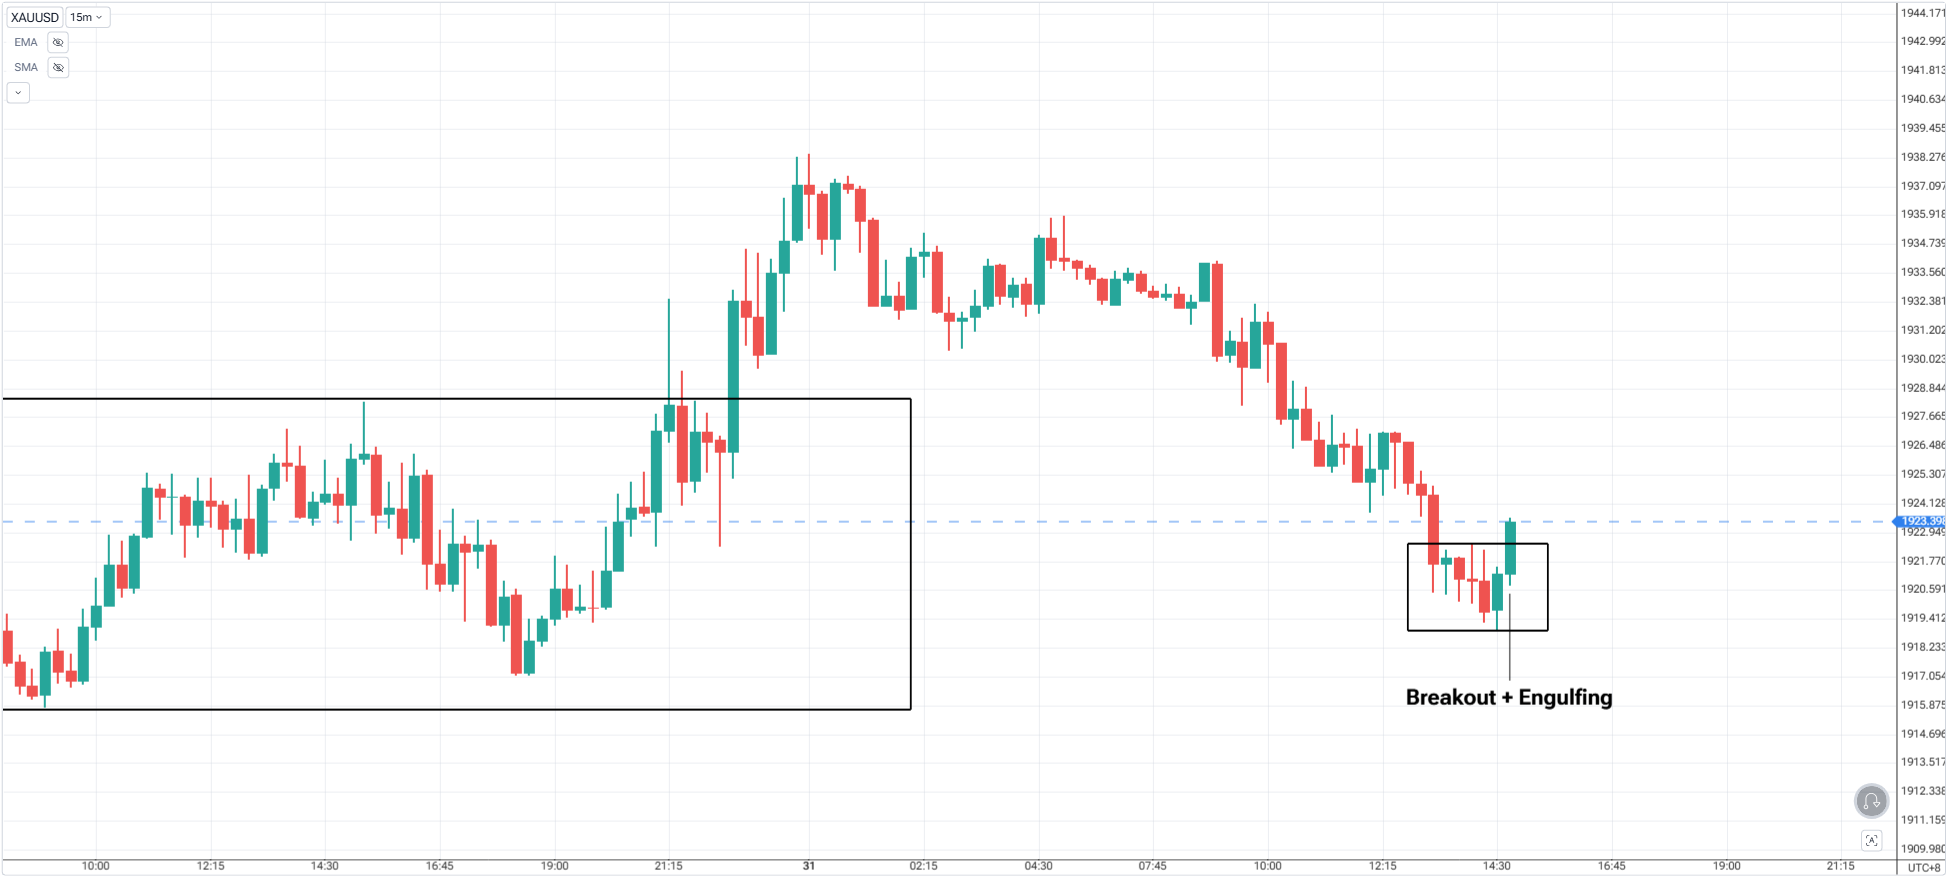
4. Execute on confirmation
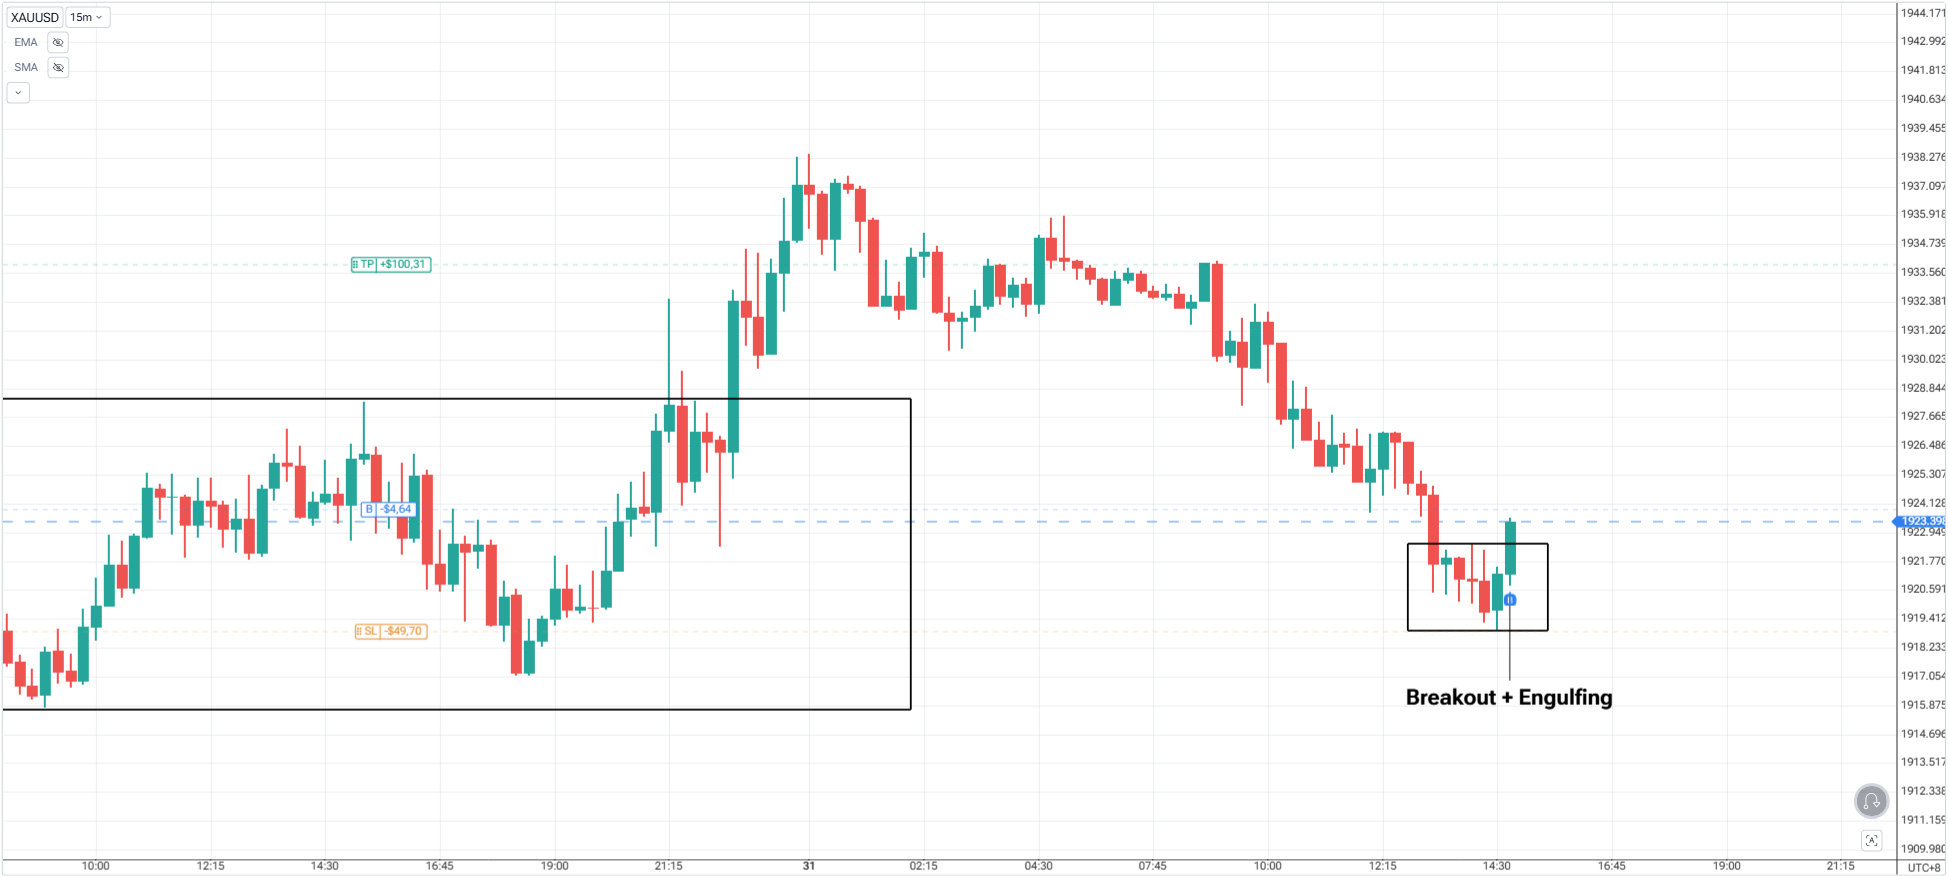
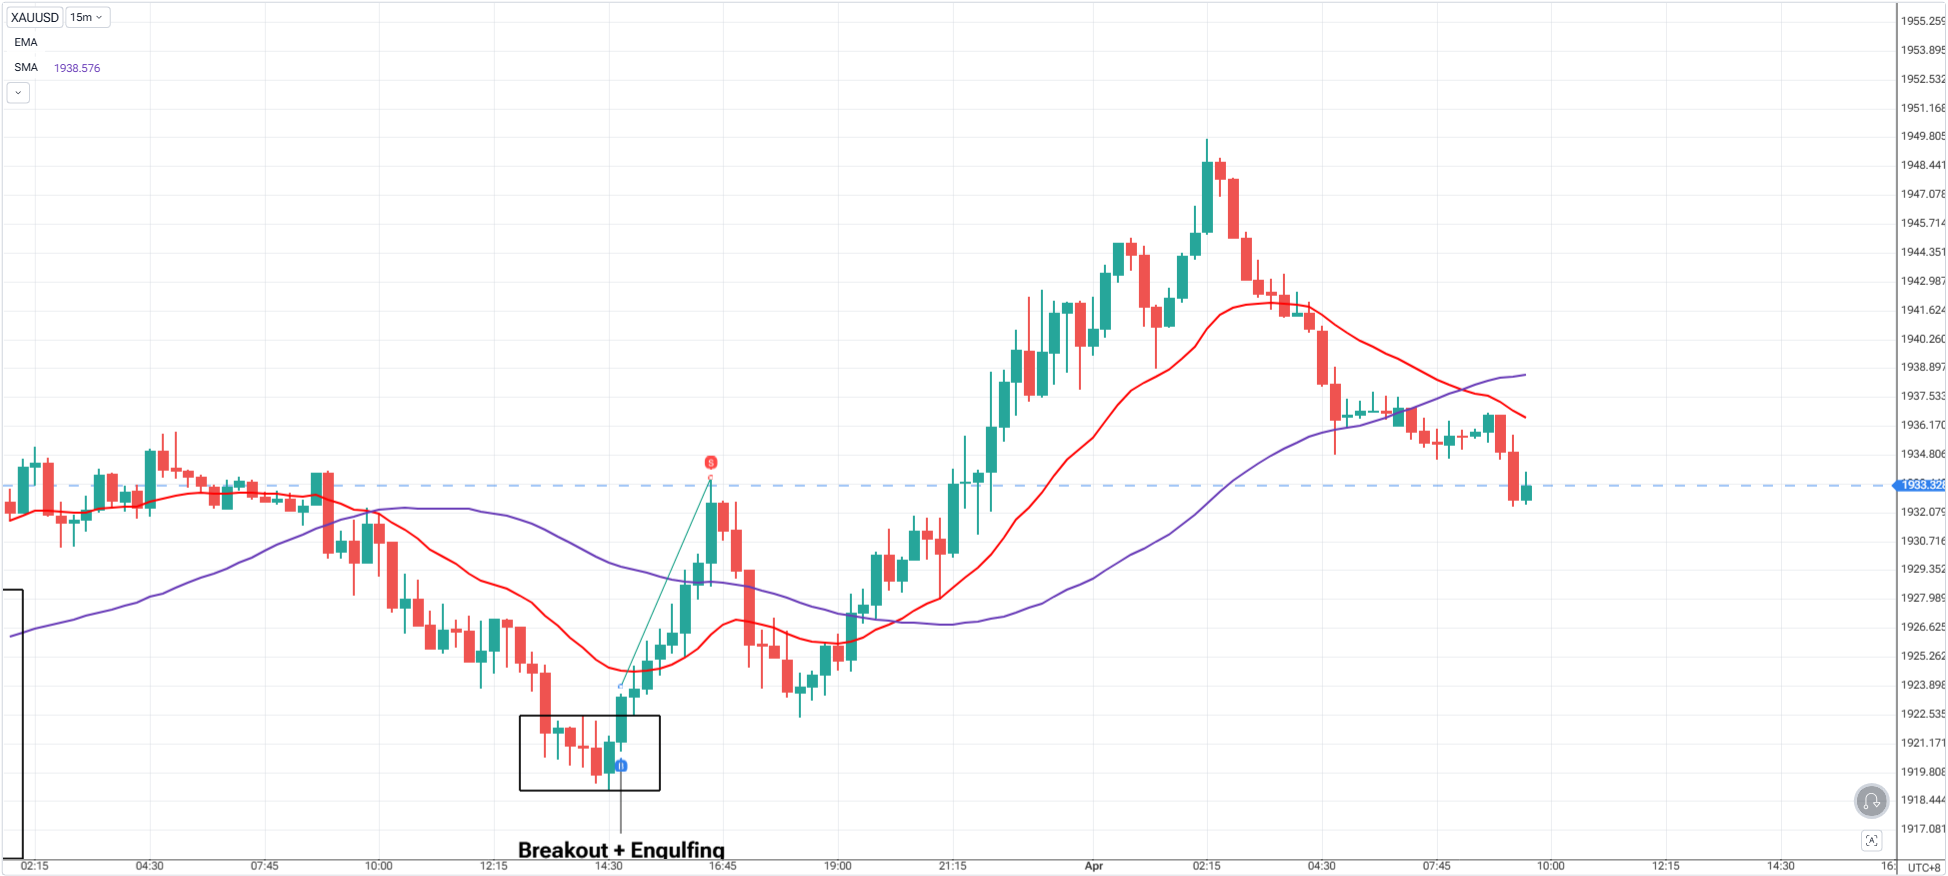
From H1’s macro bias → M15’s micro confirmation = precision execution.
| Layer | Purpose |
|---|---|
| Higher TF (H1/H4) | Sets your directional bias and anticipation zones (20/50) |
| Lower TF (M15/M5) | Provides confirmation for bounce or breakout |
| Price Action | Tells you when and how to execute |
You’re stacking logic:
Sometimes price won’t bounce — it breaks through the EMA/SMA.
That’s where the moving average flip becomes your role reversal level:
Use the same process:
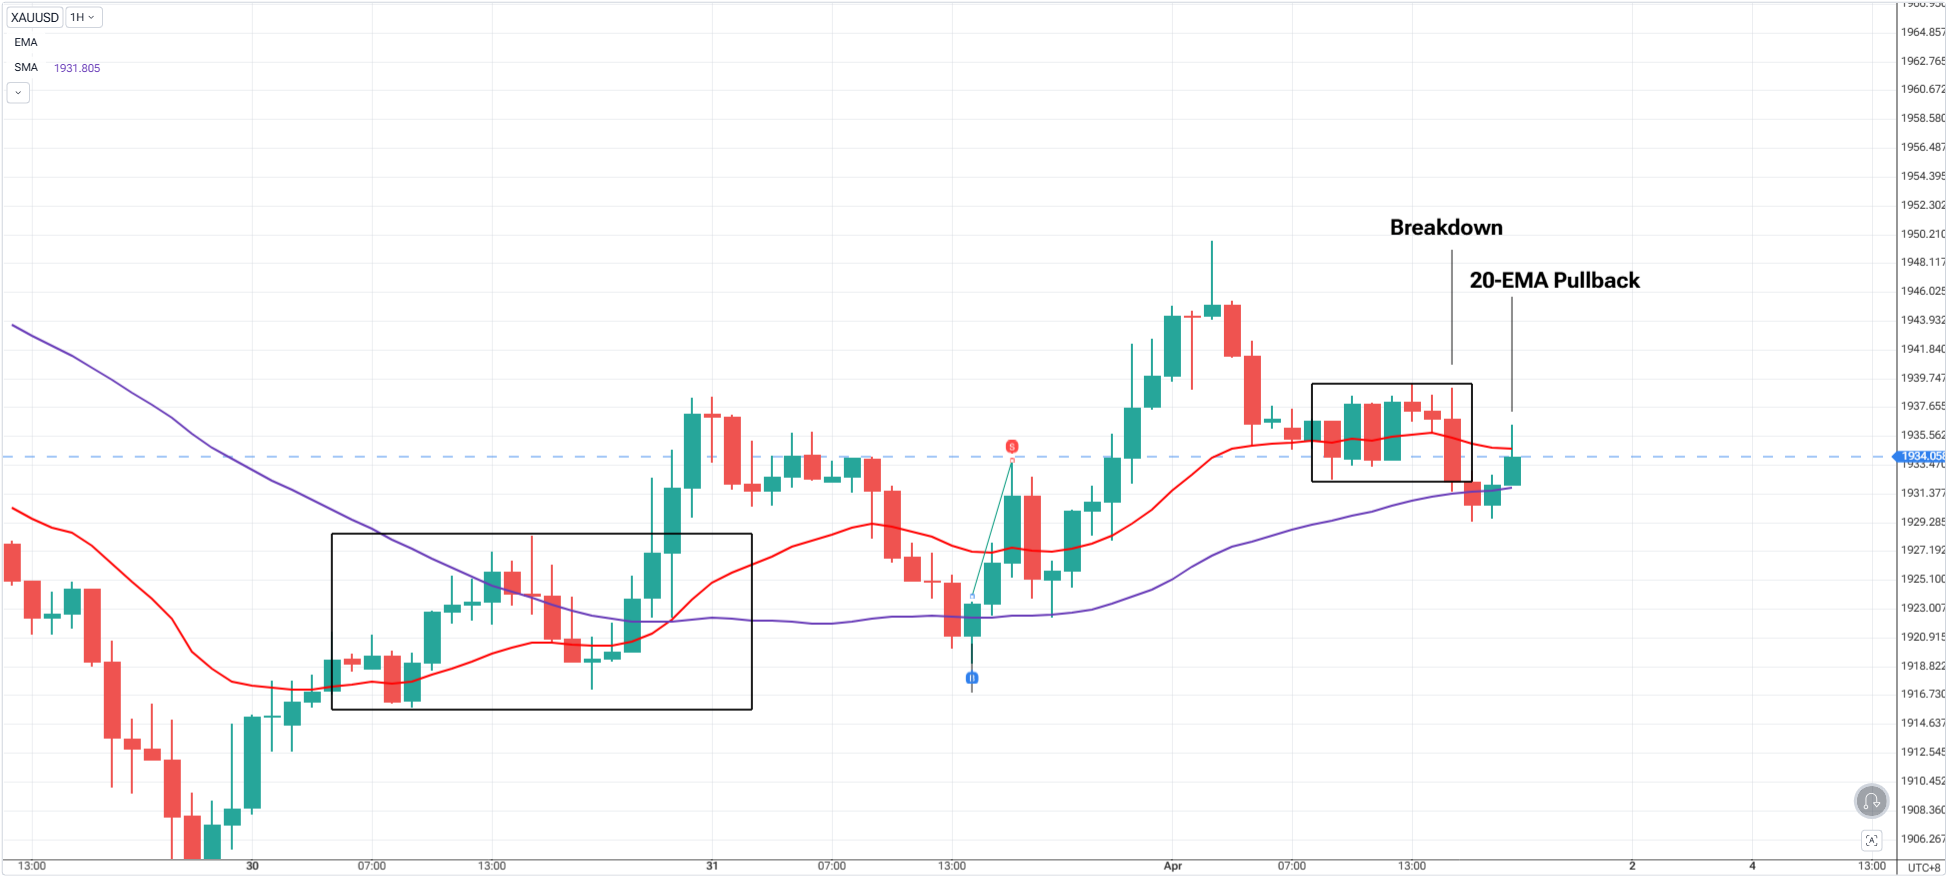
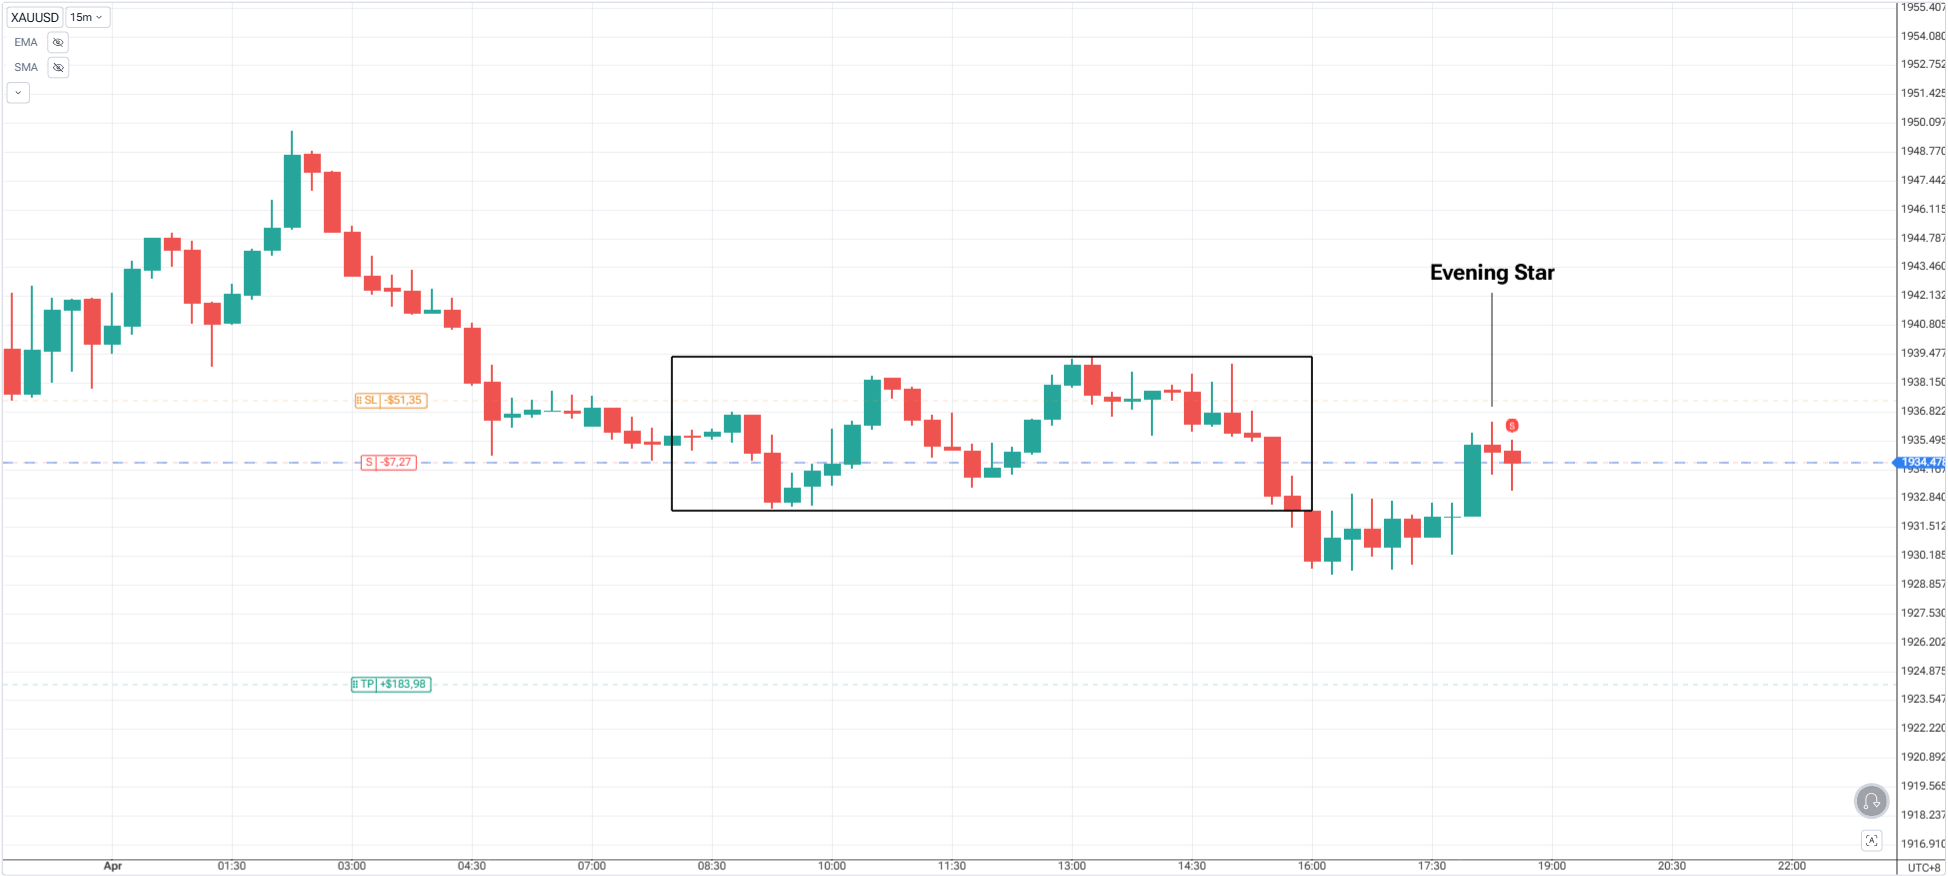
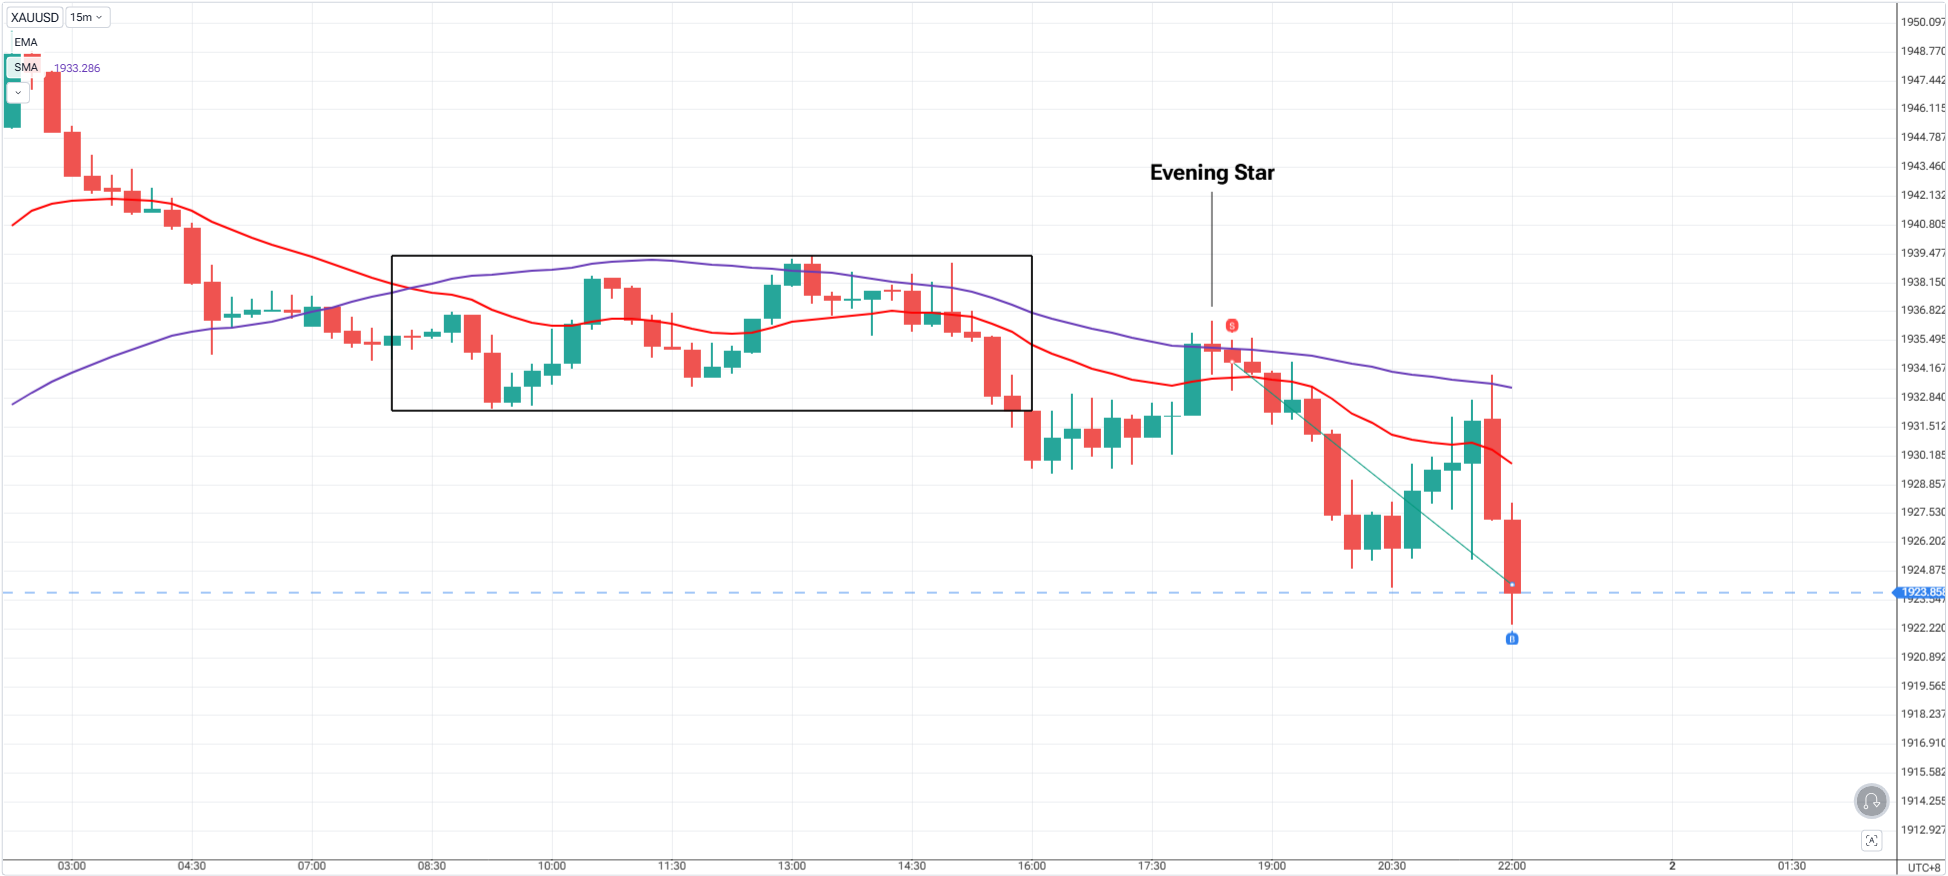
Let the break happen → wait for LTF confirmation → enter on rejection or retest
✅ 20 or 50 MA zone is tested on higher timeframe
✅ Trend and structure support the direction
✅ Price reacts with confirmation on lower TF (engulfing, BOS, MSS)
✅ Entry on breakout candle close or FVG retest
✅ Stop below the range
✅ Trail using structure or 20-EMA
✅ Exit if price closes beyond both MAs or breaks structure

The 20 EMA and 50 SMA are more than trend tools — they’re reaction zones.
Used with multi-timeframe logic and price action confirmation, they let you:
Don’t just trade the bounce. Anticipate it, confirm it, and then take it with precision.
Practice this flow:
Journal:
Open a free demo account today and experience institutional-grade spreads, lightning-fast execution, and all the tools you need to grow as a trader.
It’s time to go from theory to execution - risk-free.
Create an Account. Start Your Free Demo!
How To Trade & Scalp Indices at the Open Using Smart Money Concepts (SMC)
How to Trade Breakouts Effectively in Day Trading with Smart Money Concepts
Complete Step-by-Step Guide to Day Trading Gold (XAU/USD) with Smart Money Concepts (SMC)
The Power of Multi-Timeframe Analysis in Smart Money Concepts (SMC)
Forex Trading Strategy for Beginners
Mastering Candlestick Pattern Analysis with the SMC Strategy for Day Trading
Mastering Risk Management: Stop Loss, Take Profit, and Position Sizing
How to Use Fibonacci to Set Targets & Stops (Complete Guide)
RSI Divergence Trading Strategy for Gold: How to Identify and Trade Trend Reversals
Stochastics Trading Secrets: How to Time Entries in Trending Markets using Stochastics
Gold Trading Stochastics Strategy: How to Trade Gold with 2R–3R Targets
RSI Hidden Divergence Explained: How to Spot Trend Continuations Like a Pro
Why Smart Money Concepts Work in News-Driven Markets - CPI, NFP, and More
How to Trade NFP Using Smart Money Concepts (SMC)-A Proven Strategy for Forex Traders
How to Trade CPI Like Smart Money - A Step-by-Step Guide Using SMC
How to Start Trading Indices and Get into the Stock Market with Low Capital (2025 Guide)
Best Indices to Trade for Day Traders | NASDAQ, S&P 500, DAX + Best Times to Trade Them
How To Trade & Scalp Indices at the Open Using Smart Money Concepts (SMC)
NAS100 - How to Trade the Nasdaq Like a Pro (Smart Money Edition)
How to Trade CPI Like Smart Money - A Step-by-Step Guide Using SMC
Why Smart Money Concepts Work in News-Driven Markets - CPI, NFP, and More
How to Swing Trade Gold (XAU/USD) Using Smart Money Concepts: A Simple Guide for Traders
Complete Step-by-Step Guide to Day Trading Gold (XAU/USD) with Smart Money Concepts (SMC)
The Ultimate Guide to Backtesting and Trading Gold (XAU/USD) Using Smart Money Concepts (SMC)
Why Gold Remains the Ultimate Security in a Shifting World
How to Trade Candlestick Patterns with High Probability: A Complete Guide for Beginners
The Top Japanese Candlestick Guide: What is an Engulfing Pattern and How to Trade It?
Piercing Pattern Candlestick Explained: How to Trade It - Step-By-Step Guide
Morning & Evening Star Candlestick Patterns – How to Trade Market Reversals with Confidence
5 Steps to Start Day Trading: A Strategic Guide for Beginners
8 Steps How to Start Forex Day Trading in 2025: A Beginner’s Step-by-Step Guide
3 Steps to Build a Trading Routine for Consistency and Discipline - Day Trading Edition
The Ultimate Guide to Understanding Market Trends and Price Action
Trading with Momentum: The Best Trading Session to Trade Forex, Gold and Indices
How to Identify Risk-On and Risk-Off Market Sentiment: A Complete Trader’s Guide
How to Trade Risk-On and Risk-Off Sentiment - With Technical Confirmation
The Ultimate Guide to Understanding Market Trends and Price Action
Why Smart Money Concepts Work: The Truth Behind Liquidity and Price Action
Mastering the Market with Smart Money Concepts: 5 Strategic Approaches
Mastering Candlestick Pattern Analysis with the SMC Strategy for Day Trading
Understanding Liquidity Sweep: How Smart Money Trades Liquidity Zones in Forex, Gold, US Indices
The SMC Playbook Series Part 4: How to Confirm Trend Reversal & Direction using SMC
The SMC Playbook Series Part 5: The Power of Multi-Timeframe Analysis in Smart Money Concepts (SMC)
Fair Value Gaps Explained: How Smart Money Leaves Footprints in the Market
The Best Time to Use Smart Money Concepts (SMC): Why Timing Is Everything in Trading SMC
How to Trade the London Session Using Smart Money Concepts (SMC)
The Mental Game of Execution - Debunking the Common Trading Psychology
5 Steps to Backtest a Trading Strategy with AI: A Step-by-Step Guide
Managing Trading Losses: Why You Can Be Wrong and Still Win Big in Trading
The Hidden Threat in Trading: How Performance Anxiety Sabotages Your Edge
Why You Fail in Trading: You Don’t Have Enough Capital to Survive
Why 90% of Retail Traders Fail Even with Profitable Trading Strategies
The Top 10 Best Trading Books That Changed My Mindset, Strategy & Performance
Discovering Your Trader Profile: What Kind of Trader Are You?
Follow me for more daily market insights!
Jasper Osita - LinkedIn - FXStreet - YouTube
This content may have been written by a third party. ACY makes no representation or warranty and assumes no liability as to the accuracy or completeness of the information provided, nor any loss arising from any investment based on a recommendation, forecast or other information supplies by any third-party. This content is information only, and does not constitute financial, investment or other advice on which you can rely.
ACY Securities is one of Australia's fastest growing multi-asset online trading providers, offering ultra-low-cost trading, rock-solid execution, technologically superior account management and premium market analysis.

Select the categories and companies you wish to follow directly to your person rss feed.
Create Custom RSS Feedjust now
Sign up and join over 5,000 professional members who receive personalized news alerts, curated professional connections, and more for free!
Marex has entered the football financing market through a partnership with specialist sports investment and advisory firm Pinto Capital, targeting clubs in the Premier League and EFL Championship.
Around 110,000 UK retail investors have secured $300 million worth of Anthropic shares in its record-breaking $81 billion IPO. The heavily oversubscribed offer, coordinated by RetailBook, saw smaller investors prioritised, with 63% of applicants receiving their full allocation.
Clear Street has completed its acquisition of Boom Securities (H.K.) Limited, establishing its first licensed brokerage presence in Hong Kong
Sterling slips to its lowest against the dollar since October as markets trim Bank of England bets and Fed minutes point to further US rate rises, while the euro hits a fresh one-year low. Daily FX analysis from Equals.
JT Prime, the institutional Prime of Prime founded by Raj Sitlani, Jonathan Brewer and Jeff Wilkins, is set to become the new home for institutional client relationships currently serviced by FXCM Pro. Clients have been offered the same leverage, fees and connectivity, ensuring continuity of trading conditions.
The Nasdaq 100 has shifted into a short-term bullish recovery after finding strong support around 26,611. Following the sharp sell-off, price has formed a sequence of higher lows and has moved back above the 20-hour moving average at around 27,270, while the 5-hour and 10-hour averages are also turning higher.
U.S. equity futures rose in the after hours, led by Nasdaq-100 futures up 1% and S&P 500 futures up 0.6%, as investors focused on Anthropic’s Nasdaq debut. The AI company priced its IPO at $83 per share, above expectations, and expanded the offering to raise around $81.3 billion, making it the largest IPO on record.
Brokers can offer LMAX perpetual futures alongside FX and CFDs through a single trading account. LMAX says brokers with existing credentials can go live in under five days.
24X National Exchange has filed a proposed rule change with the SEC to launch 24X Options, a general options market trading from 9:30 a.m. to 4:00 p.m. ET. The filing also covers binary KPI options on quarterly revenue, earnings per share and other metrics for 23 of the most actively traded U.S. companies.
cTrader Mobile 5.11 introduces Signals, a new app where traders can browse signals from leading providers and act on them directly in the platform.