just now

Liquidity Finder Ltd is incorporated in England and Wales, company number 10610740, registered address 167-169 Great Portland Street, Fifth Floor, London W1W 5PF, United Kingdom.
Published: just now

With the announcement of new China tariffs, both the S&P 500 and Bitcoin saw sharp corrections last week. However, the U.S. government has since toned down its stance, raising a fair question: is the correction over?
Technically, that answer depends on how the S&P 500 behaves this week. Bitcoin tends to move in tandem with the index, so if the S&P 500 manages a clean recovery, crypto could follow suit.
Using a Fixed Range Volume Profile (FRVP) to assess key levels, the S&P 500 is currently hovering around the Value Area High (VAH) of its recent rally. While this zone acts as resistance, several factors lean bullish:
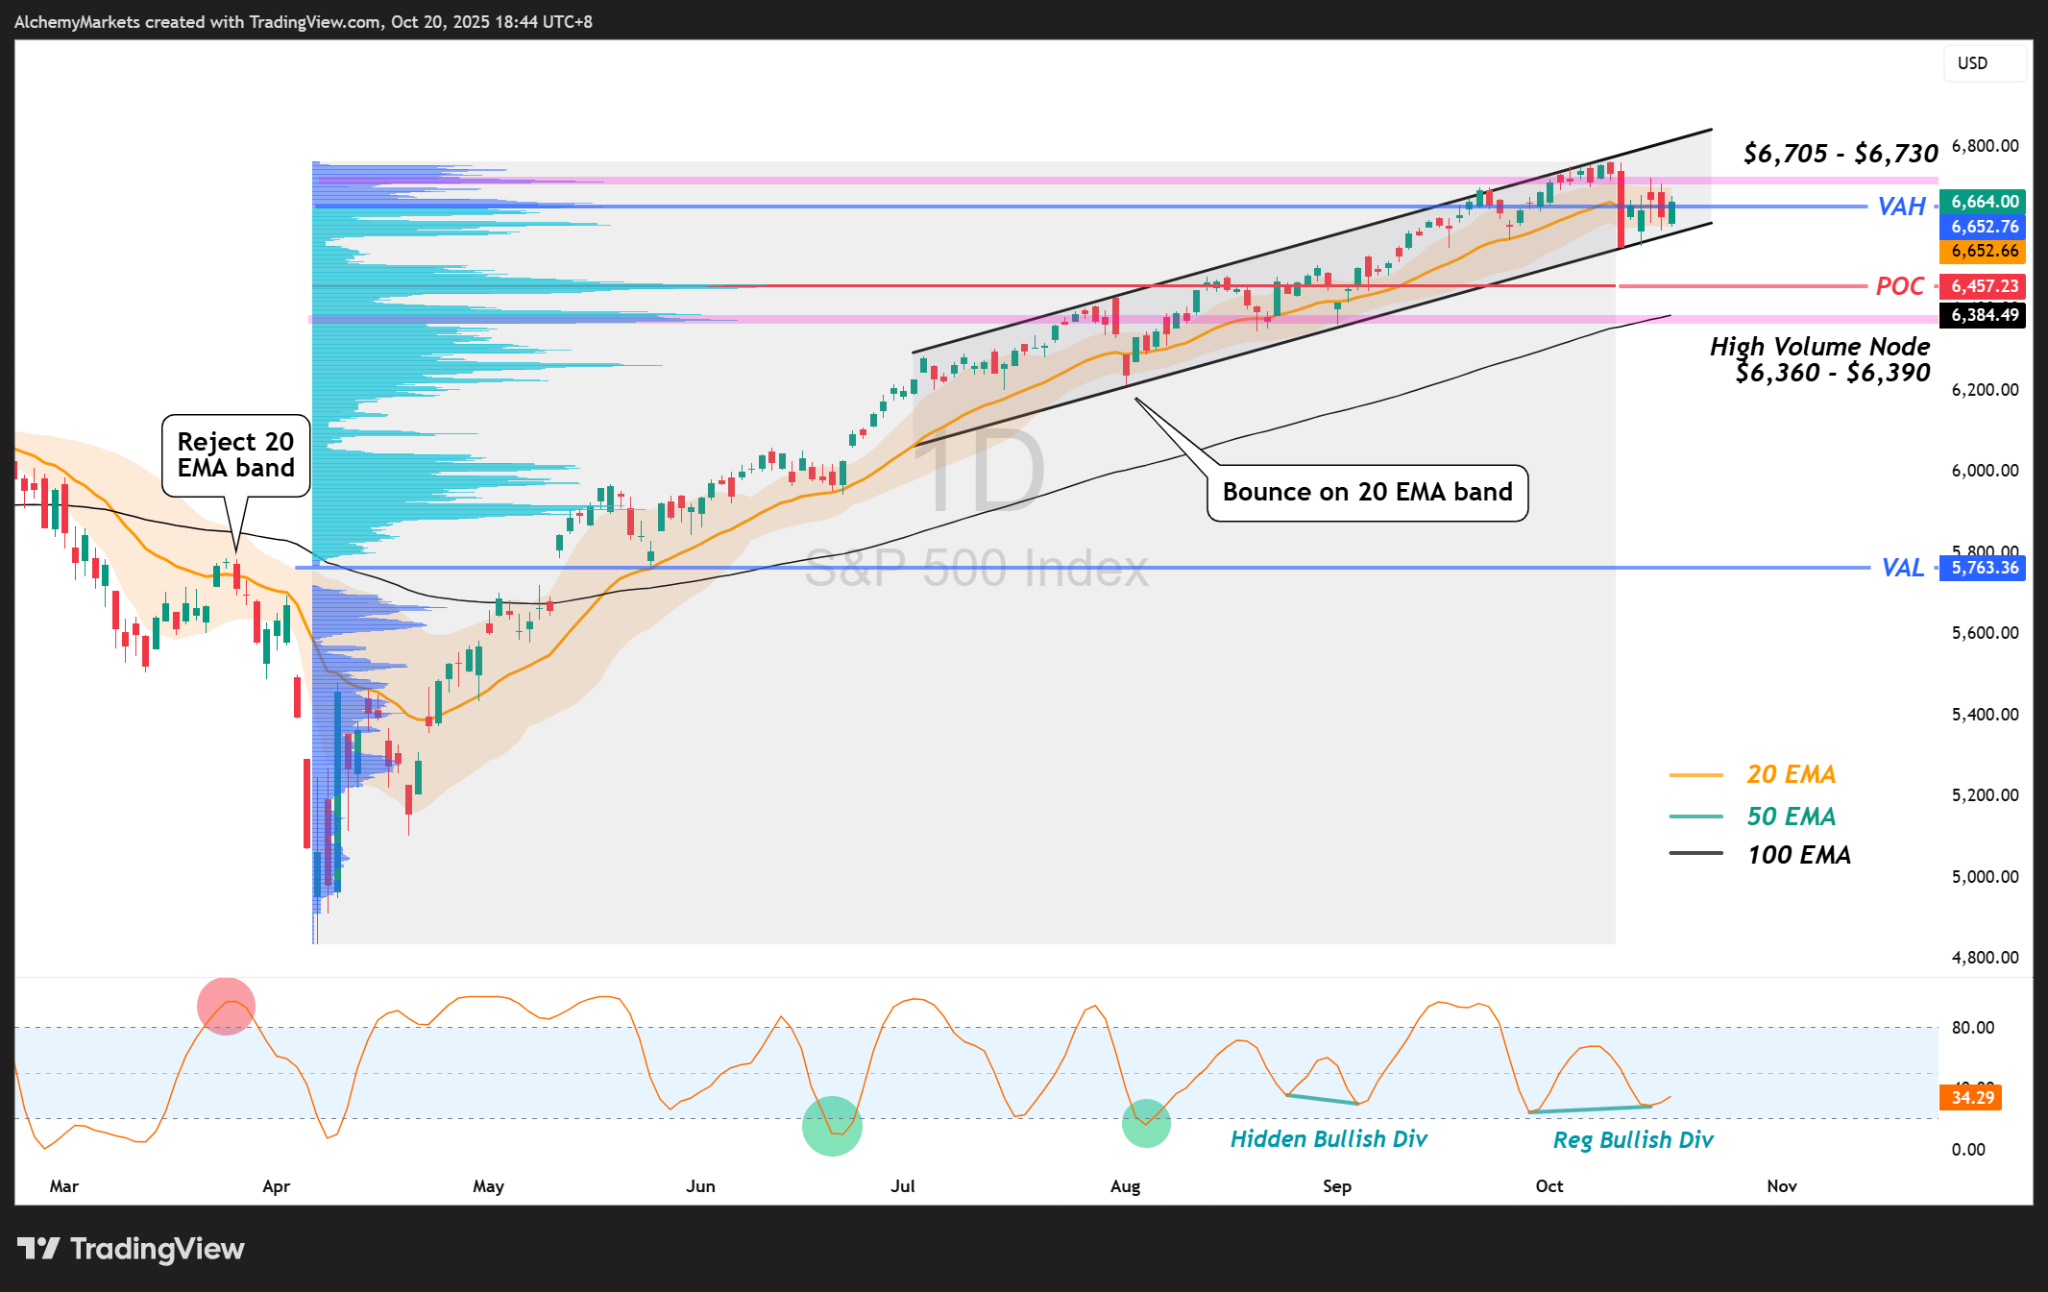
The gameplan here is simple. Watch how the price reacts around the VAH at ~$6,652.

Bitcoin has already reacted to a high-volume node near $103,200, and more importantly, has reclaimed a key Anchored vWAP from the start of its recent rally — currently at $107,221.64.
Now, price is pressing into the Point of Control (POC) from last week’s decline, sitting around $111,288 — a level that also aligns with the May 2025 swing highs, where significant volume traded.
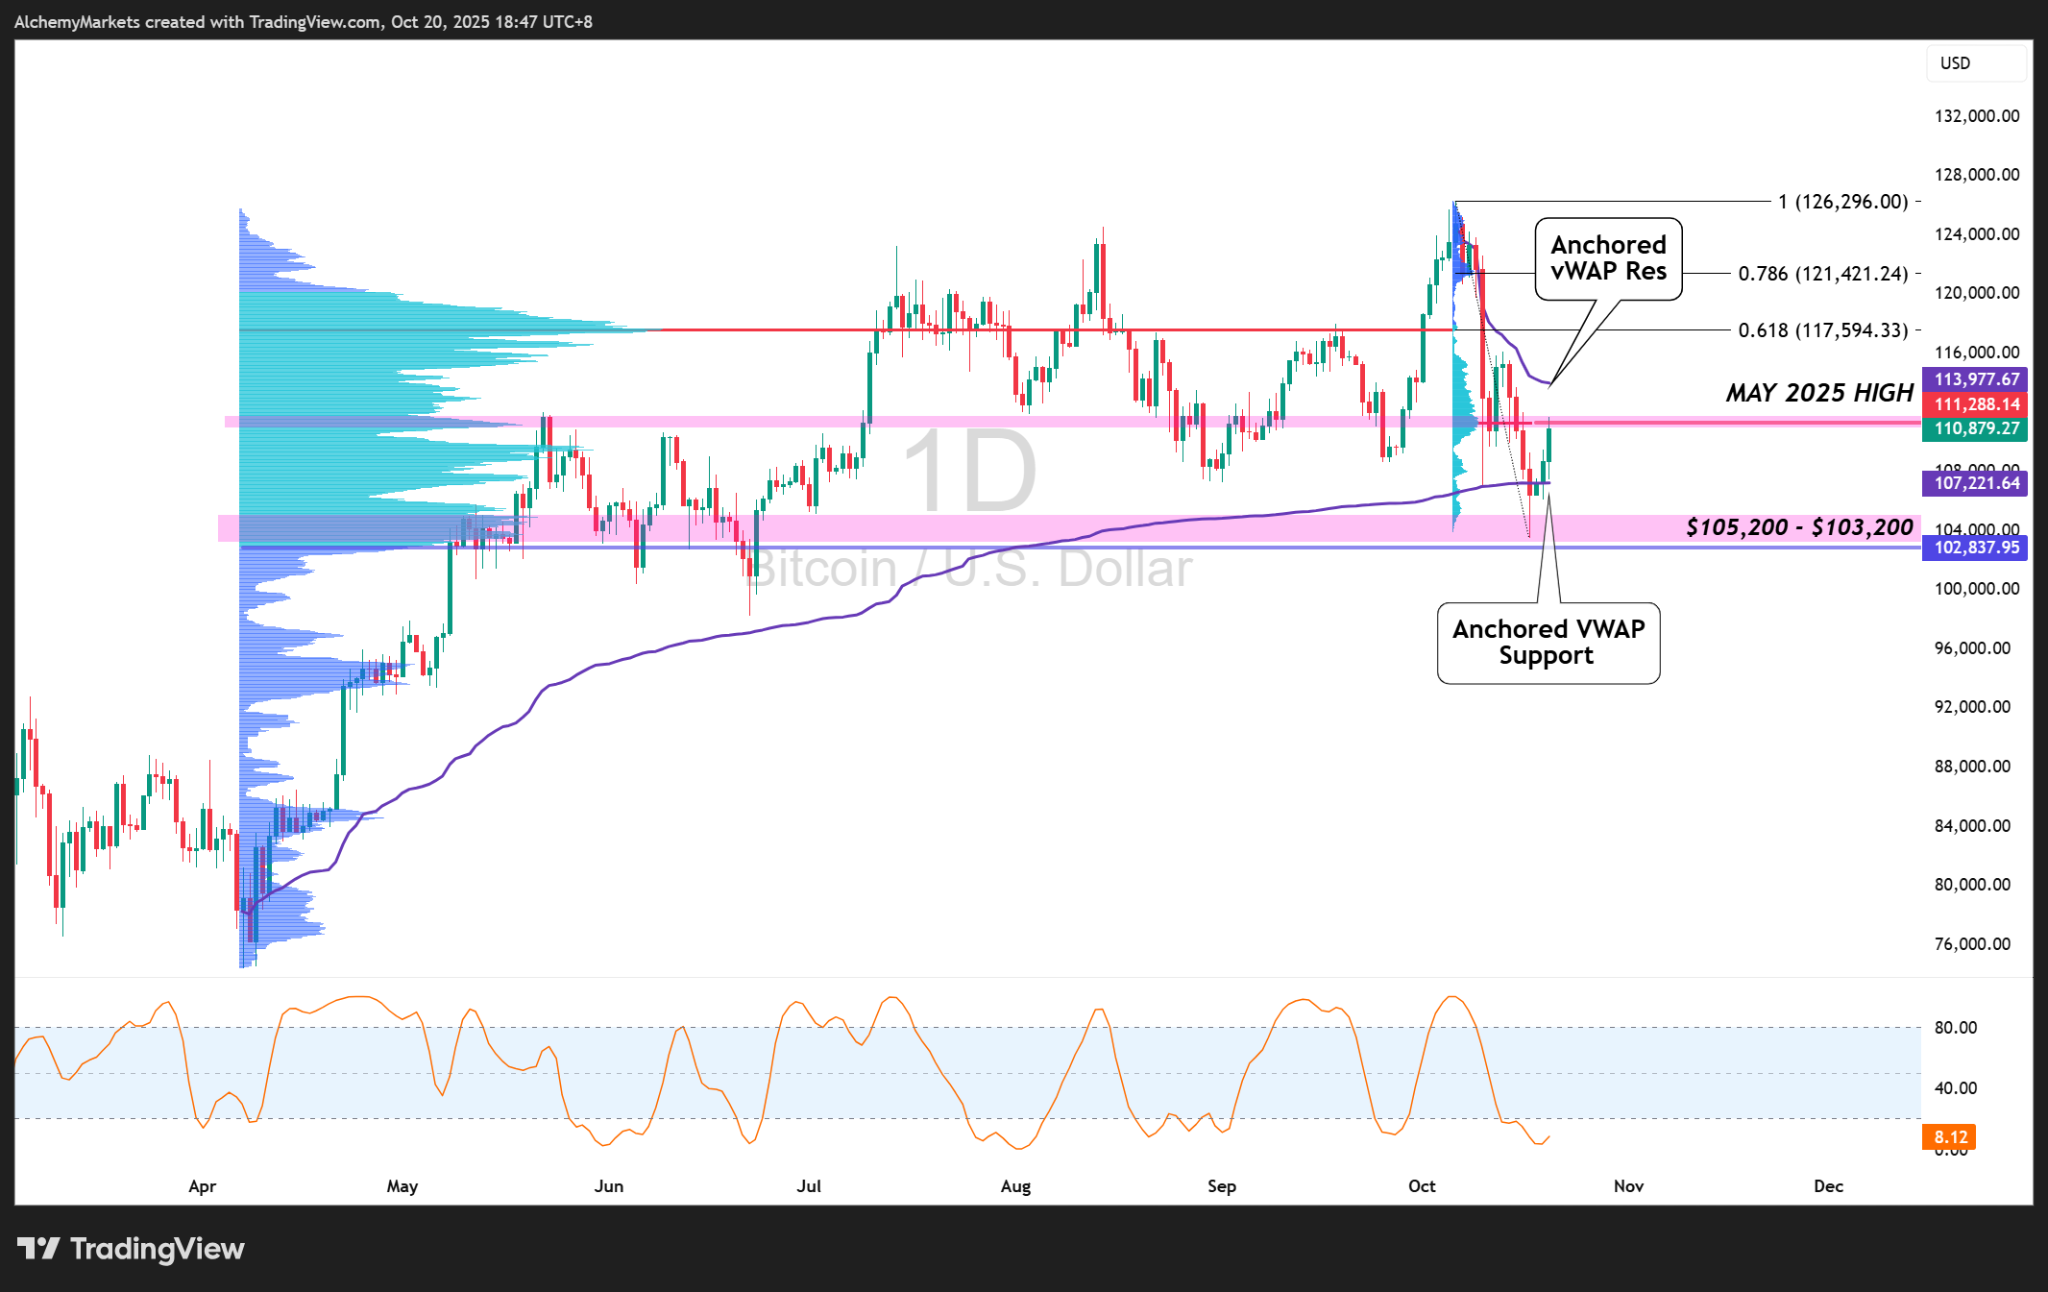
If Bitcoin continues higher, the next area to watch is the Anchored VWAP resistance (from the start of its decline) near $113,977.67; a level that also overlaps with heavy liquidation clusters.
A breakdown from here could pull Bitcoin back to $107,221.64, with deeper support seen around $105,200 – $103,200, overlapping with the 3D, 1W, and 2W Max Pain levels on Coinglass (~$104,400).
Both the S&P 500 and Bitcoin are sitting at major inflection zones. Momentum is cautiously improving, but confirmation still hinges on how equities respond to this week’s earnings and key macro data.
Earnings Releases:
Economic Data:
A softer-than-expected CPI print could spark renewed risk appetite across equities and crypto. A hotter-than-expected reading, however, might reignite selling pressure, especially if paired with weak earnings guidance.
DISCLAIMER: For educational purposes only. Trading comes with substantial risk, leading to possible loss of your capital. Traders are advised to do their own due diligence before investing.
You may also be interested in:
Alchemy Markets is a multi-asset brokerage providing retail traders with the same elite trading conditions, tools, and transparency typically reserved for institutions.
Select the categories and companies you wish to follow directly to your person rss feed.
Create Custom RSS FeedSign up and join over 5,000 professional members who receive personalized news alerts, curated professional connections, and more for free!
Sterling steadies after political uncertainty rattled gilt markets, while EUR/USD and EUR/GBP approach key technical levels ahead of today's European session.
GBP/AUD remains trapped in a well-defined bearish trend on both the weekly and daily timeframes.
Discover the key drivers, technical levels, and central bank expectations shaping the EUR/USD trend as the ECB prepares to hold rates and markets watch for a potential breakout.
Sydney-based multi-asset broker ACY Securities has introduced PAXGUSD, a new CFD instrument that allows clients to trade tokenised gold against the US Dollar 24 hours a day, seven days a week. The instrument is available across MetaTrader 4, MetaTrader 5, and the ACY Trading Platform.
Binance has lowered its VIP 3 Wallet Assets threshold from $3 million to $1 million and will now count OTC Spot Trading Volume at a 4x multiplier toward VIP qualification, removing the previous VIP 4 cap and allowing eligible users to progress through the full tier framework up to VIP 9.
Retail futures trading leader NinjaTrader Group has appointed Mark Omens as Senior Vice President, Commercial Strategy, bringing a 25-year veteran of derivatives marketplace CME Group into a newly created role focused on exchange partnerships and enterprise growth.
Gold Price Action Forecast: Will XAU/USD Drop to $3930? Meta Description: Read our Gold price action forecast to see if XAU/USD will drop to $3930.
BitDelta Securities Financial Services LLC (“BitDelta Securities”) today announced that it has received full regulatory approval from the Capital Market Authority (“CMA”) of the United Arab Emirates under the Category 5 — Arrangement and Advice license framework (License No. 20200000439). The approval follows the firm's receipt of In-Principal Approval earlier this year and represents the successful conclusion of the CMA's full licensing process, including the satisfaction of capital requirements, governance appointments, and operational setup.
Crypto.com has received a $400 million strategic investment from Citadel Securities, valuing the firm at $20 billion. It marks the first institutional funding round in the company's history, aimed at accelerating its expansion into tokenised securities, derivatives and other asset classes.
WTI’s pullback into $79–82 is the first major test of the bullish Elliott Wave count, with buyers targeting a renewed break above $85.


