just now

Liquidity Finder Ltd is incorporated in England and Wales, company number 10610740, registered address 167-169 Great Portland Street, Fifth Floor, London W1W 5PF, United Kingdom.
Published: just now

Markets face a loaded docket this week: Powell’s Jackson Hole speech, Citron’s $40 price target for Palantir, and Nvidia’s long-awaited technical breakdown.
Behind the headlines, one chart is making the rounds — and it shows just how stretched equity valuations have become.
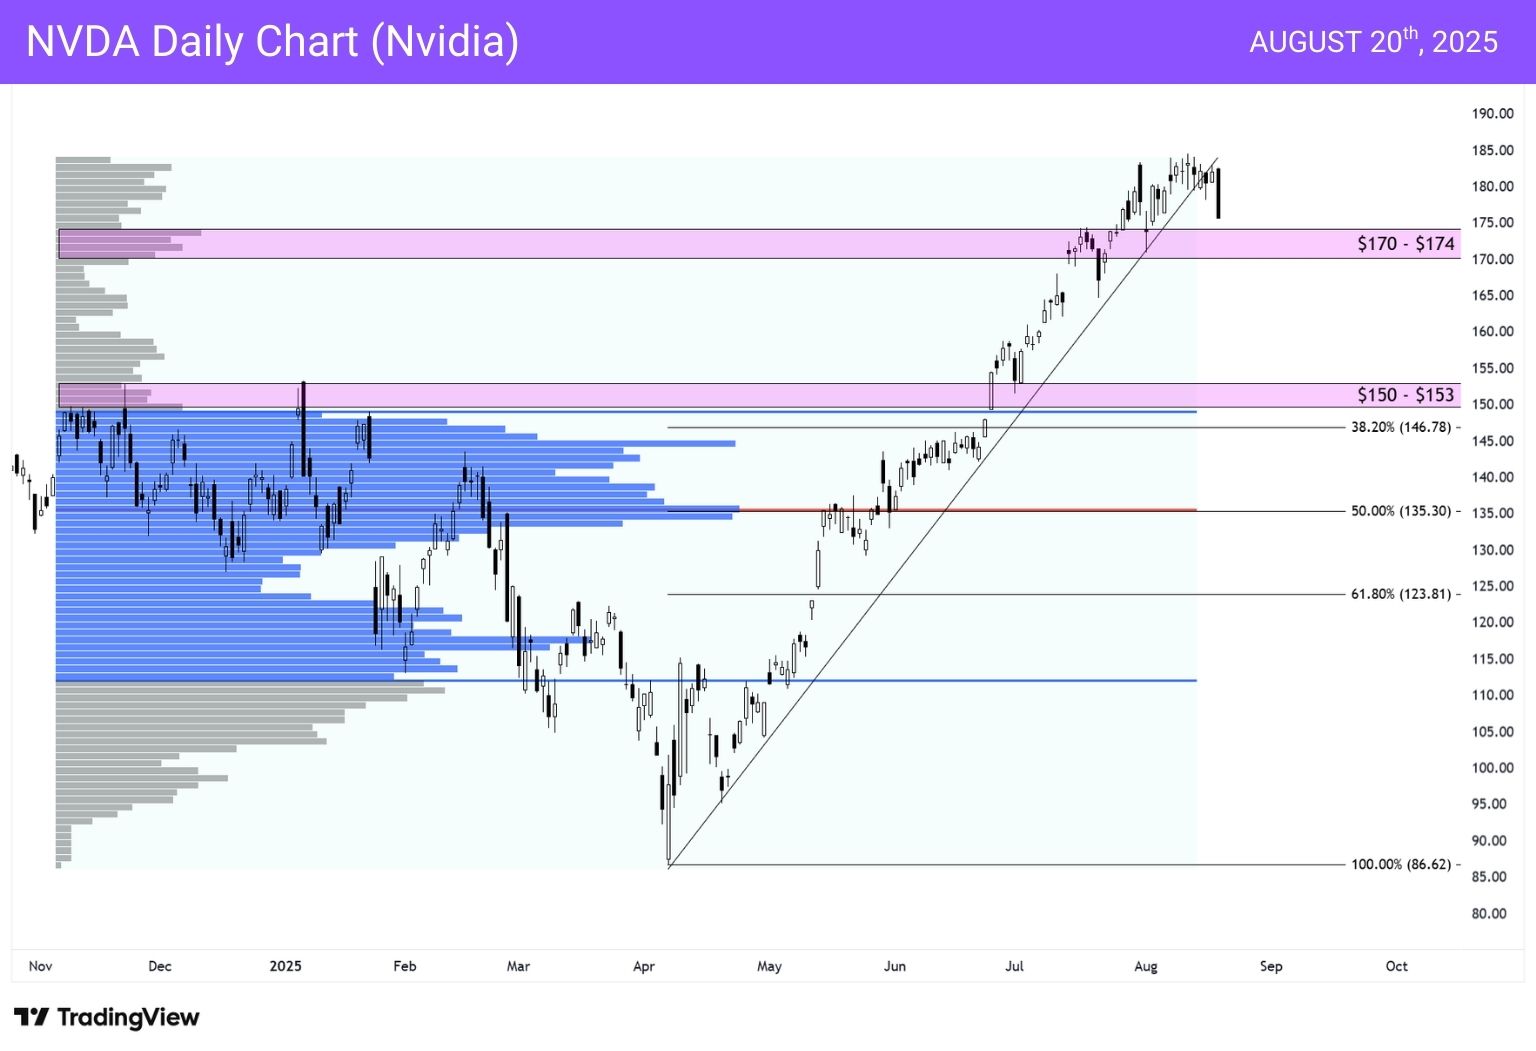
Nvidia (NVDA) slipped under its rising channel, breaking below its daily trendline. The $170–$174 volume support zone is first in focus, but the more important level is the $150 - $153 support zone which aligns with a Value Area High, and Fibonacci levels at $146.78.
Given semiconductors have powered much of 2025’s rally, this breakdown puts the broader tech trade on watch.
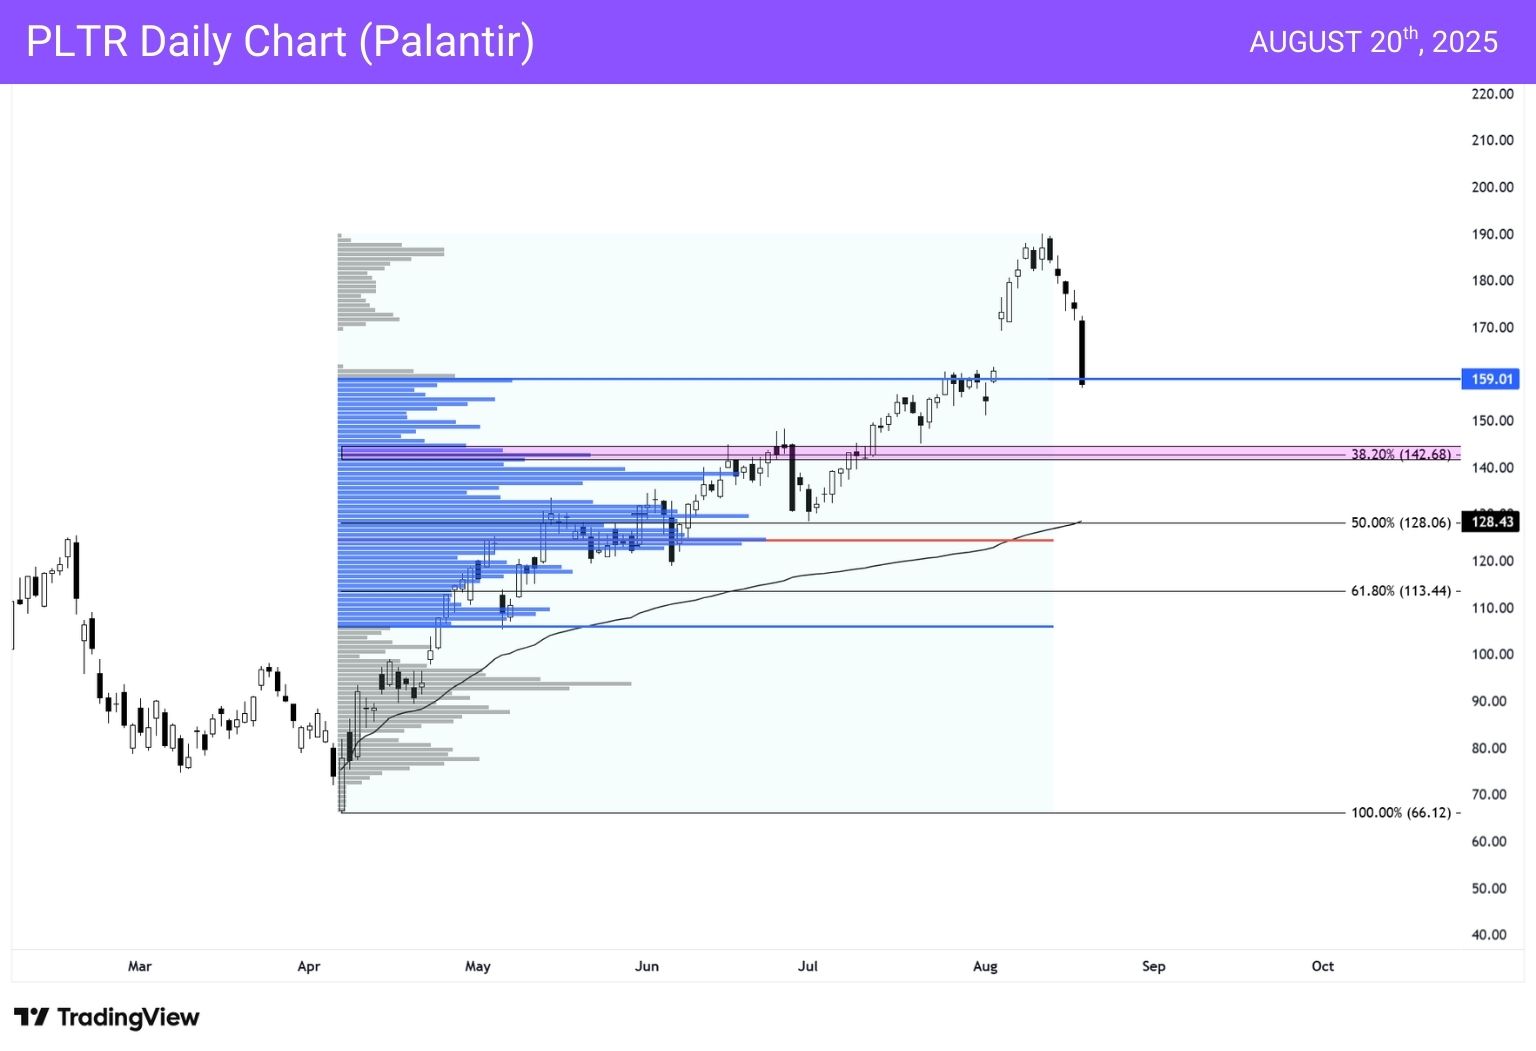
Citron Research resurfaced with a rare short report, pegging Palantir’s fair value at $40. The stock tumbled roughly 8% in a single day, stoking questions over whether this was an overdue reality check or simply an excuse for traders to take profits across tech.
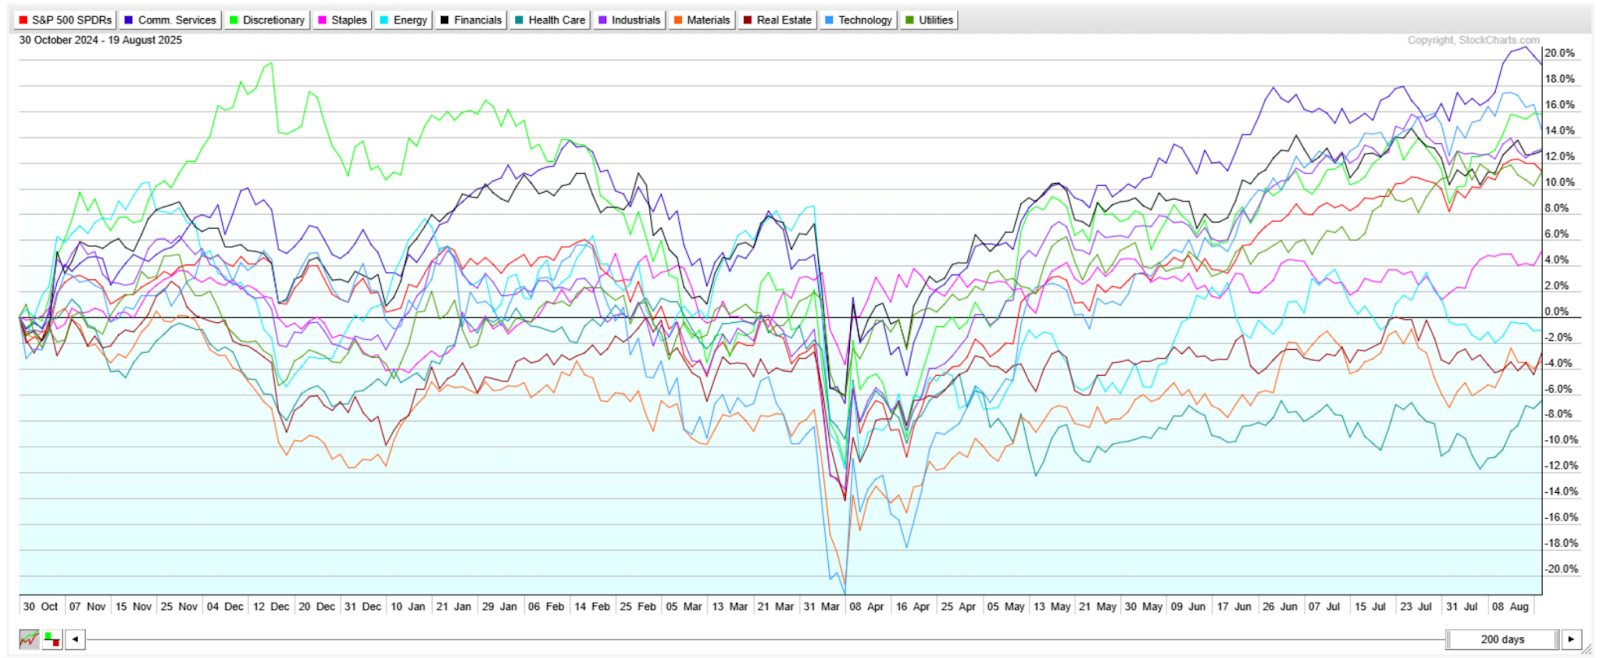
The XLK and Nasdaq 100 both lost their trendlines, but rather than outright panic, the move looks more like rotation. Healthcare, homebuilders, and biotech outperformed over the last 24 hours, while tech dragged the indices. That’s classic late-cycle positioning.
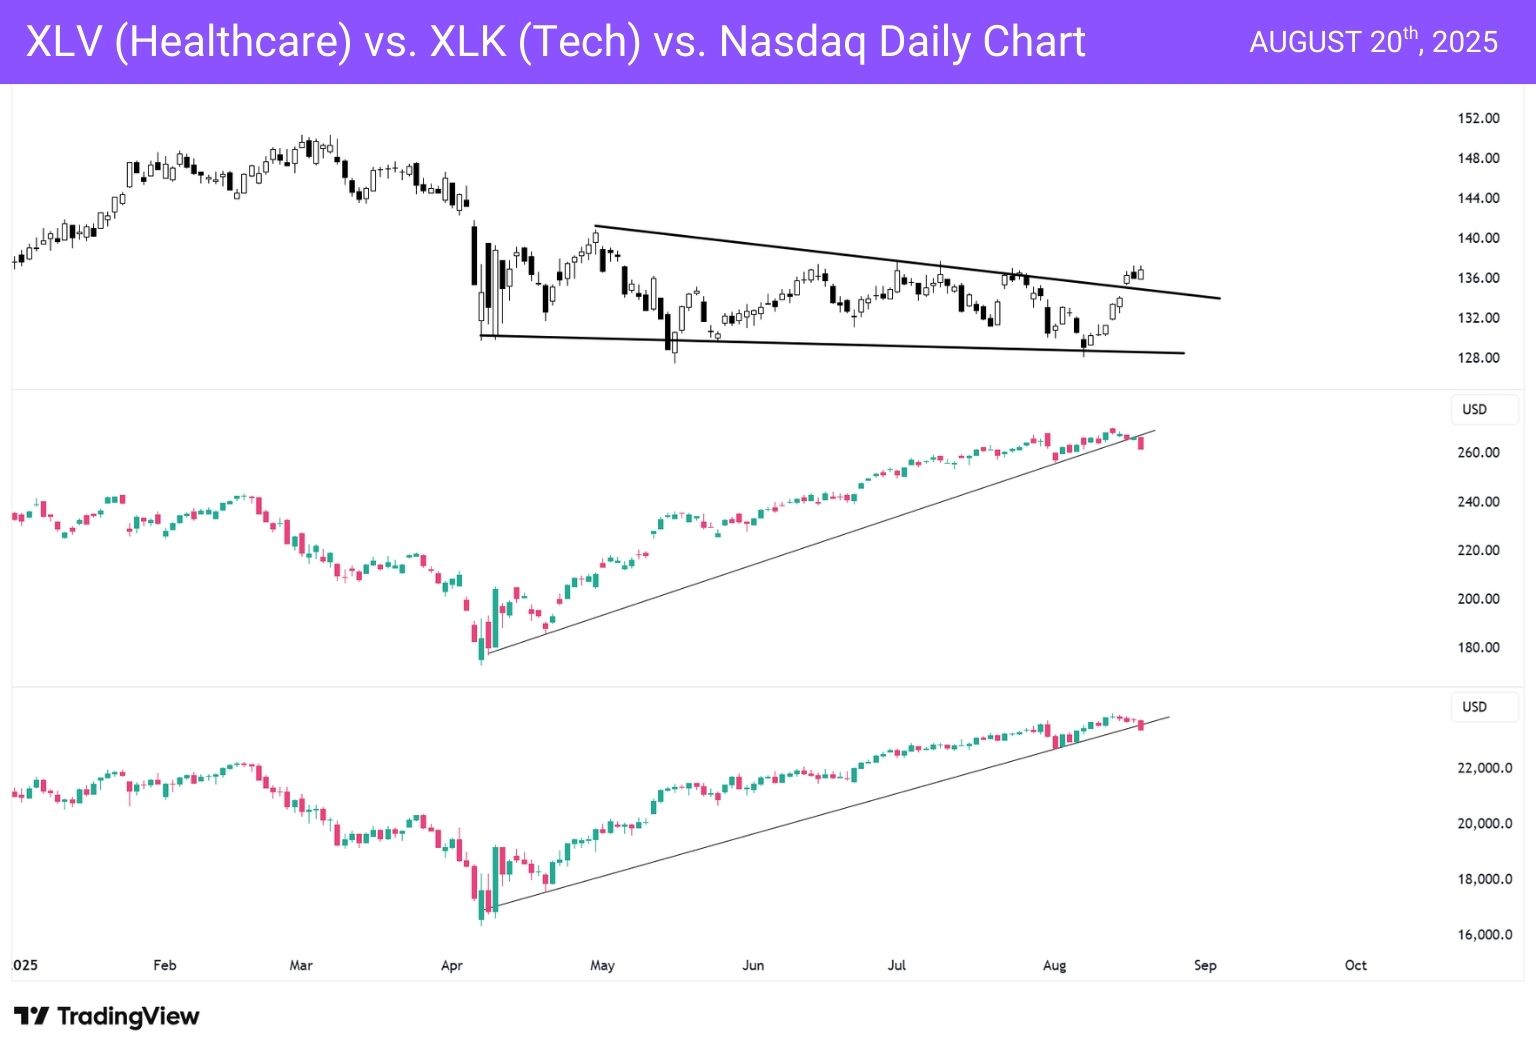
For a better view of how each indice is performing, see the full comparison chart here.
The real backdrop to all this volatility is valuation. According to Elliott Wave International and Bloomberg data, 2024–2025 now ranks as the most overvalued market in history across combined metrics (P/E, CAPE, P/B, EV/EBITDA, Q Ratio, Market Cap-to-GDP).
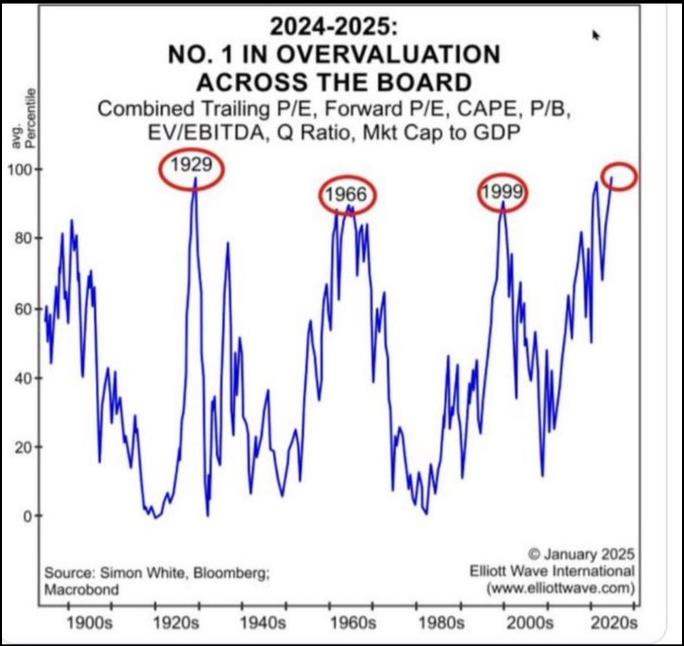
The chart places today alongside 1929, 1966, and 1999: moments in time that preceded major corrections.
Bottom line — The US stock market is reaching an overvaluation level only seen one time in history, in 1929. While this chart alone does not signal the end of the macro-rally, it is a warning sign and a reflection of just how euphoric markets have become.
This all sets the stage for Powell at Jackson Hole. With bond markets still calm, the near-term setup could be seasonal chop into September–October before a potential year-end rally. But with valuations stretched, leverage rising among retail traders, and big tech under pressure, caution is warranted.
The selloff in Nvidia and Palantir may be short-term catalysts, but the real story is bigger: we are trading in one of the most overvalued environments ever recorded.
Powell’s words this week could decide whether that bubble stretches further or starts to deflate.
You may also be interested in:
Reserve Bank of New Zealand: Rate Cut Expected, More Easing to Follow
DISCLAIMER: For educational purposes only. Trading comes with substantial risk, leading to possible loss of your capital. Traders are advised to do their own due diligence before investing.
Alchemy Markets is a multi-asset brokerage providing retail traders with the same elite trading conditions, tools, and transparency typically reserved for institutions.
Select the categories and companies you wish to follow directly to your person rss feed.
Create Custom RSS FeedSign up and join over 5,000 professional members who receive personalized news alerts, curated professional connections, and more for free!
Gold Price Action Forecast: Will XAU/USD Drop to $3930? Meta Description: Read our Gold price action forecast to see if XAU/USD will drop to $3930.
BitDelta Securities Financial Services LLC (“BitDelta Securities”) today announced that it has received full regulatory approval from the Capital Market Authority (“CMA”) of the United Arab Emirates under the Category 5 — Arrangement and Advice license framework (License No. 20200000439). The approval follows the firm's receipt of In-Principal Approval earlier this year and represents the successful conclusion of the CMA's full licensing process, including the satisfaction of capital requirements, governance appointments, and operational setup.
Crypto.com has received a $400 million strategic investment from Citadel Securities, valuing the firm at $20 billion. It marks the first institutional funding round in the company's history, aimed at accelerating its expansion into tokenised securities, derivatives and other asset classes.
WTI’s pullback into $79–82 is the first major test of the bullish Elliott Wave count, with buyers targeting a renewed break above $85.

BitDelta Securities has secured a full CMA Category 5 licence in the UAE and opened a regulated office in Business Bay, Dubai. The firm operates as an introducing broker, connecting investors with licensed international brokers across multiple asset classes, with CEO Dr. Demetrios Zamboglou commenting on the milestone.
Index volatility is asleep while single stocks fight it out underneath, credit refuses to confirm the equity rally, and a bare macro calendar hands next week to oil.
Digital assets and FX brokerage GC Exchange FZE (GCEX) has appointed Mohammed A. Mulla as a Board Member of its Dubai-based entity, part of the wider GCEX Group.
Learn what Blockchain-as-a-Service is, how it works, and why businesses are using BaaS to build blockchain applications without managing infrastructure.
CFDs vs stocks compared on leverage, ownership, costs, dividends, taxes, and risk. Learn the differences between stocks and CFDs and discover which suits your investing or trading goals.
Want to master the markets? A winning trading mindset beats a perfect strategy. Learn how emotional discipline helps you conquer fear and avoid heavy losses.


