just now

Liquidity Finder Ltd is incorporated in England and Wales, company number 10610740, registered address 167-169 Great Portland Street, Fifth Floor, London W1W 5PF, United Kingdom.
Published: just now

As the clock ticks down to Nvidia’s Q4 (FY2026) earnings after the bell, the S&P 500 is holding its breath within a newly established tight range.
This report is critical, as the aftermath will answer two major questions for the market:
Here is the massive hurdle Nvidia needs to clear today to keep the rally alive:
Metric |
|
Last Year
|
Last Quarter
|
Today’s Forecast (Q4 2025 / FY26)
|
Total Revenue |
|
$39.3 Billion |
|
$57.0 Billion |
|
~$65.8 – $66.1 Billion
|
Adjusted EPS |
|
$0.89 |
|
$1.30 |
|
~$1.46 – $1.53
|
Data Center |
|
$35.6 Billion |
|
$51.2 Billion |
|
~$59.9 – $60.2 Billion
|
Gross Margin |
|
73.5% |
|
73.6% |
|
~74.8% – 75.0%
|
Not only does Nvidia have to clear this $66 billion revenue bar to satisfy a skeptical Wall Street, but CEO Jensen Huang is doing it right on the doorstep of their massive GTC tech event next month.
What he says on the call today won’t just dictate if the S&P 500 breaks out of its mini range tomorrow—it will set the entire narrative for the AI industry’s biggest conference of the year.
Quick note:
GTC (GPU Technology Conference) is Nvidia’s premier annual global AI and developer event. Often called the “Super Bowl of AI,” it is where CEO Jensen Huang sets the roadmap for the tech industry by unveiling the company’s next-generation chips, new software platforms, and major partnerships.
As one would expect, Nvidia is currently range-bound as we edge towards the earnings report. The range is approximately between $171 to $194, with the mid range at $182.
Nvidia 4H chart
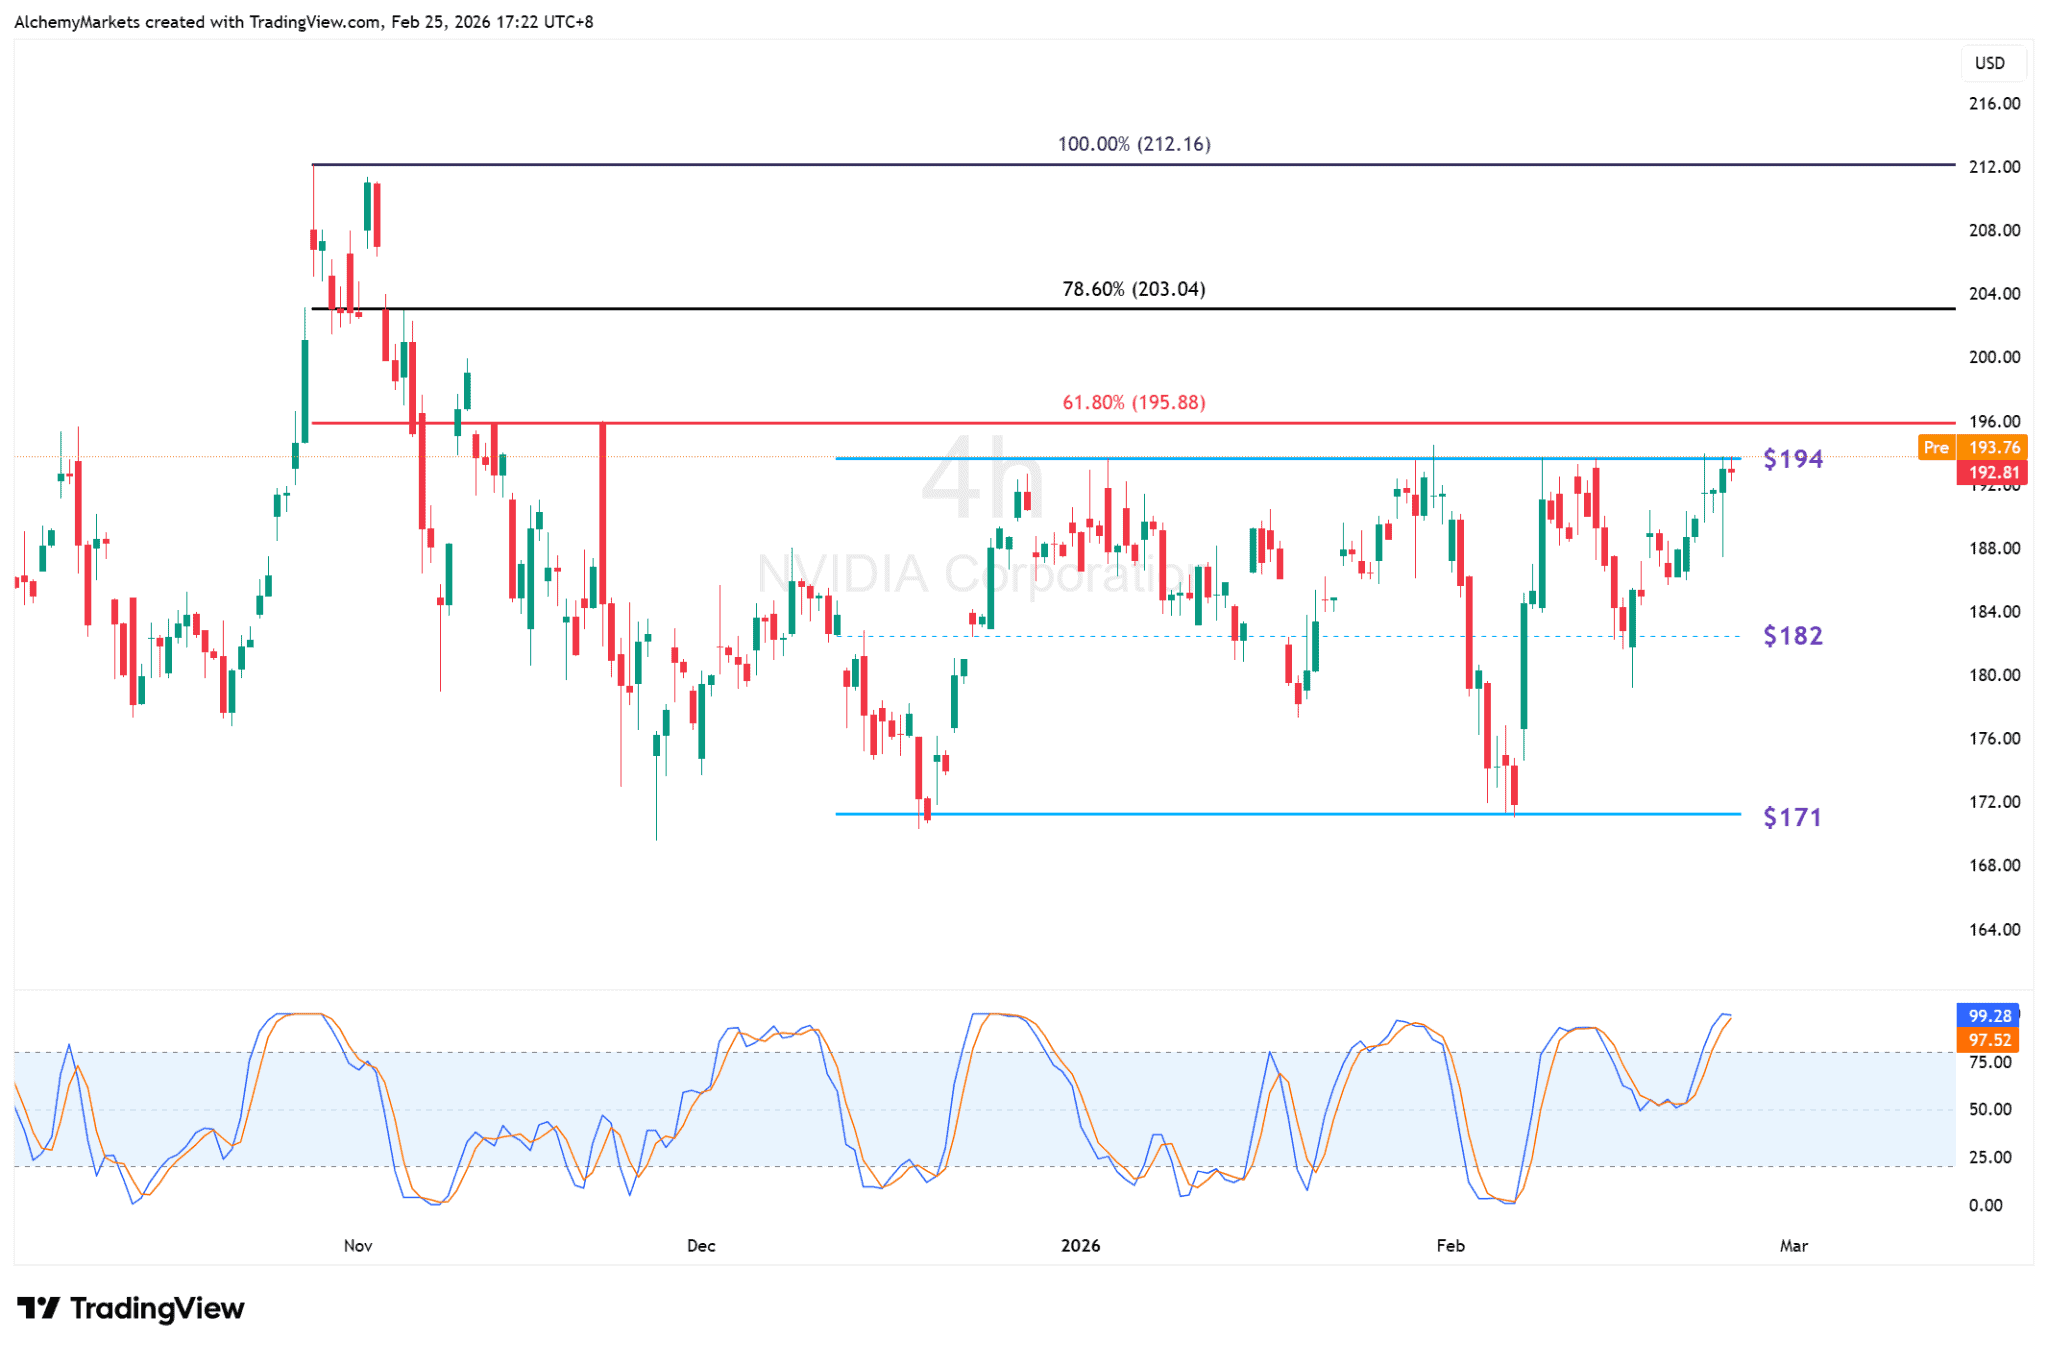
Just above the range however, sits a critical resistance at $196 (61.8% Fibonacci retracement), formed by the decline created in November 2025.
This opens up the possibility of a fakeout as we break above $194; watch for a potential rejection at $196.
Price action is stalling as traders focus on two critical AI hardware catalysts:
Blackwell Chips: Wall Street needs to know if the high manufacturing costs of these newly launched AI chips will squeeze Nvidia’s crucial 75% profit margins.
|
Vera Rubin Chips: Investors are listening closely for any teasers regarding Nvidia’s futuristic, next-generation chip architecture ahead of next month’s GTC event.
|
Here is how those fundamental answers will dictate the technical levels:
The Bullish Breakout: If Nvidia crushes expectations and eases margin concerns, look for a high-volume break above the $194 level. Clearing the $196 resistance invalidates any fakeout fears and opens the runway to retest all-time highs.
|
The Bearish Rejection: If earnings disappoint or Blackwell costs severely compress margins, that $194-$196 zone will act as a brick wall. A sharp rejection there could send the price spiraling back through the $182 mid-range, exposing the $171 support floor.
|
After smacking into the $7,000 psychological ceiling, the S&P 500 has whipsawed within a broad macro range of $6,700 to $6,990.
But if you zoom in on recent days, a tighter, more actionable micro-range is building between $6,830 and $6,900. The index is currently respecting the 1-hour 200-EMA, with only minor deviations.
S&P 500 1H Chart
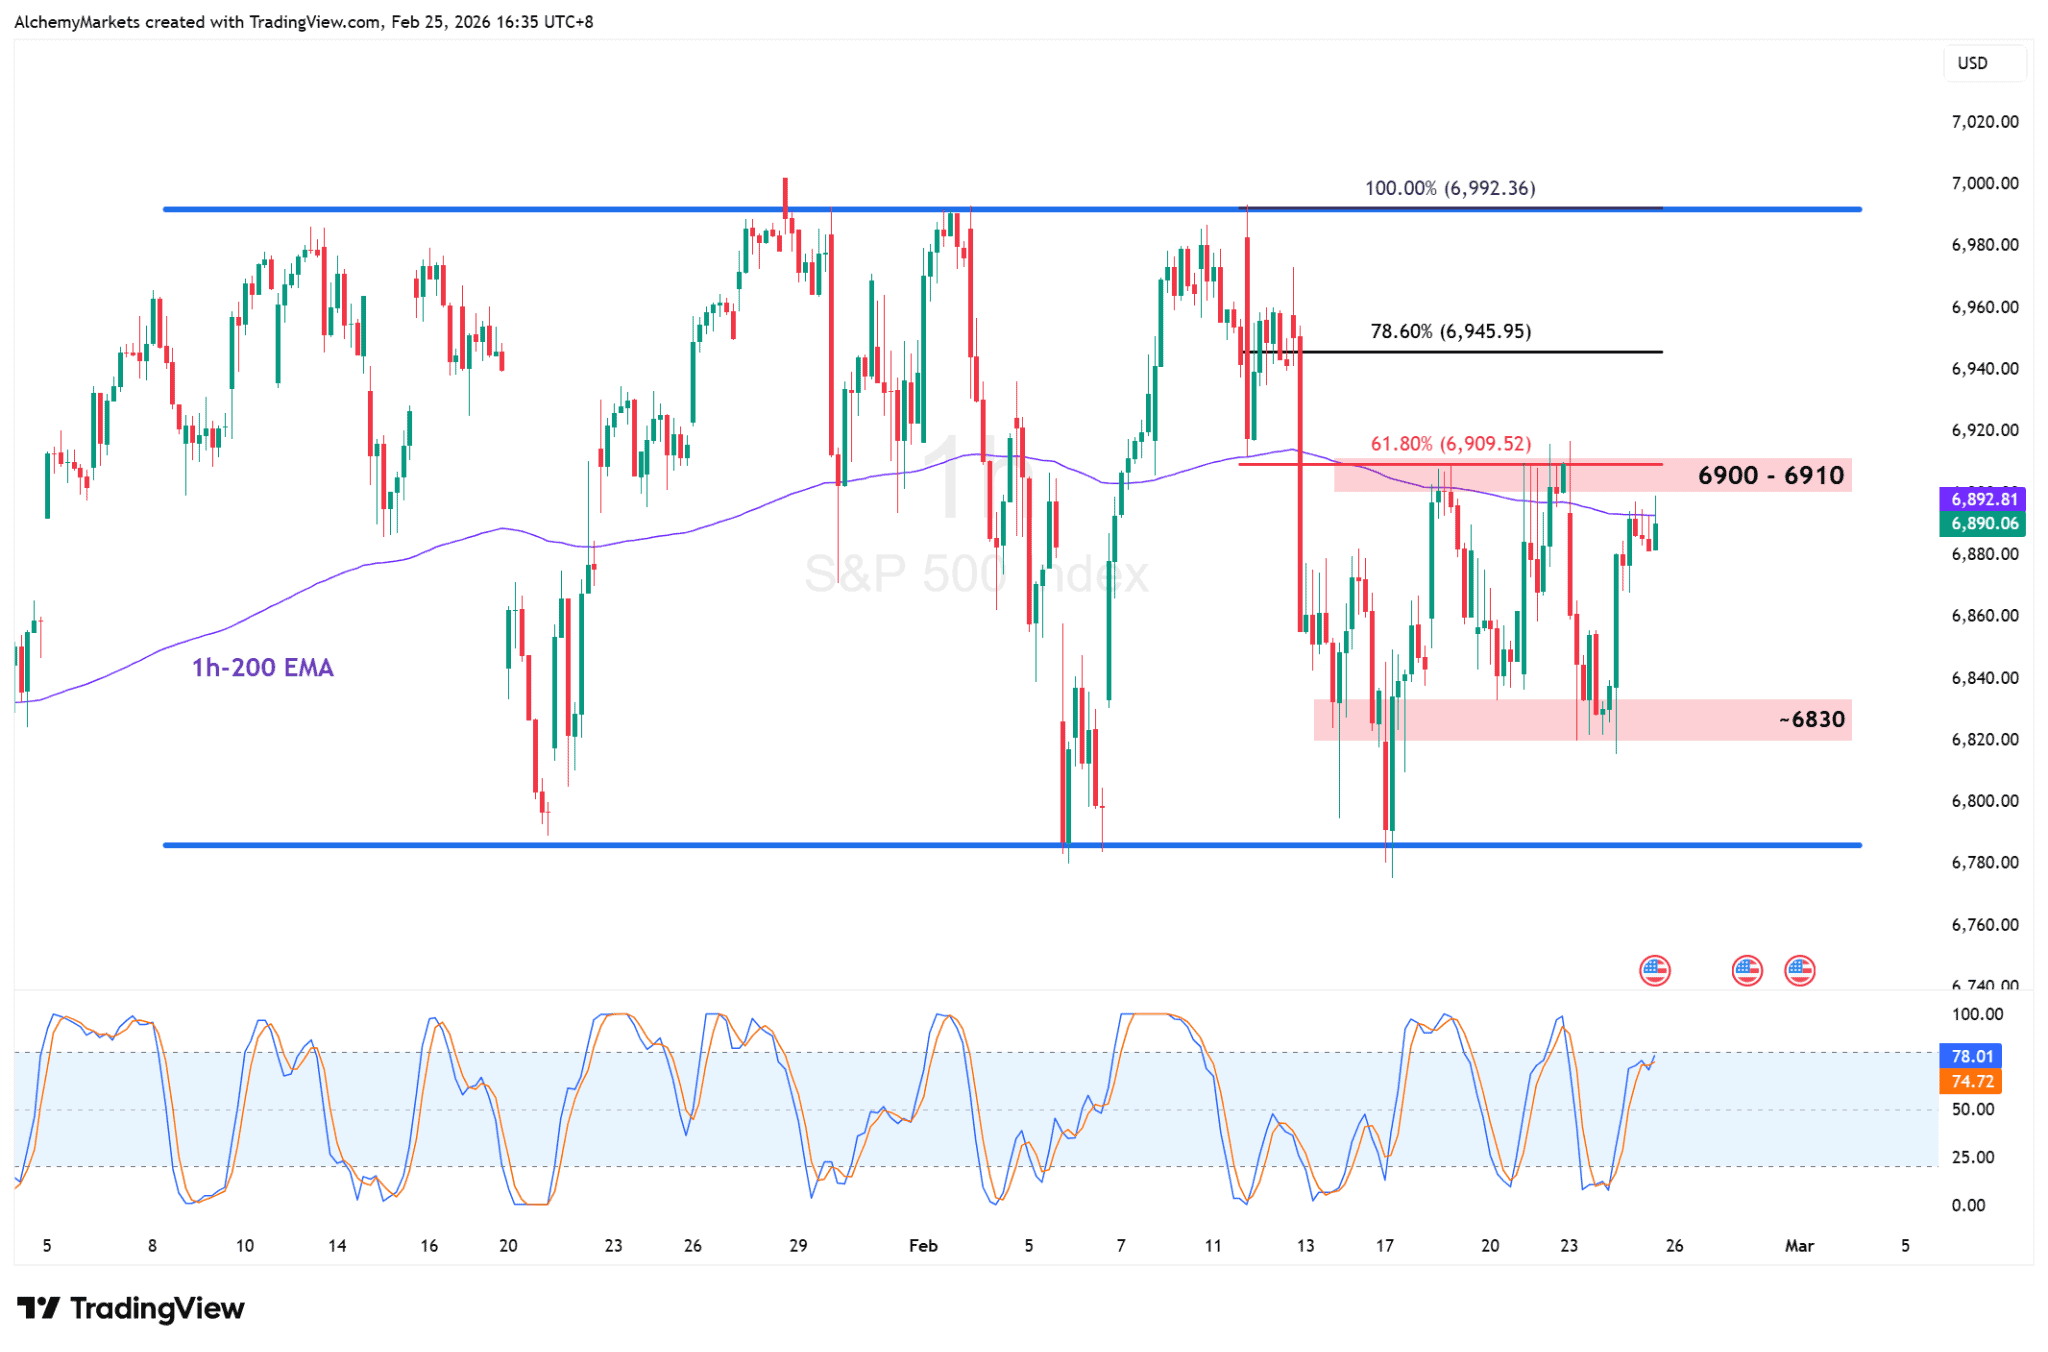
Looking at the 1H chart above, notice three key technicals:
We are whipsawing again, but more importantly, the index is currently pinned below the 200-EMA.
|
This consolidation formed right after a rejection at the $6,909 level (the 61.8% Fibonacci resistance drawn from the steep early-February decline).
|
The 1H Stochastic RSI is curling into overbought territory, signaling potential bullish exhaustion.
|
If Nvidia earnings beat, price could break the mini range to the upside, towards $6,990 to $7,000.
If earnings disappoint, it opens up a trading opportunity within the tight range — e.g. a rejection from $6,900 to $6,830.
If the numbers merely meet expectations, sit on your hands, watch the price action, and let the market choose its direction before committing.
DISCLAIMER: For educational purposes only. Trading comes with substantial risk, leading to possible loss of your capital. Traders are advised to do their own due diligence before investing.
You may also be interested in:
Alchemy Markets is a multi-asset brokerage providing retail traders with the same elite trading conditions, tools, and transparency typically reserved for institutions.
Select the categories and companies you wish to follow directly to your person rss feed.
Create Custom RSS Feed
just now
Sign up and join over 5,000 professional members who receive personalized news alerts, curated professional connections, and more for free!
Retail futures trading leader NinjaTrader Group has appointed Mark Omens as Senior Vice President, Commercial Strategy, bringing a 25-year veteran of derivatives marketplace CME Group into a newly created role focused on exchange partnerships and enterprise growth.
Gold Price Action Forecast: Will XAU/USD Drop to $3930? Meta Description: Read our Gold price action forecast to see if XAU/USD will drop to $3930.
BitDelta Securities Financial Services LLC (“BitDelta Securities”) today announced that it has received full regulatory approval from the Capital Market Authority (“CMA”) of the United Arab Emirates under the Category 5 — Arrangement and Advice license framework (License No. 20200000439). The approval follows the firm's receipt of In-Principal Approval earlier this year and represents the successful conclusion of the CMA's full licensing process, including the satisfaction of capital requirements, governance appointments, and operational setup.
Crypto.com has received a $400 million strategic investment from Citadel Securities, valuing the firm at $20 billion. It marks the first institutional funding round in the company's history, aimed at accelerating its expansion into tokenised securities, derivatives and other asset classes.
WTI’s pullback into $79–82 is the first major test of the bullish Elliott Wave count, with buyers targeting a renewed break above $85.

BitDelta Securities has secured a full CMA Category 5 licence in the UAE and opened a regulated office in Business Bay, Dubai. The firm operates as an introducing broker, connecting investors with licensed international brokers across multiple asset classes, with CEO Dr. Demetrios Zamboglou commenting on the milestone.
Index volatility is asleep while single stocks fight it out underneath, credit refuses to confirm the equity rally, and a bare macro calendar hands next week to oil.
Digital assets and FX brokerage GC Exchange FZE (GCEX) has appointed Mohammed A. Mulla as a Board Member of its Dubai-based entity, part of the wider GCEX Group.
Learn what Blockchain-as-a-Service is, how it works, and why businesses are using BaaS to build blockchain applications without managing infrastructure.
CFDs vs stocks compared on leverage, ownership, costs, dividends, taxes, and risk. Learn the differences between stocks and CFDs and discover which suits your investing or trading goals.