Explore Companies BySectors & Categories
Explore Companies ByUse Cases
Explore Companies ByProducts & Services
Explore Companies ByRankings & Reviews
Featured NewsCompaniesMarketsCryptoTechRegulatoryCommentaryUKUSWorldMore

    Latest Wires

      Daily Newsletter

      LF Daily News

      Daily industry focused newsletter giving you an overview for the financial & finTech industry.

      See All Newsletters
      By clicking "Sign Up" you are agreeing to our Terms of Service and Privacy Policy

      A Guide to Master a Price Action Strategy That Works in Any Market: Complete Guide on How to Trade with Market Structure + Support & Resistance (Step-by-Step)

      Published: just now

      A Guide to Master a Price Action Strategy That Works in Any Market: Complete Guide on How to Trade with Market Structure + Support & Resistance (Step-by-Step)

      Post illustration


      Goal of this lesson


      By the end of this guide, you will be able to:

      1. Understand market structure and trend direction
      2. Identify support and resistance levels
      3. Recognize whether buyers or sellers are in control
      4. Find higher-probability trading opportunities using price action


      Step 1: Understanding market structure


      Bullish market structure


      Post illustration


      Price Action Analysis. Bullish Market Structure Movement


      Post illustration


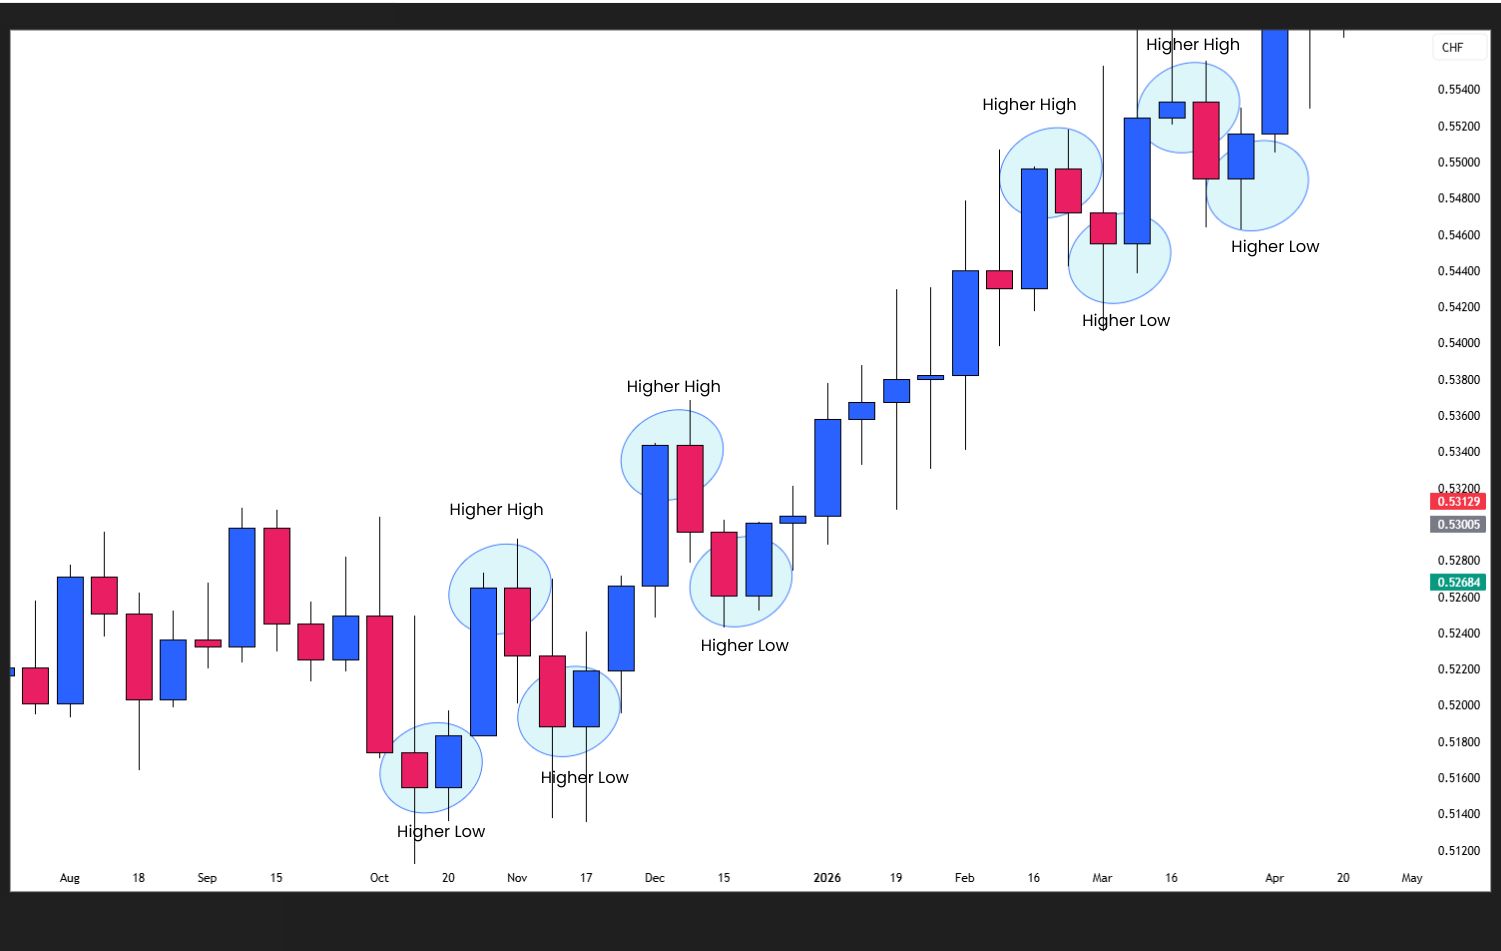
      Price Action Analysis. Bullish Market Trend


      A bullish trend/ uptrend forms when price creates:

      1. Higher Highs (HH)
      2. Higher Lows (HL)


      This shows that buyers remain in control and this is the reason why price is likely to continue moving higher.


      Want to understand how to identify higher highs and higher lows? Check out these blogs to learn how to read market structure more clearly:


      1. A Guide to Master a Strategy that Works in any Market: The Structure of a Market Trend
      2. A Guide to Master Price Action Strategy that Works in Any Market: How to Master the Trend in Trading Any Market
      3. How to Step-by-Step Swing Trade Gold (XAU/USD) with Pure Technical Price Action Analysis?


      What is the building block of a bullish market structure?


      Post illustration

      Price Action Analysis. Bullish Market Structure Movement


      Post illustration

      Price Action Analysis. Building Blocks of a Bullish Market Structure


      Scene idea:

      1. Bullish rally to the upside
      2. Bearish pullback to the downside
      3. Rejection at a potential higher low
      Note: Past performance is not a reliable indicator of future results.


      Bearish market structure


      Post illustration

      Price Action Analysis. Bullish Market Structure Movement


      Post illustration

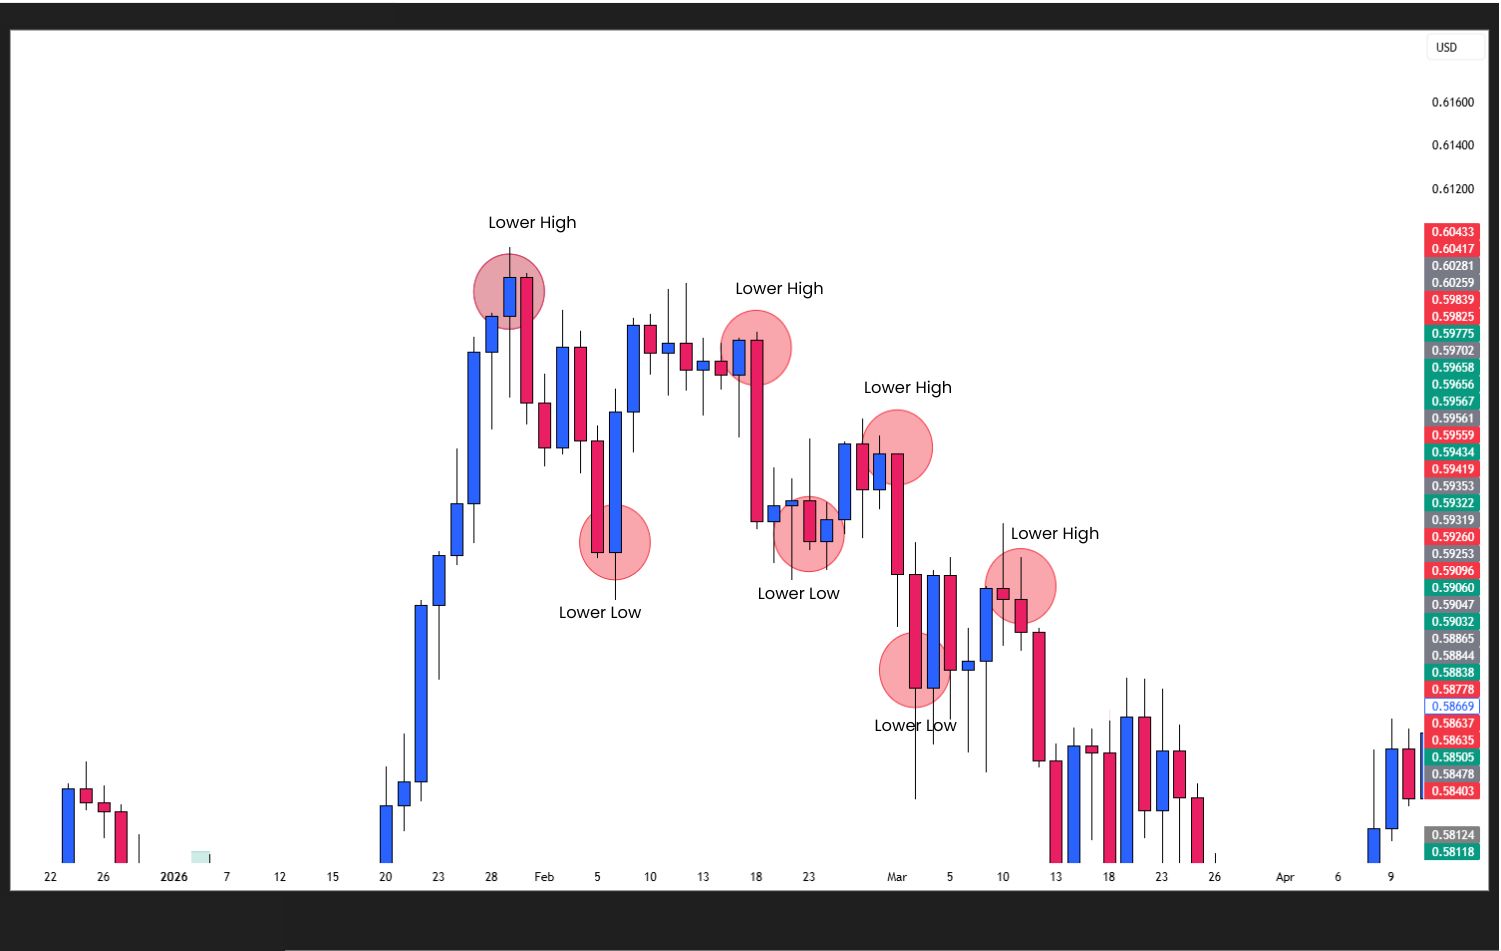
      Price Action Analysis. Bearish Market Trend


      A bearish trend/ downtrend forms when price creates:

      1. Lower Highs (LH)
      2. Lower Lows (LL)


      What is the building block of a bearish market structure?


      Post illustration

      Price Action Analysis. BearishMarket Structure Movement


      Post illustration

      Price Action Analysis. Building Blocks of a Bearish Market Structure


      Scene idea:

      1. Bearish rally to the downside
      2. Bullish pullback to the upside
      3. Rejection at a potential lower high


      Note: Past performance is not a reliable indicator of future results.


      Want to understand how market structure is built? Explore these in-depth guides below:


      1. A Guide to Master a Strategy that Works in any Market: The Structure of a Market Trend


      Consolidating market structure


      Post illustration

      Price Action Analysis. Consolidating Market Structure Movement


      Post illustration

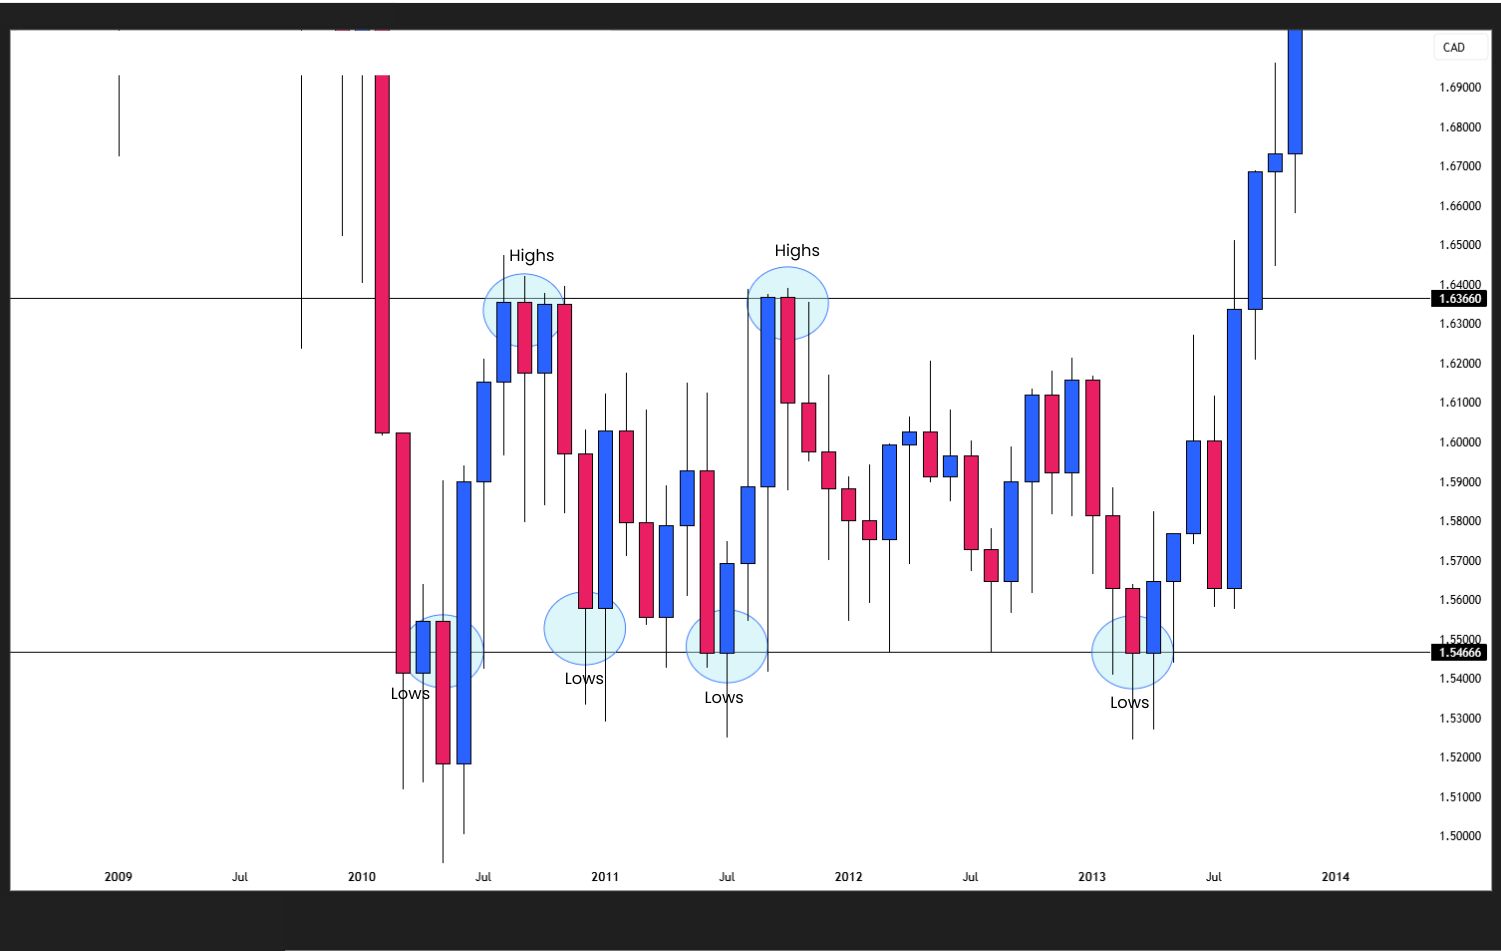
      Price Action Analysis. Ranging Market Trend


      A consolidating/ ranging or accumulating market forms when price creates:

      1. Lows
      2. Highs


      During this phase, price typically moves sideways within a defined range, with neither buyers nor sellers in clear control.


      Because the market lacks a strong directional trend, this type of market structure is generally best avoided by trend traders, as it can lead to false breakouts and unpredictable price movements.


      Note: Past performance is not a reliable indicator of future results.


      There is a specific trading setup for consolidating markets. To learn how to identify and trade it, check out our blogs:


      1. Break and Retest: A Simple Repetitive Price Action Pattern?
      2. Break and Retest: How to Capitalize Repetitive Patterns in Trading?


      Step 2: Identifying key levels


      Support

      Post illustration

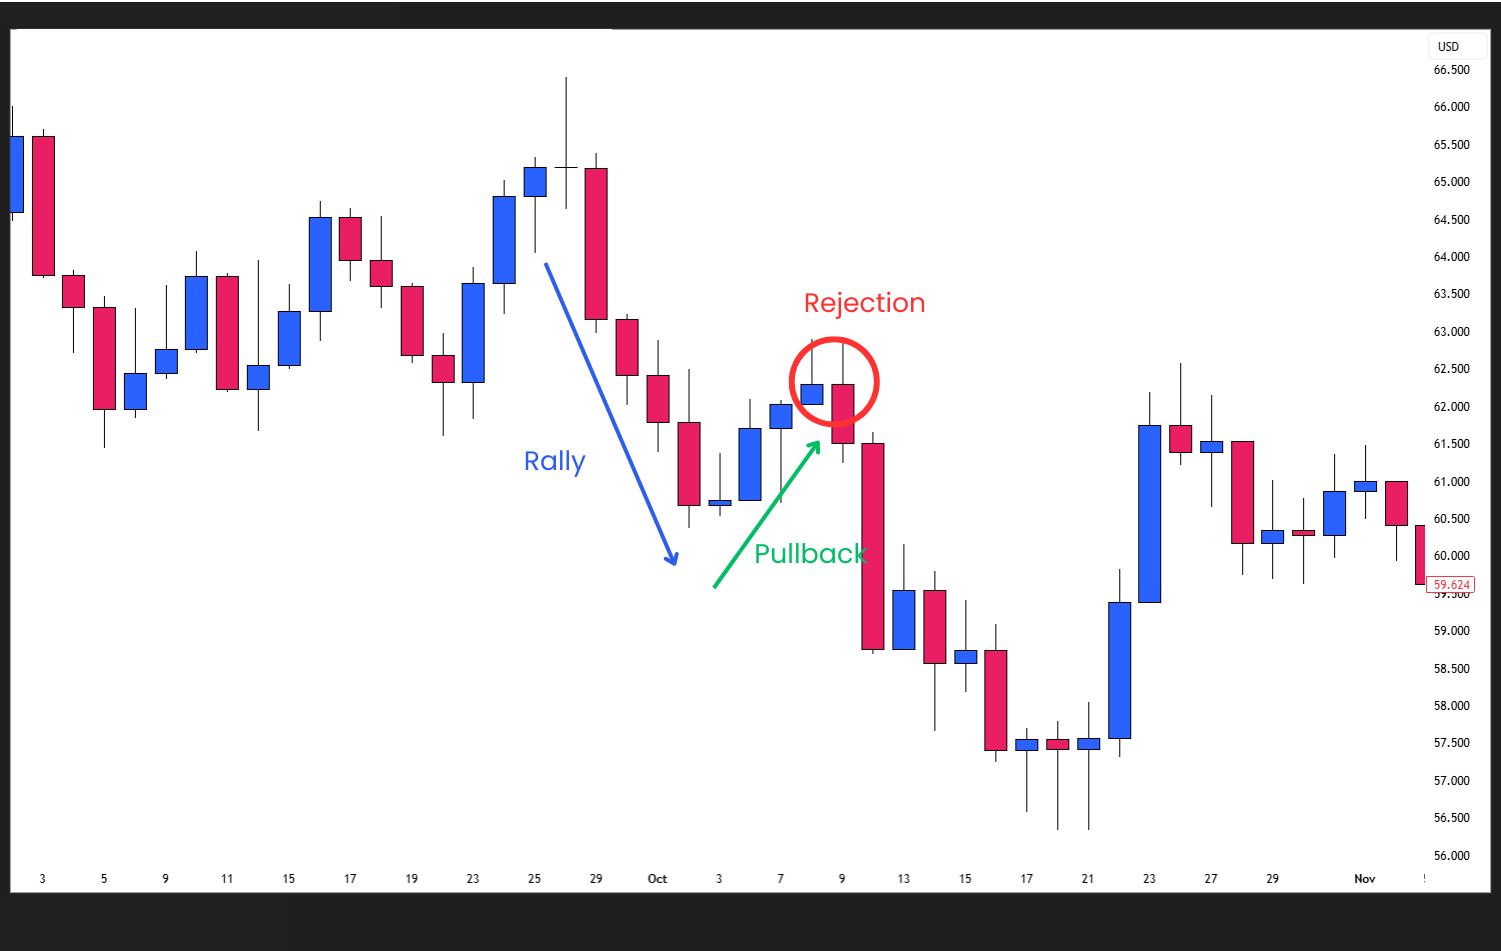
      Price Action Analysis. Rejecting at a Support Key Level


      Support is an area where buying pressure becomes strong enough to prevent price from falling further.


      Signs of support level:

      1. Previous rejections or reaction at the level
      2. Price is above the level
      3. Price reacts upward
      4. Buyers defend the level
      5. Selling pressure weakens


      Golden nugget:

      When price is above the level, the level will automatically act as a support.


      Resistance


      Post illustration

      Price Action Analysis. Rejecting at a Resistance Key Level


      Resistance is an area where selling pressure becomes strong enough to stop price from moving higher.


      Signs of resistance level:

      1. Previous rejections or reaction at the level
      2. Price reacts downward
      3. Sellers defend the level
      4. Buying pressure weakens


      Golden nugget:

      When price is below the level, the level will automatically act as a resistance.


      To better understand how key support and resistance levels works, checkout this educational video:


      1. A Guide to Master a Strategy that Works in Any Market: How to Identify Support and Resistance Levels?


      Step 3: Combine both market structure and Support & resistance level


      Bullish setup


      Post illustration

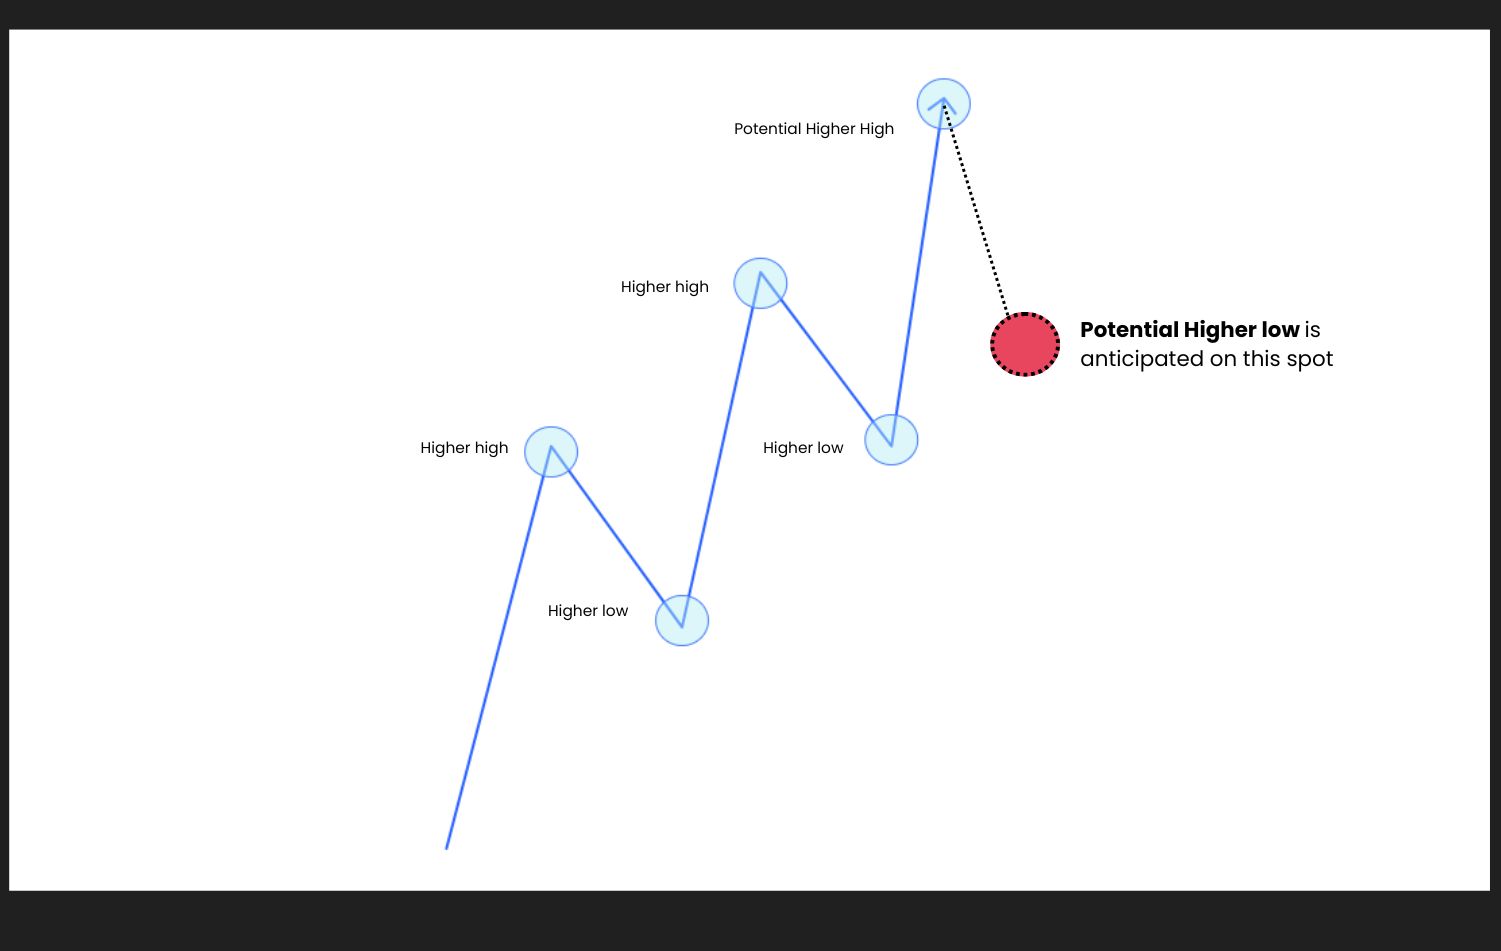
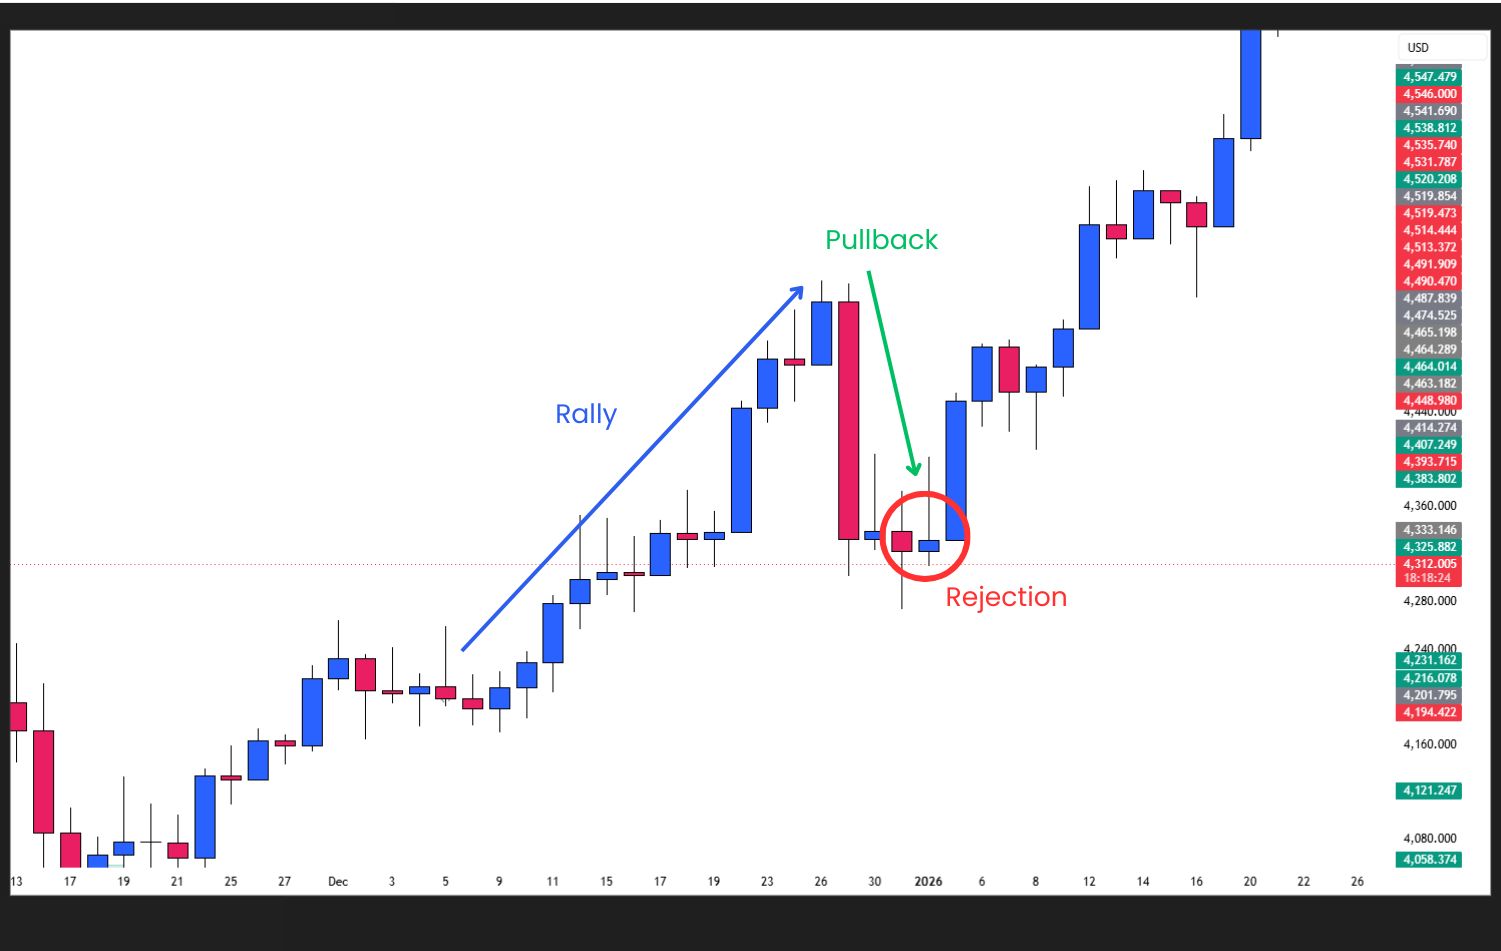
      Price Action Analysis. Higher High and Higher Lows Structure


      Buys should always be anticipated at a potential higher low structure.

      Post illustration

      Price Action Analysis, Buys Anticipated at a Potential High Low & at a Support Level


      Market structure:

      1. Bullish market structure
      2. Clearly price is moving in an uptrend


      Key level:

      1. Support level
      2. Price is above the level and retesting


      Note: Past performance is not a reliable indicator of future results.


      Bearish setup


      Post illustration

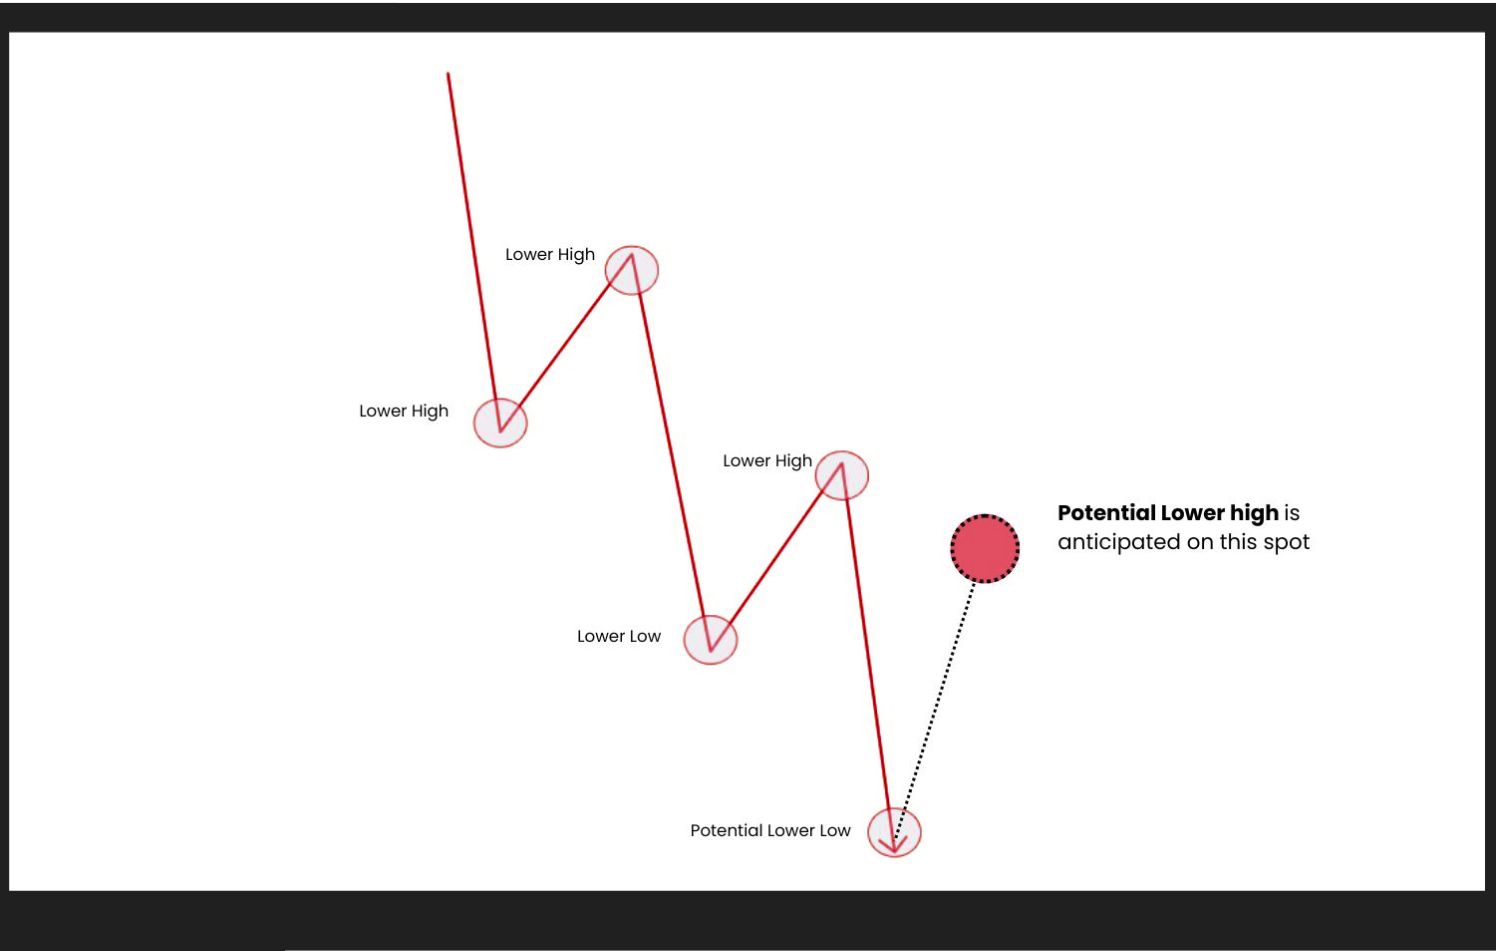
      Price Action Analysis. Lower Highs & Lower Lows Structure


      Sells should always be anticipated at a potential lower high structure.

      Post illustration

      Price Action Analysis, Sells Anticipated at a Potential Lower High & at a Resistance Level


      Market structure

      1. Bearish market structure
      2. Clearly price is moving in a downtrend


      Key level

      1. Resistance level
      2. Price is below the level and retesting it
      Note: Past performance is not a reliable indicator of future results.


      To better understand how both market structure and support & resistance used in a real chart, checkout this educational video:


      Real-life analogy

      Post illustration


      Imagine climbing a staircase.


      The stairs represent the market structure, showing whether you're moving up or down.


      The landings represent support and resistance, where price often pauses before continuing or reversing.


      By understanding both, you can better anticipate where price is likely to react.


      Final thoughts


      Post illustration


      Successful trading isn't about predicting every market move, it's about reading what price is telling you.


      By combining market structure, support and resistance, candlestick confirmation, and the 50 EMA, you can better identify who is in control, avoid emotional decisions, and focus on high-probability trading opportunities.


      Always remember:

      The goal isn't to predict the future, it's to patiently wait for price action to confirm the next opportunities.


      Now you already know how to trade using price action by utilizing both market structure and support & resistance level then:


      Your next step is:

      1. To know trader’s beginner steps before your trade
      2. Mastering your psychology
      3. Mastering the simple price action strategy
      4. Mastering Repetitive Patterns in Trading
      5. Trading live using this simple price action strategy


      For more in-depth market breakdowns, real-time analysis, and structured learning content, you can join our Discord community inside ACY Server:

      Discord Server - ACY Securities Server


      Start your live trading journey today!

      • Trade Forex, indices, gold, crypto and other global markets

      • Access powerful platforms including ACY, MT4, MT5, and Copy Trading tools


      Move from learning simple price action to executing it in the real market with confidence!


      Create an Account. Start Your Live Trading Now!


      Check out my contents:

      Beginners path

      Build a strong trading foundation with step-by-step lessons designed for beginners:

      1. Beginner Trading Steps: 4 Rules to Follow Before You Trade
      2. Beginner Trading Steps: Mistakes That Can Slow Down Your Progress (And How to Avoid Them)
      3. The 1% Risk Rule: The Most Common Mistakes That Quietly Destroys 90% of Traders

      Mastering popular forex pairs using simple price action strategy

      Ready to learn simple price action strategy? Here’s how to do it step by step:

      1. USD/JPY Analysis Today: Simple Trades, Clear Moves, for Beginners Using Price Action
      2. Simple Day Trade Price Action On EUR/USD: Why the Drop to 1.14190?
      3. Simple Price Action Analysis on EUR/CAD: EURCAD the Pair for the Week?
      4. Simple Price Action Strategy on USD/ CHF: 0.80000 the Key Ceiling for USD/CHF Sell?
      5. Price Action Analysis for GBPCAD Trade: A Potential Trade for This Week or Next Week?
      6. EUR/GBP Trading Guide: How to Spot High-Probability Setup a Week Ahead Using Simple Price Action Strategy?
      7. Simple Price Action Trade on CAD/JPY: 115.000 the Key Floor for CAD/JPY Buy?
      8. USD/JPY Price Action Outlook: Is 158.500 the Key Floor for a Potential New High?
      9. CAD/JPY Price Action Breakdown: We Anticipated the Move Twice to 116.500, Is Price Action Really the King?
      10. GBP/NZD Trade Ideas Using Simple Price Action Strategy: Will Price Drops to 2.28000?
      11. USD/JPY Technical Forecast: 158.500 Floor Retest for Preparing for New Highs?
      12. GBP/CHF Price Action Ideas: Is 1.05500 the Ceiling for a New Low?
      13. GBP/CAD Simple Forex Price Action Ideas: Is the 1.84500 Support Level Holding?
      14. AUD/USD Simple Price Action Forecast: Why Buy at 0.71700 Support Area?
      15. GBP/NZD Price Action Idea: Is GPB/NZD 2.3000 Key Floor for Bullish Continuation?
      16. GBP/USD Price Action: Trade Setups on a Ranging Market?
      17. USD/CAD Simple Price Action: Is 1.36500 the Key Bullish Floor?
      18. USD/CAD Price Action Ideas: Setting Up for the Next Bullish Push?
      19. EUR/JPY Price Action: Is It Retesting a Reversal Pattern?
      20. NZD/USD Forecast: Potential Consolidation Breakout on NZD/USD?
      21. AUD/JPY Price Action Forecast: Is AUD/JPY Setting Up for a Massive Sell?
      22. NZD/USD Price Action Forecast: Is a Reverse Double Top Pattern Forming?
      23. NZD/USD Price Action Forecast: Is a Reverse Double Top Pattern Forming?
      24. AUD/CHF Forex Price Action Idea: Are Sellers Defending the 0.56504–0.56200 Key Level?

      Master how to identify market trend

      Learn how to identify bullish, bearish, and sideways markets using price action to make more informed trading decisions:

      1. A Guide to Master Price Action Strategy that Works in Any Market: How to Master the Trend in Trading Any Market
      2. A Guide to Master a Strategy that Works in any Market: The Structure of a Market Trend

      Learn of how to identify support and resistance

      1. A Guide to Master a Strategy that Works in Any Market: How to Identify Support and Resistance Levels?

      Master how to use break & retest pattern

      Ready to learn and capitalize the repetitive patterns in the markets? Here’s how to do it step by step:

      1. Break and Retest: A Simple Repetitive Price Action Pattern?
      2. Break and Retest: How to Capitalize Repetitive Patterns in Trading?
      3. EUR/JPY Price Action: Is It Retesting a Reversal Pattern?

      Master how to use candlestick confirmation & patterns

      Discover how candlestick patterns can help confirm market direction:

      1. The Top Japanese Candlestick Patterns to Trade: Mastering Japanese Candlestick Confirmation + Pairing with Price Action Analysis
      2. The Top Japanese Candlestick Patterns to Trade: How to Use the Engulfing Candlestick as a High-Probability Entry Signal

      Mastering the 50 EMA

      1. Master Exponential Moving Average: How to Trade using EMA Indicator with Price Action Analysis?

      Learn how to trade Gold

      Gold is still one of the most traded assets, here’s how to trade it with confidence:

      1. XAUUSD Price Action: A Beginner Buy Setup for Next Week
      2. How to Trade Gold Using Simple Price Action Outlook: 4500 the Key Zone for XAUUSD Buys?
      3. The Simplest Way to Trade XAU/USD Using Price Action Analysis: Buy and Sell Anticipation on Gold?
      4. XAU/USD Price Action: Will Gold Rally to $4,900 Today?
      5. Gold (XAU/USD) Price Action Forecast: Will XAU/USD Drop to $4650?
      6. Gold (XAU/USD) Trade Ideas: A Simple Price Action Analysis on Gold This Week?
      7. Gold (XAU/USD) Price Action Idea: A High-Probability Trade Setup on Gold?
      8. Gold XAU/USD Price Action Idea: Is a Bullish Momentum Coming?
      9. Gold (XAU/USD) Price Action Ideas: Will News Trigger a Breakout or Consolidation on Gold?
      10. How to Step-by-Step Swing Trade Gold (XAU/USD) with Pure Technical Price Action Analysis?
      11. Gold XAU/USD Price Action Forecast: Anticipating a Consolidation Breakout on Gold Again?

      Swing trading 101

      1. How to Step-by-Step Swing Trade Gold (XAU/USD) with Pure Technical Price Action Analysis?

      Learn how to trade crypto with price action strategy

      1. Bitcoin BTC/USD Price Action: Could Bitcoin Still Keep Dropping?
      2. Bitcoin (BTC/USD) Price Action Insight: Could Bitcoin Still Drop to $58,000?
      3. Bitcoin (BTC/USD) Forecast Update: Has the $58,000 Correction Ended?

      Mastering trader's mindset

      Your mindset is what separates steady growth from costly mistakes. Focus on these essentials:

      1. Trading Mindset: Why Trading Exposes Who you Really Are?
      2. Consistency in Trading is Key: Why Discipline Beats Intelligence?
      3. Overtrading: Why More Trades Do Not Mean More Profits?
      4. Trading Wick Outs: How to Handle Fake Outs and Market Losses?
      5. Trading Psychology: The Truth About Trading Success

      Risk Management Series

      Learn the essential risk management strategies to protect your capital, manage losses, and trade with confidence:

      1. Risk Management in Trading: What Is the Secret to Long-Term Trading Success?

      Beginner trading roadmap

      Not sure where to begin? Here’s a simple roadmap to guide you:

      1. Common beginner Traders Mistakes → avoid overtrading, revenge trading, and chasing the market.
      2. Master Traders Psychology → build discipline, patience, and emotional control
      3. Mastering Risk Management → learn how to have a sustainable trading.
      4. Master Simple Technical strategies & Indicators → especially price action, key levels, and market structure.
      5. Applying to Real Market → forex, crypto and indices.


      By building step by step; from basicsreal tradingmastering the craft, you’ll gain clarity, confidence, and steady progress without ever feeling overwhelmed.


      Follow me for more daily market and educational insights!

      Ruffy Grant B. Capacio - LinkedIn

      Acy Securities - Discord


      Disclaimer:

      Trading forex and derivative instruments involves substantial risk and may not be suitable for all individuals. Only use funds that you are prepared to lose. It is important to understand how these markets work and the risks involved before trading, and to seek independent financial advice if needed. All market analysis and insights shared are intended for educational and informational purposes only and should not be considered financial or investment advice. June 26, 2026

      ACY Securities is one of Australia's fastest growing multi-asset online trading providers, offering ultra-low-cost trading, rock-solid execution, technologically superior account management and premium market analysis.

      This content may have been written by a third party. LiquidityFinder makes no representation or warranty and assumes no liability as to the accuracy or completeness of the information provided, nor any loss arising from any investment based on a recommendation, forecast or other information supplies by any third-party. This content is information only, and does not constitute financial, investment or other advice on which you can rely.
      Comments
      Most Recent
      Written By
      Daily Newsletter

      LF Daily News

      Daily industry focused newsletter giving you an overview for the financial & finTech industry.

      See All Newsletters
      By clicking "Sign Up" you are agreeing to our Terms of Service and Privacy Policy
      RSS Feeds

      Create a custom RSS Feed

      Select the categories and companies you wish to follow directly to your person rss feed.

      Create Custom RSS Feed

      Related Categories:

      Related Tags:

      #ProviderNews#TradingPlatform#MarketNews#FinTech

      Related Articles:

      Find The Right Partners for
      Your Trading Business

      Sign up and join over 5,000 professional members who receive personalized news alerts, curated professional connections, and more for free!

      Create Your FREE Account
      Get access to latest news, updates, real-time data, brokerage and trading firm insights and customized information feeds.

      Want to master a price action strategy? Learn how to read market structure, spot support and resistance, and find high-probability setups in any market.

      just now

      Zerohash has launched Portfolio Strategies, enabling brokerages and wealth platforms to create, manage, and rebalance crypto portfolios across all investors via a single integration. Copy trading platform dub has signed on as launch partner, having also served as a design partner in the product's development.

      just now

      Fund infrastructure provider trademakers, a brand of Sterling Gent Trading Ltd (SGT), is making the case for a modern alternative to the MAM and PAMM account structures that money managers have relied on since the early 2000s.

      just now

      London-based FCA-regulated agency broker Alp Financial (AlpFin) has appointed Tal Dar as Managing Director in the UK, LiquidityFinder can reveal. Dar joins from multi-asset broker Vantage UK, where he led institutional sales for the firm's Vantage Connect business.

      just now

      Hantec Markets, a global trading platform, has partnered with Brokeree Solutions to power its Hantec Social. The integration brings copy trading and managed account services to Hantec Markets' client base across MetaTrader 4 and MetaTrader 5. Combined with the PAMM service that Hantec Markets previously launched using Brokeree's technology, both solutions are now powered by the same provider.

      just now

      DTCC's NSCC has gone live with 24x5 clearing, operating Sunday to Friday to support extended-hours trading across U.S. equities. The move enables central counterparty clearing across time zones, with exchanges expected to follow in late 2026.

      just now

      Morgan Stanley Wealth Management has re-registered its PMAX fund as PMAX - Balanced, removing the accredited investor requirement and lowering minimums to $10,000, while launching PMAX - Growth targeting long-term capital appreciation through private equity. Both funds offer daily subscriptions.

      just now

      TRAction has launched an integration with TraderEvolution, enabling automated EMIR and MiFIR transaction reporting. The solution supports direct data extraction from the TraderEvolution platform, reducing manual intervention and helping regulated firms meet European and UK reporting obligations more efficiently.

      just now

      Apple just paid the AI tax, and a holiday-shortened week hands the market one jobs report it cannot ignore.

      just now

      Want to survive the markets? Risk management in trading is the secret to long-term success. Learn the best trading risk percentage to protect your capital.

      just now
      Feed